Abstract
Mitochondrial calcium uptake plays critical roles in regulating ATP production, intracellular calcium signaling, and cell death. This uptake is mediated by a highly selective calcium channel called the mitochondrial calcium uniporter. Here, we determined the structures of the pore-forming MCU proteins by X-ray crystallography and single-particle cryo-electron microscopy. The stoichiometry, overall architecture, and individual subunit structure differed markedly from those in the recent nuclear magnetic resonance structure of the Caenorhabditis elegans MCU. In our studies, we observed a dimer-of-dimer architecture across species and chemical environments, which was corroborated by biochemical experiments. Structural analyses and functional characterizations uncovered the roles of critical residues in the pore. These results reveal a new ion channel architecture, provide insights into calcium coordination, selectivity, and conduction, and establish a structural framework for understanding the mechanism of mitochondrial calcium uniporter function.
Mitochondrial calcium (Ca2+) uptake is pivotal for fundamental cellular processes such as ATP production, cell death, and cytosolic Ca2+ signaling1–3. Rapid mitochondrial Ca2+ uptake is mediated by an ion channel called the mitochondrial Ca2+ uniporter4–6. The uniporter resides in the inner mitochondrial membrane, is remarkably selective for Ca2+, has high conductance, and is inhibited by ruthenium red1,7. During cytoplasmic Ca2+ signaling, local increases in the Ca2+ concentration activate the uniporter8,9, leading to significant Ca2+ influx.
Recent studies identified and established MCU as the essential pore-forming subunit of the Ca2+ conduction channel10,11,12,13. MCU shows higher-order oligomerization13,14 and bears no discernable sequence similarity to other known channels. It forms a multi-component complex with regulatory subunits, including MICU15–20, EMRE13,21,22, MCUb23, and MCUR116,24,25. MCU is ubiquitous in plants and metazoans and present in protozoans and fungi10,26. By contrast, EMRE is only found in metazoans and MICU is absent from most fungi21,26. Malfunction or deregulation of the uniporter complex has been linked to tumor progression, muscle weakness, neurological defects, and impairments in tissue regeneration27.
MCU is characterized by a highly conserved signature DXXE motif, two transmembrane (TM) helices, and flanking coiled coils26. Its N-terminal domain (NTD) shows reliable sequence conservation only among metazoan species. This observation begs the question: does MCU have a unified overall architecture? Recent nuclear magnetic resonance (NMR) studies of a Caenorhabditis elegans MCU (cMCU) core domain provided a first glimpse into the structure of MCU28. These investigations defined a pentamer architecture with a layered domain organization and revealed the formation of the inner core by TM2 and the pore-facing location of a critical glutamate residue in Ca2+ uptake28. However, the cMCU construct did not contain the NTD nor did it conduct Ca2+ by itself. Furthermore, without an apparent Ca2+ permeation route or defined chemistry of the selectivity filter in the NMR structure, the mechanism of Ca2+ coordination and permeation remains unclear.
Here, we determined the structure of MCU with all structural domains and capable of conducting Ca2+. Unexpectedly, our X-ray crystallography and cryo-electron microscopy (cryo-EM) studies revealed a dimer-of-dimer assembly of MCU. Both the overall architecture and the structure of each protomer were distinct from those of the cMCU by NMR, giving rise to a completely different pore. Our structures define the key elements of the Ca2+ permeation pathway and provide insights into Ca2+ selectivity.
Functional characterization and crystal structure of MCU
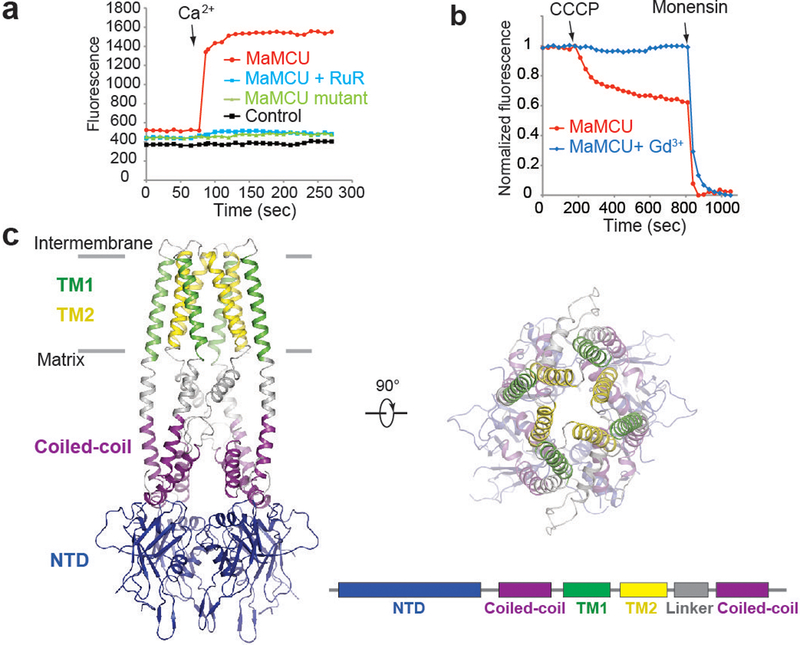
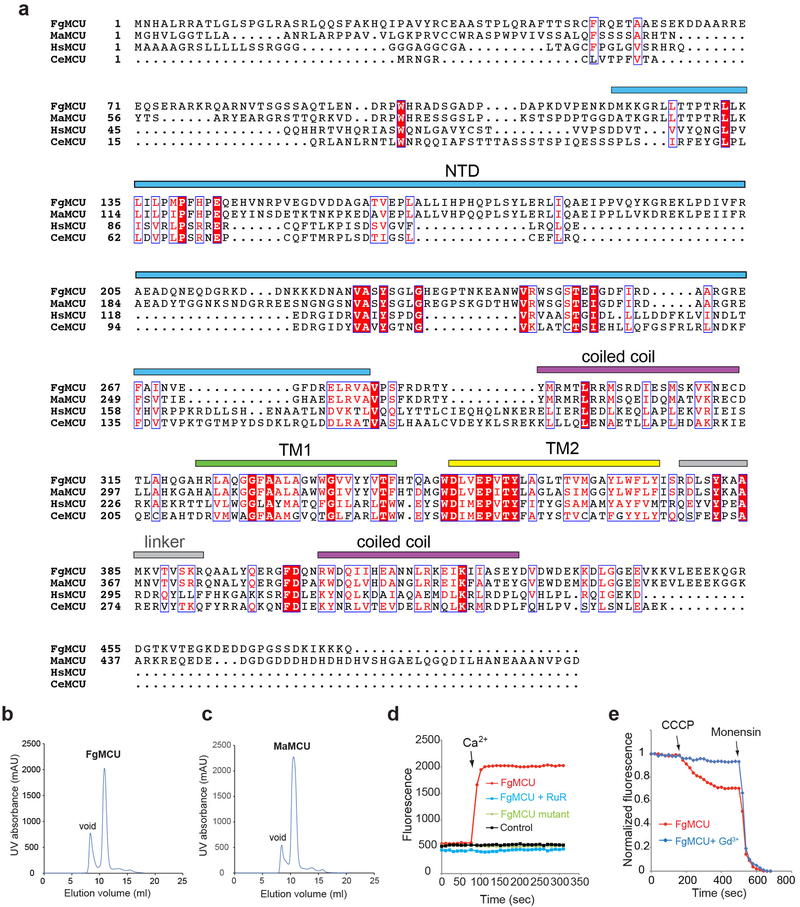
We identified two MCUs from fungi, Fusarium graminearum MCU (FgMCU) and Metarhizium acridum MCU (MaMCU) (Extended Data Fig. 1a), that showed excellent biochemical behaviors (Extended Data Fig. 1b, c). As EMRE is absent in fungi21 and another fungal MCU was shown to mediate mitochondrial Ca2+ uptake29, these MCUs were potentially sufficient for basic uniporter activity. In an E. coli-based system with the fluorescent Ca2+ reporter GCaMP2 (ref. 30), cells with wild-type (WT) MaMCU (Fig. 1a) or FgMCU (Extended Data Fig. 1d) showed robust Ca2+ uptake. This uptake was diminished by mutating residues critical for Ca2+ conductance10,11 or by adding the classic uniporter inhibitor ruthenium red (Fig. 1a, Extended Data Fig. 1d). Furthermore, when reconstituted in liposomes, purified WT MaMCU (Fig. 1b) and FgMCU (Extended Data Fig. 1e) showed robust ion conduction activity in a fluorescence-based flux assay31. The addition of Gd3+, another MCU inhibitor, abolished this activity (Fig. 1b, Extended Data Fig. 1e). Thus, MaMCU and FgMCU recapitulate key features of MCU and MCU is sufficient to form a pore.
Figure 1 |. Functional characterization and crystal structure of MCU.
a, Ca2+ uptake activity of MaMCU in E. coli. Fluorescence changes upon addition of 0.5 mM Ca2+ are shown for WT (red), D333A/E336A (green), and control (black). Ruthenium red (RuR) abolished WT uptake (blue). b, Cation flux activity of MaMCU in reconstituted liposomes. MCU efficiently conducts monovalent cations (e.g., Na+) when divalent cations are absent6. Vesicles containing 150 mM Na+ were assayed in 150 mM NMDG-containing buffer. Upon addition of proton ionophore (CCCP), Na+ efflux through MCU drives CCCP-mediated proton influx, quenching ACMA fluorescence. Liposomes with MaMCU showed robust fluorescence changes (red); Gd3+ addition abolished flux (blue). Na+ ionophore (monensin) was added to make liposomes permeable to Na+. c, MaMCU crystal structure. Ribbon representations of MaMCU viewed from membrane (left) or cellular (right) side. Each domain is colored according to subunit diagram (bottom right). Data in a-b are representative of three independent experiments with similar results.
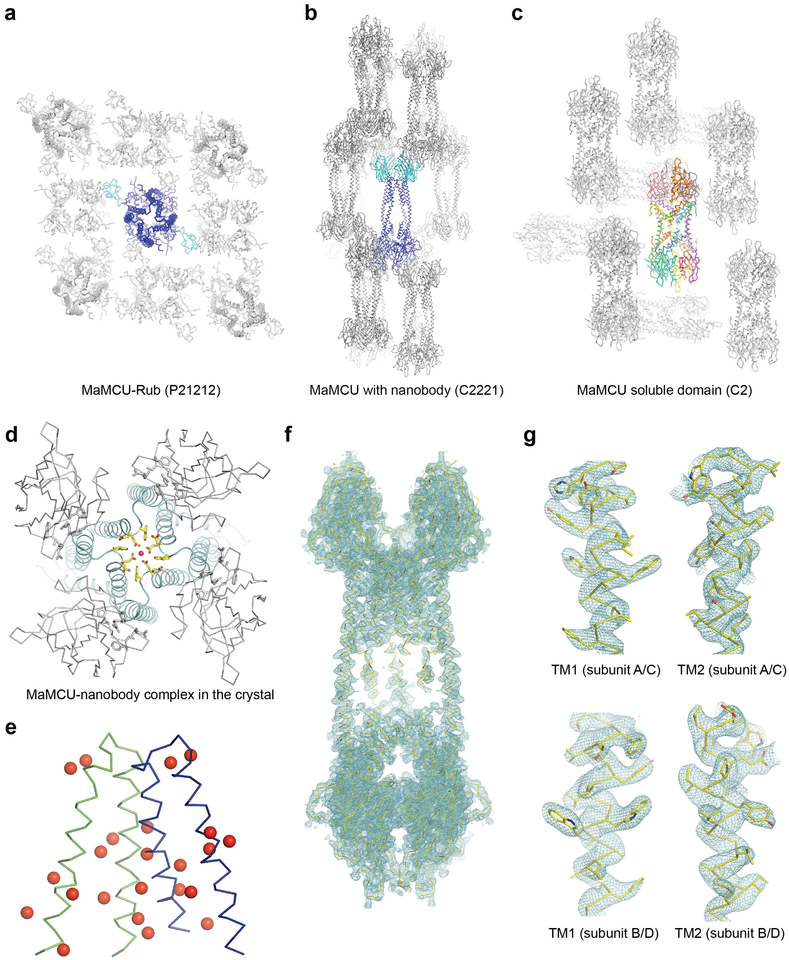
We obtained diffracting crystals of MaMCU either by inserting rubredoxin in an NTD loop or with nanobody bound (Extended Data Fig. 2a, b, d and Extended Data Table 1). As crystal with nanobody diffracted X-rays better (to ~ 3.1 Å) and showed considerably better electron density in the TM region, it was used for all structural interpretations. With 12 mercury sites introduced individually in the TM region (Extended Data Fig. 2e) and clear side chain densities (Extended Data Fig. 2f, g), we could unambiguously register and build the side chains.
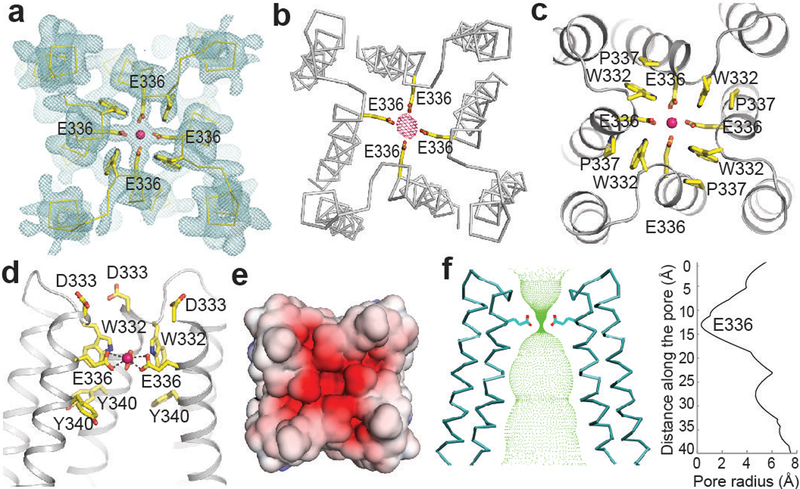
Figure 2 |. Ca2+ permeation pathway.
a, Electron density map around ion coordination region. Weighted 2Fo–Fc contoured at 3σ (cyan) and Ca2+ ion (pink sphere) are shown. b, Anomalous-difference Fourier map for Ca2+ at 4.5 Å contoured at 4σ (pink mesh). c, Ca2+ coordination in filter region viewed from top. Refined model (ribbon) and selected residues (sticks) are shown. d, Ca2+ coordination in filter region viewed within membrane, with front helices removed for clarity. e, Surface representation viewed from top, colored according to electrostatic potential. F, Ion permeation pathway. Ion-conducting passage (green dots) was calculated by HOLE. Pore radius is shown on right.
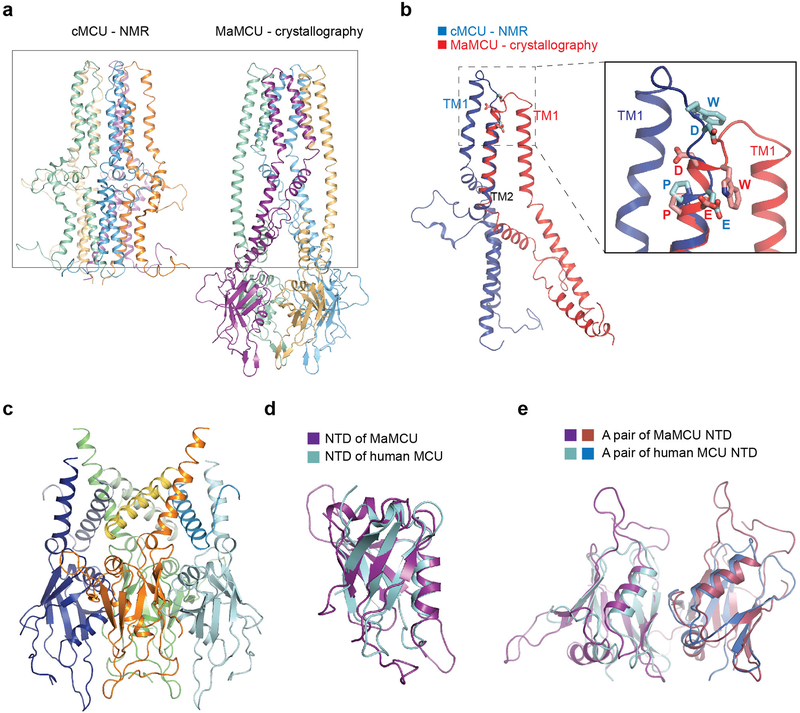
In the crystal, two crystallographically related dimers tightly interact, forming one MCU channel with a two-fold symmetry axis along the Ca2+-conducting pathway. MCU comprises three layers: a TM domain, a coiled coil, and an NTD, forming an elongated shape (Fig. 1c). Notably, the oligomerization state, architecture, and single-subunit structure (including the selectivity filter configuration, packing mode between TMs, and overall fold) of MaMCU differed from the published pentameric structure of cMCU (Extended Data Fig. 3a, b).
The transmembrane domain and the ion conduction pore
The TM domain has an approximately four-fold symmetry and the shape of a truncated pyramid (Fig. 1c). The two TM helices (TM1 and TM2) connect by a short loop. TM1 is located on the outside and TM2 lines the central ion conduction pore, consistent with the observation that TM1 of human MCU mediates the interaction with EMRE22. TM1 interacts loosely with TM2 of the same subunit and packs intimately against the TM2 from a neighboring subunit (Fig. 1c), producing a sense of domain swapping in the TM connectivity. In one pair of subunits, the connection between TM2 and the second helix of the coiled coil is not well ordered, indicating flexibility.
The pore of MCU is narrow at the top. Notably, in contrast to the assumption that the signature motif DXXE lies within a loop, DXXE spans the first helical turn of TM2 with the strictly conserved Asp333 and Glu336 constituting the first two pore-lining residues (Fig. 2d). Asp333 is located at the intermembrane end of TM2 and is solvent exposed. Its side chain density was less resolved than other key residues. In the modeled configuration, the Asp333 side-chain carboxylate does not directly point to the pore center, potentially providing negative charge for Ca2+ recruitment (Fig. 2e). Alternatively, if Asp333 takes the most common rotamer position, which points into the pore, its carboxylate ring could coordinate a hydrated Ca2+, given a diameter of ~8 Å. One helical turn below Asp333 is Glu336, whose carboxylate group points to the pore center (Fig. 2a, c). We observed a strong density along the central axis, consistent with a bound ion surrounded by the carboxyl oxygens of Glu336 (Fig. 2a). As the protein was purified and crystallized in the presence of 2 mM Ca2+ and no other divalent ions, we assigned Ca2+ at this location, which was further confirmed by a strong anomalous difference peak occupying the same location (Fig. 2b). The diameter of the Glu336 carboxylate ring is ~5 Å, too small for hydrated Ca2+ to go through. The observed Ca2+–oxygen distance (~2.4–2.7 Å; Fig. 2d) is consistent with direct coordination32. We thus propose that Ca2+ passes through a selectivity filter formed by the glutamate ring in a dehydrated form, similar to the direct coordination of Ca2+ by four aspartate side chains in TRPV6 (ref. 33). In between the side chains of two neighboring Glu336 is the indole ring of Trp332, which stabilizes the closely spaced carboxyl side chains of Glu336 through hydrogen bonds or anion-π interactions (Fig. 2c). Trp332 also forms a close stacking interaction with Pro337, a residue important for orientating Glu336 for Ca2+ coordination. The intimately interacting Trp332, Glu336, and Pro337 are thus essential for proper configuration of the selectivity filter, consistent with their strict conservation across species.
One helical turn below Glu336 (and two below Asp333) is Tyr340. The aromatic side chain of Tyr340 is lined along the wall of the pore, forming a passage ~12 Å wide. Below the tyrosine, the pore is relatively wide open (Fig. 2f), consistent with MCU’s high conductance. Near the matrix side, TM1 and TM2 of the same subunit make fewer direct contacts. Perhaps lipids fill in to seal the bottom of the channel, in line with weak extra density around this location.
Structure of the soluble domain
Within the mitochondrial matrix resides MCU’s soluble domain, comprised of an NTD, a coiled coil, and a variable non-conserved C terminus. This domain is involved in MCU assembly, channel activity regulation, and post-translational modification14,25,34. We determined the crystal structure of the soluble domain of MaMCU at 3.1 Å resolution (Extended Data Fig. 3c), providing further support of its quaternary organization.
Interestingly, the globular NTD of MaMCU has the same structural fold as that of human MCU (RMSD = 1.6 Å) despite no significant sequence similarity (Extended Data Fig. 3d). Within the crystal lattice, the soluble domain forms a dimer-of-dimer configuration (Extended Data Fig. 2c), matching well with the corresponding part of the whole MCU structure. Notably, a dimer interface of NTDs in MaMCU is the same as an interface of human NTD found in multiple crystal forms14,35 (Extended Data Fig. 3e). These observations support a conserved architecture from fungi to humans.
Single-particle EM analysis of MCU
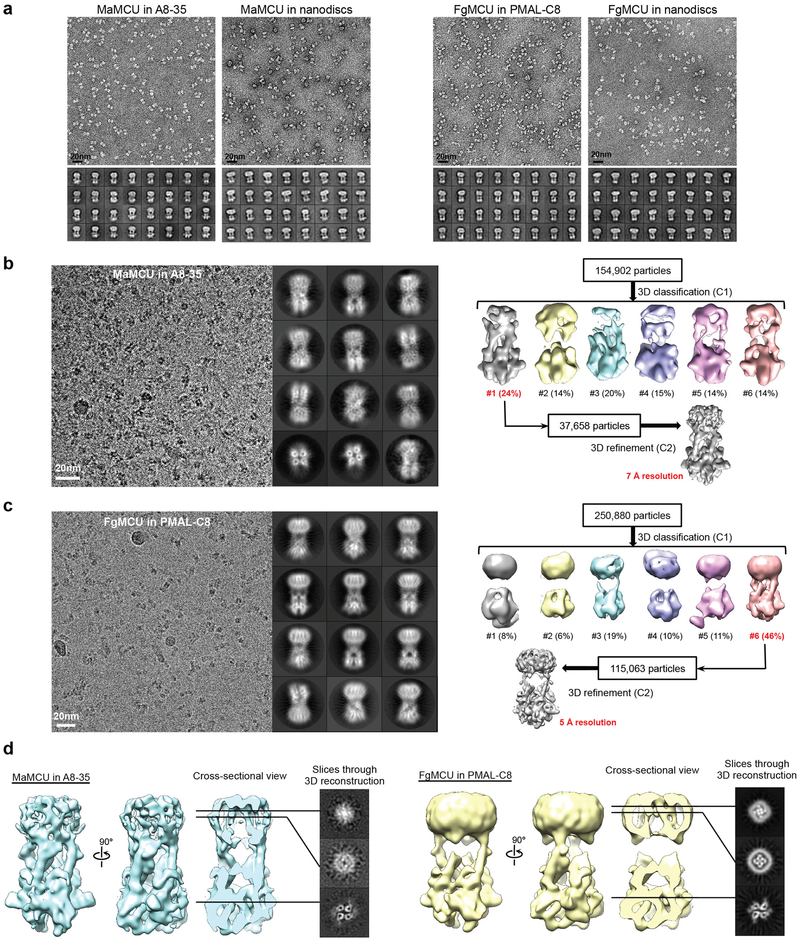
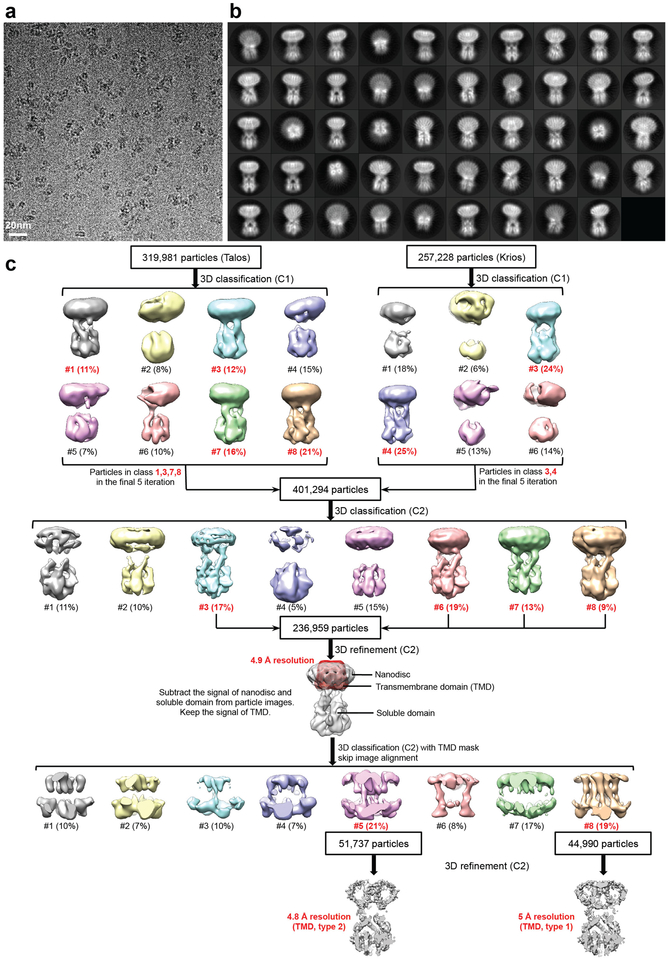
We used negative-stain EM to screen FgMCU and MaMCU exchanged into amphipols (A8–35 and PMAL-C8) or reconstituted into lipid nanodiscs. The negatively stained MCU proteins were monodisperse and showed two elongated densities extending parallel from the membrane region (Extended Data Fig. 4a). Cryo-EM analysis was carried out on MaMCU in A8–35, FgMCU in PMAL-C8, and FgMCU in nanodiscs (Extended Data Figs 4 and 5). The two-dimensional (2D) averages showed the soluble domains organized with an approximate two-fold symmetry. Following three-dimensional (3D) classification without symmetry (Extended Data Figs 4 and 5), the 3D reconstructions consistently showed a dimer-of-dimer structure. 3D refinement with two-fold symmetry generated final maps at 5–7 Å resolutions (Extended Data Table 2). The overall architectures of all three MCU complexes were essentially identical.
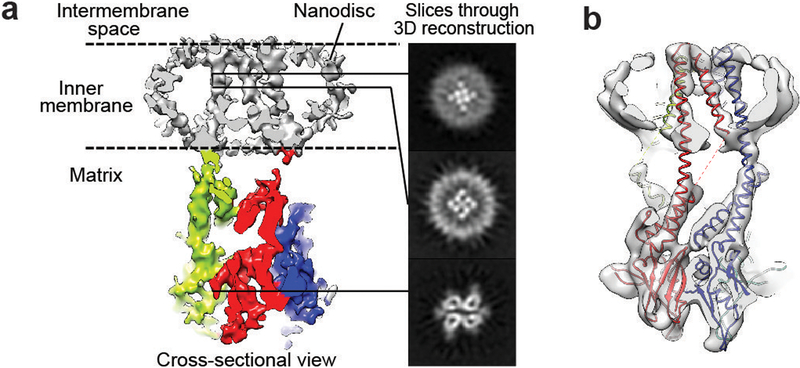
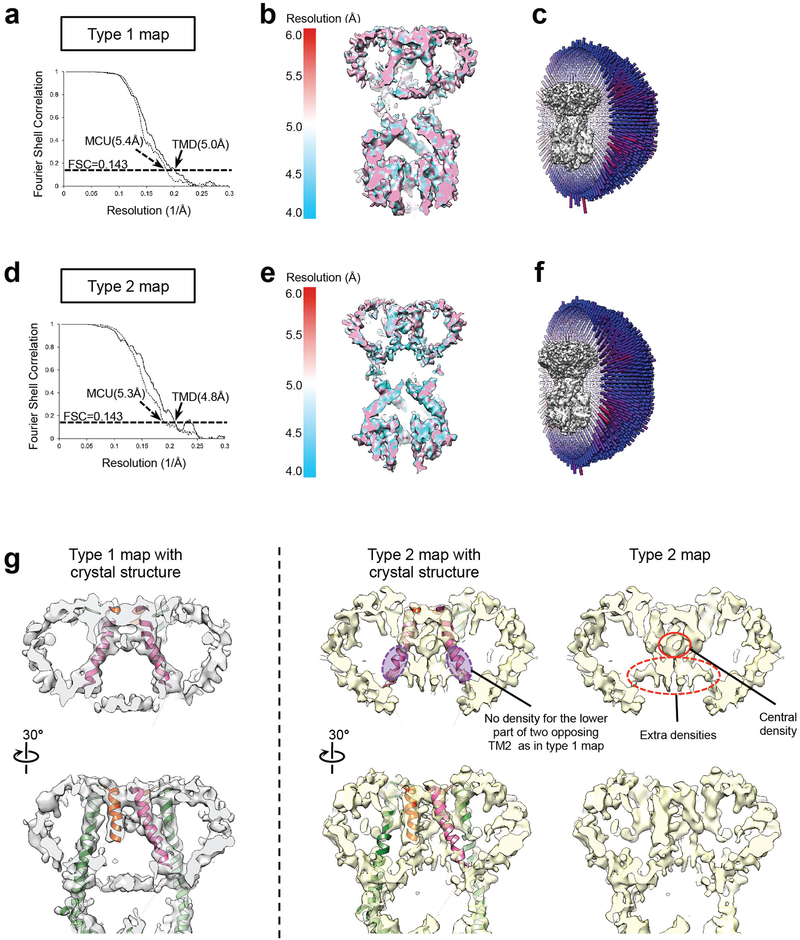
In the best cryo-EM 3D reconstructions using FgMCU in nanodiscs (Extended Data Fig. 5), all eight TM helices were well resolved and arranged with a near four-fold symmetry (Fig. 3a). The resolution was likely limited by the mobile TM helices and flexible connection between the soluble and TM domains. Focused 3D classification revealed different structures (Extended Data Fig. 5c). One major class represented the conformation in the averaged cryo-EM map (conformation type 1; 19% of particles); another generated a 3D reconstruction showing less complete TM helices but strong central densities, presumably contributed by hydrated ions or small molecules (conformation type 2; 21% of particles). These two classes were refined to 5 Å and 4.8 Å resolution, respectively, for the TM domain (Extended Data Fig. 6). The type 1 conformation superimposes well onto the structure model of MaMCU (Fig. 3b and Extended Data Fig. 6g). In the type 2 conformation, the lower halves of two opposing inner TM helices appear to bend towards the center (Extended Data Fig. 6g), possibly representing a more closed conformation.
Figure 3 |. Cryo-EM structure of FgMCU in nanodiscs.
a, Slice-view of the FgMCU 3D reconstruction (type 1 conformation) filtered to 5 Å resolution. Nanodisc and TM helices (grey) and soluble domains (red, green, cyan, and blue) are shown. Slice views are shown at indicated levels. b, Overlay of FgMCU cryo-EM map with MaMCU structure model. Protomers are shown in red, blue, green, and yellow. Data collection and map calculation were not repeated.
Stoichiometry and symmetry mismatch of MCU
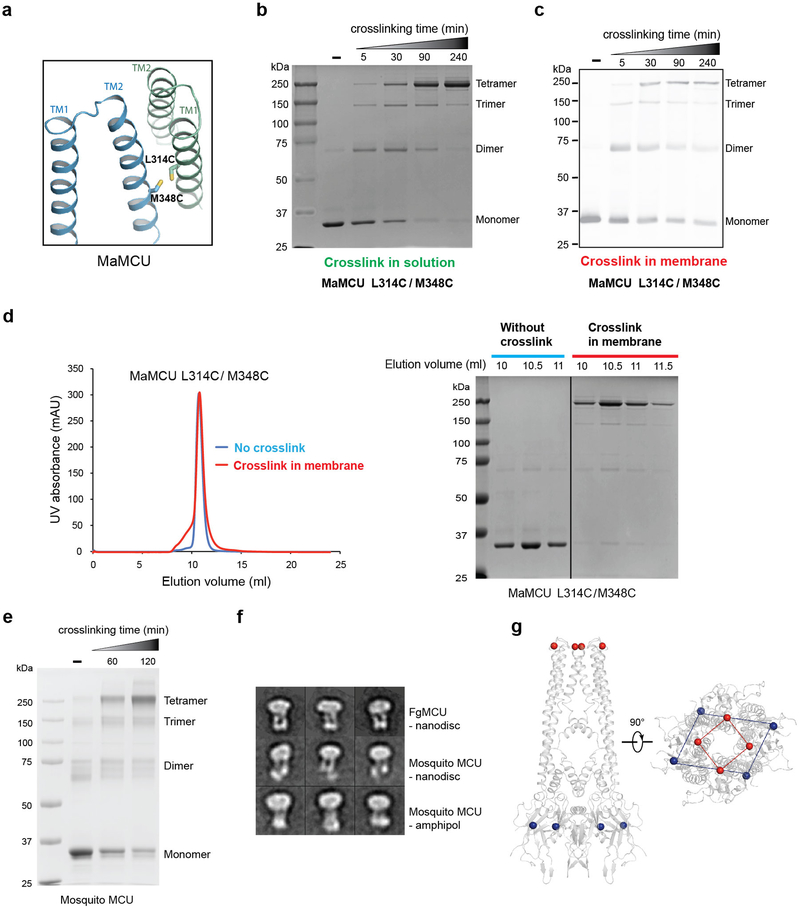
To test whether our observed tetrameric organization represents the quaternary structure of MCU in the membrane, we performed site-directed disulfide bridge crosslinking. Based on the structure, a pair of cysteines were introduced at the protomer interface of the TM domain on a cysteine-free background (Extended Data Fig. 7a). In either detergent micelle or the isolated membrane, crosslinking under oxidizing conditions gave rise to a newly formed product with the expected size of a tetramer in a time-dependent manner (Extended Data Fig. 7b, c). Furthermore, MaMCU crosslinked in membrane migrated the same as untreated protein on size-exclusion chromatography (Extended Data Fig. 7d). To evaluate whether the architecture of MCU is conserved in metazoan MCU, we made equivalent double cysteine mutations in MCU from mosquito, which possesses EMRE and MICU in the genome. Under oxidation conditions, the main cross-linked product migrated to the same tetramer position as that of MaMCU on SDS-PAGE (Extended Data Fig. 7e). Comparison of 2D averages of negatively stained mosquito MCU with those of FgMCU indicated a similar overall architecture (Extended Data Fig. 7f).
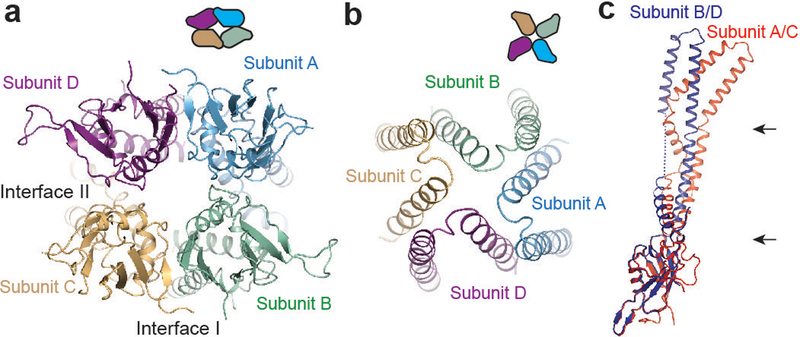
Overall, MCU is organized as a dimer of dimers. The soluble domain shows two-fold symmetry with each NTD directly contacting two neighboring subunits through distinct interfaces (Fig. 4a). In contrast, the TM domain shows approximately four-fold rotational symmetry (Fig. 4b). This symmetry mismatch is evident from the slice views of the cryo-EM map (Fig. 3a) and is illustrated by markers on each domain in the crystal structure (Extended Data Fig. 7g). Superimposing subunits A/C with neighboring subunits B/D revealed how the symmetry mismatch might be reconciled (Fig. 4c). First, the coiled-coil domain swings approximately 8° around its end near the NTD. This movement propagates through a long distance to the top of the TM domain (~85 Å away), resulting in large displacement of the TM domain. Second, the junction between the TM and the coiled coil is flexible and accommodates a ~20° bend right after the end of the coiled coil, moving the TM domain farther away. As a result, subunits A/C adopt a significantly different conformation from subunits B/D even though each individual domain superimposes well. Both ends of the coiled coil likely function as joints, providing flexibility for different relative orientations.
Figure 4 |. Symmetry mismatch in domain organization.
a, Matrix-side view of MaMCU NTD. Domain organization is depicted using schematic drawings. b, Cellular-side view of MaMCU TM domain. c, Structural comparison of subunits (superimposed through the NTD). Arrows indicate potential hinge regions.
Functional significance of residues in the TM domain
To validate the structural model and assess the functional role of residues in the TM domain, we performed a systematic alanine scan. Consistent with the structural observations, single point mutations that significantly impaired uptake activity were mostly concentrated on the pore-facing side of TM2, with a helical periodic distribution pattern (Fig. 5a, b). The strictly conserved Trp332, Pro337, and Glu336 that are critical for proper configuration of the selectivity filter were indispensable for uptake. Substitution of Tyr340, which sits directly below the filter, significantly impaired uptake and proper protein folding, indicating an important structural role while complicating specific functional interpretation. The residue on TM1 that showed the most pronounced effect on uptake activity was Trp317, whose side chain constitutes a primary contact point between TM1 and TM2. Mutating Phe326 or Gly331 of the TM1-TM2 linker also impaired Ca2+ uptake, probably due to their effect on the linker conformation and thus the configuration of the pore entrance.
Figure 5 |. Functional validation of TM domain.
a, E. coli-based Ca2+ uptake activities of MaMCU with individual alanine (or leucine for alanine/glycine) point mutations in TM domain in the presence of 50 μM Ca2+ (mean ± s.e.m., n = 5 independent experiments except for mutants on residue 321–335, n=4 independent experiments). b, Function-impairing residues. TM helices (grey) and residues whose substitution substantially affected Ca2+ uptake (below arbitrary 0.4 cut off; yellow sticks) are shown.
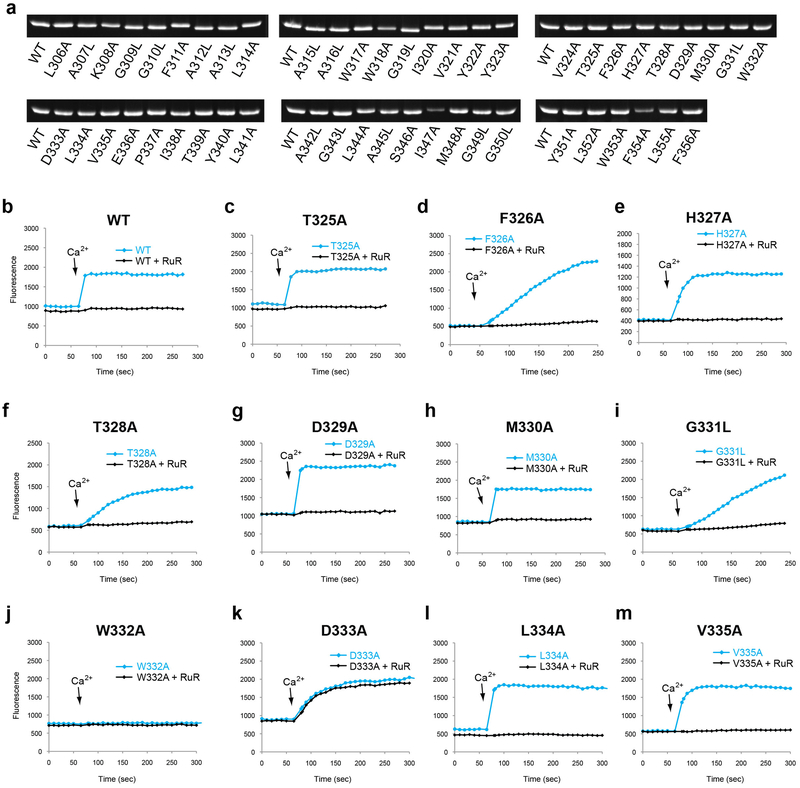
We examined the effect of the mutations on MCU’s sensitivity to ruthenium red by testing residues near the intermembrane surface. D333A substitution had the most significant effect and markedly reduced sensitivity to ruthenium red (Extended Data Fig. 8), consistent with an equivalent mutation of the human MCU36. Ser259 of the human MCU, another residue involved in ruthenium red sensitivity, is not conserved in MaMCU or FgMCU10,11. Perhaps positively charged ruthenium red interacts with negatively charged Asp333 near the entrance of the pore and blocks the channel, competing with the Ca2+-binding site. This would explain why ruthenium red inhibited inward but not outward current of MCU6. Together, our mutagenesis studies are fully compatible with the structure, providing insights into MCU function.
Discussion
Our X-ray and EM structures together with membrane cross-linking and functional experiments revealed a conserved dimer-of-dimer architecture of MCU with physiological relevance. The marked difference between our MCU and the cMCU structures might be related to the approaches utilized, as the cMCU sample preparation involved the relatively harsh detergent Fos-Choline-14 and inclusion bodies, and the oligomerization state of cMCU was inferred from an 18-Å resolution negative stain EM reconstruction28.
The channel domain of MCU represents a new architecture of ion channels. Compared with voltage-gated ion channels (VGICs), MCU has a roughly inverted shape resembling a truncated pyramid. Moreover, the selectivity filter of MCU is formed by side chains on TM2 versus a reentry loop lining the pore for VGICs37–44. Nonetheless, MCU, Ca2+-conducting VGICs, and the hexameric Orai Ca2+ channel share a common theme: a carboxylate ring at the entrance of the selectivity filter likely provides negative charge to effectively coordinate Ca2+. This convergent configuration indicates a fundamental requirement for Ca2+ channels achieved by different means. Compared to Orai, the pore of MCU is mostly hydrophilic and wider open, which may contribute to its relatively high conductance.
MCU has high selectivity with a high affinity binding site to Ca2+ in the pore6, which is essential for its physiological function given the relatively low cytosolic Ca2+ concentration. We propose that the high selectivity of Ca2+ is achieved by high affinity binding through direct coordination by the carboxylate oxygen of the Glu336 side chains. The conserved interaction network among Trp332, Glu336, and Pro337 stabilizes closely spaced carboxylate groups of the Glu336 ring, which might contribute to the high affinity binding of Ca2+. Asp333 and Glu336 of MCU showed an interesting parallel with the engineered CavAb Ca2+ channel, in which two adjacent rings of negatively charged residues also line the mouth of the pore and are important for Ca2+ selectivity45. We observed only one strong Ca2+ binding site in the crystal structure. It remains to be investigated whether Asp333 is also involved in coordinating a secondary Ca2+ for a potential knock-off mechanism45.
Post-translational modifications or divalent cation binding to the NTD can modulate Ca2+ conduction by MCU14,25,34. In this regard, it is notable that the symmetry mismatch between the TM and the soluble NTD domain bears similarity to that of ionotropic glutamate receptors (iGluRs)40. During the gating cycle of iGluRs, the ligand-binding domain undergoes significant re-organization and transitions between a two-fold and four-fold symmetry46. By analogy, a similar reorganization in the NTD could modulate MCU channel activity by switching subunits A/C or B/D between alternate conformations, thereby altering packing or conformation of the TM helices. In the crystal structure of MaMCU, immediately below the selectivity filter, Tyr340 interacts with residues on the neighboring subunit, orienting its side chain along the pore. Interestingly, the cryo-EM map of FgMCU shows density in the pore that could potentially result from one pair of Tyr340 side chains pointing into the pore. Although higher resolution is needed for a definitive assignment, an intriguing possibility is that altered TM packing may weaken Tyr340’s interactions with nearby TMs to facilitate a rotamer switch of one pair of tyrosines to control Ca2+ flow through the pore. Alternatively, the rearrangement of NTDs could potentially lead to bending of TM helices to constrict the pore, as suggested by two possible conformations in the cryo-EM map.
In summary, our structures and biochemical studies establish the stoichiometry and architecture of MCU and provide important insights into Ca2+ coordination and permeation. In the future, structures at higher resolutions, in various states, and in complex with regulatory components will be needed for a detailed mechanistic understanding of Ca2+ selectivity and channel gating.
METHODS
Expression and purification
The coding sequence of Metarhizium acridum MCU without mitochondrial signal peptide (residues 62–484) was codon optimized and cloned into a modified pNGFP-BC plasmid with an N-terminal His-tag, GFPuv, and a 3C protease cleavage site. Based on limited proteolysis and secondary structure prediction, the unstructured N- and C- termini and a disordered loop at the NTD were removed. A construct lacking residues 62–98, 190–205, and 427–484 yielded weakly diffracting crystals. To promote better crystal growth, Clostridium pasteurianum rubredoxin was fused into a loop between S213 and G214 at the NTD, and two point mutations (H327W and M330F) were introduced. This construct, named MaMCU-Rub, was fully functional and produced improved crystals. To prepare MaMCU soluble domain, the N- terminal and C-terminal parts of the protein were directly fused together by deleting the TM domain (Δ295–386). A disordered long loop in the NTD (residues 193–222) was further truncated. The final construct was named MaMCUsd and cloned into pNGFP-BC. Similarly, the coding sequence of Fusarium graminearum MCU was codon optimized and cloned into pNGFP-BC. The mitochondrial signal peptide and disordered N- and C-termini were truncated (Δ1–120 and Δ448–480). Two disordered and non-conserved loops (residues 148–159 and 215–241) within the NTD were also removed.
To prepare MaMCU protein sample, the transformed E. coli BL21 (DE3) cells were grown at 37°C until the OD600 reached 0.8–1.0 and the temperature was lowered to 20°C. Overexpression was induced by 0.2 mM isopropyl β-D-thiogalactoside and the cells were harvested 18 hours post induction. Cells were lysed by sonication in a buffer containing 50 mM Tris, pH 8.0, 150 mM NaCl, 2 mM CaCl2, and protease inhibitor cocktail. Membrane proteins were extracted by incubating the lysate or the isolated membrane with 2% n-dodecyl-β-D-maltoside (DDM, Anatrace) at 4°C for 2 hours. After removal of the insoluble fractions, the supernatant was incubated with prewashed cobalt resin at 4°C for 2 hours. After washing the resin with five column volumes (CV) of buffer A containing 20 mM Tris, pH 8.0, 150 mM NaCl, 2 mM CaCl2, and 0.05% DDM supplemented with 10 mM imidazole and 10 CV of buffer A supplemented with 20 mM imidazole, the resin was washed with buffer A and then incubated with 3C protease overnight to cleave the tag. MaMCU was further purified by gel filtration (Superdex 200 increase, GE healthcare) in buffer containing 20 mM Tris, pH 8.0, 150 mM NaCl, 2 mM CaCl2, and 0.03% DDM. The peak fraction was collected and concentrated to 10–15 mg/ml for further use.
MaMCU-Rub was purified similarly with a few modifications. The cell pellets were suspended in lysis buffer containing 50 mM Tris, pH 8.0, 150 mM NaCl, 10 mM MgCl2, and protease inhibitor cocktail. After sonication, membrane proteins were extracted by 2% n-decyl-β-D-maltoside (Anatrace) at 4°C for 2 hours. The insoluble fractions were removed by centrifugation and the supernatant was incubated with prewashed cobalt resin at 4°C for 2 hours. The protein was purified by affinity chromatography using cobalt resin, released from the resin by 3C protease, and further purified by gel filtration (Superdex 200 increase, GE Healthcare) in buffer containing 10 mM HEPES, pH 7.5, 150 mM NaCl, 10 mM MgCl2, and 0.1% n-undecyl-β-D-maltoside (Anatrace). The peak fraction was collected and concentrated to 10 mg/ml for crystallization. Expression of selenomethionine-labeled MaMCU-Rub protein was achieved by following a published protocol47. The protein was purified in the same manner as the unlabeled protein. To produce mercury-labeled MaMCU-Rub protein, cysteine point mutations were introduced by two-step PCR48, and the protein was incubated with 2.5 mM thimerosal at room temperature for 2 hours before further purification by gel filtration.
The soluble matrix domain of MaMCU, MaMCUsd, was expressed and purified following the same protocol as described above, except that surface reductive methylation was performed after elution from the affinity column49 and the gel filtration buffer did not contain any detergent. The peak fraction was collected and concentrated to 10 mg/ml for crystallization trials.
FgMCU proteins were purified following the same protocol above for MaMCU. The final gel filtration buffer contained 20 mM Tris, pH 8.0, 150 mM NaCl, 2 mM CaCl2, and 0.03% DDM.
Nanobody selection and purification
Nanobodies were obtained from screening immunized and synthetic libraries following published protocols50,51. Phage display libraries that contain about 108 transformants were used to screen specific binders to MCUs. After four rounds of selection, specific binders against MCUs were clearly enriched. The enriched clones were transferred into a yeast display system and further screened against MaMCU for three additional rounds following published protocols52. Nanobodies that specifically recognize MaMCU were cloned into expression vector pMES4 with His tag. Five nanobodies were expressed in E. coli BL21 (DE3) and purified according to the standard procedure using cobalt resin.
Crystallization
Crystallization trials were performed using the hanging-drop vapor-diffusion method at 20°C. MaMCU-Rub protein was mixed at a 1:0.8 ratio with reservoir solution containing 100 mM HEPES, 7.5, 0.1 M MgCl2, and 14% PEG 2000 MME. The crystals grew to full size in one to two weeks. Crystals were incubated in a cryoprotectant solution with the addition of 20% glycerol, and were flash-frozen in liquid nitrogen. MaMCU in complex with nanobody was prepared by mixing both components at a 1:1 ratio. The crystals were grown by vapor-diffusion in the presence of 15% PEG 2050, 200 mM (NH4)2SO4, and 100 mM Na-cacodylate, pH 6.0. The crystals grew to full size in about one week. The crystals were cryo-protected by the addition of 20% glycerol and flash frozen in liquid nitrogen. The MaMCUsd crystals were grown using the same method as described above. Plate-like crystals were grown in 0.1 M glycine, pH 9.3, 15.5% PEG 4000, and 0.6 M NaNO3. The crystals were cryo-protected by adding 24% ethylene glycol into the crystallization buffer, and were then flash-frozen in liquid nitrogen.
Data collection and structural determination
The diffraction data were collected at beamlines 24ID-C/E, 23ID-B/D and 17ID of the Advanced Photon Source, 5.0.2 of the Advanced Light Source, and 12–2 of the Stanford Synchrotron Radiation Lightsource. Native data set for MaMCU-Rub, and MaMCUsd was collected based on a single crystal and native data set for MaMCU was merged from three crystals. The diffraction data were processed using XDS53 or HKL200054. The selenomethionine anomalous data were merged from multiple crystals. The data were integrated using XDS53 as implemented in RAPD (https://github.com/RAPD/RAPD). The mercury anomalous data were collected on multiple crystals or multiple spots on the same crystals and were processed by XDS53 or HKL200054. The initial phase for MaMCUsd was obtained using a 10 Å EM map as a search model using Phaser55, and the phase was gradually extended through NCS averaging to a 3.1 Å resolution by RESOLVE through Phenix56. The map was of sufficient quality to trace secondary structures. The initial model was built using AutoBuild in Phenix. The model was manually rebuilt in Coot57 and refined by Phenix56 in an iterative manner. The initial single wavelength anomalous dispersion (SAD) phasing for MaMCU-Rub (crystal form I) was obtained from either selenomethionine anomalous data or mercury anomalous data using SHELX C/D/E in HKL2Map58. In addition, a MR-SAD protocol was carried out for the selenomethionine anomalous data and mercury anomalous data based on a molecular replacement (MR) solution with the soluble domain model (MaMCUsd) as the search model. SAD and MR-SAD maps allowed tracing and registering the soluble domain with the aid of the MaMCUsd model. For the TM domain, initially ideal poly-alanine helices were manually placed into the SAD and MR-SAD maps, guided by the EM map. To assist assignment of the helix register, we made single cysteine mutants for each residue on the TM helices. The accessibility of cysteine for the mercury labeling was assessed by 5,5’-Dithiobis(2-nitrobenzoic acid) on the purified protein. For each mutant, the MR solution was obtained by Phaser55. The Hg sites were identified by Phaser EP in Phenix56 and confirmed by anomalous difference maps. The register of the TM helices were aided by 12 Hg markers on two TM helices, one Hg marker on the linker connecting TM1 and TM2, as well as a selenomethione marker on TM2. For MaMCU in complex with the nanobody (crystal form II), the combined and scaled data from 3 crystals was anisotropically truncated using UCLA Diffraction Anisotropy Server. The data (3.9 Å × 3.1 Å × 3.3 Å along a*, b*, and c* axes, respectively) was used for refinement. The molecular replacement solution was found using MaMCU-Rub as a search model by Phaser55. The model was iteratively refined and rebuilt in Phenix56, Buster59 and Coot57. This final model was used for all structural interpretation on MaMCU. Structural quality was reported by MolProbity60 and structural renderings were prepared using PyMOL (Schrödinger, LLC). Ion-conducting pore radius was calculated by HOLE61.
Cryo-EM sample preparation
To reconstitute the MCU in amphipol, purified proteins after gel filtration were mixed with amphipol A8–35 (Anatrace) or PMAL-C8 (Anatrace) at a mass ratio of 1:3 for 3 hours on ice. To prepare the MCU in nanodiscs, purified proteins were mixed with an equal molar ratio of the scaffold protein MSP1D1 in the presence of an 8 mM lipid mixture that contained 3:1 2-oleoyl-1-palmitoyl-sn-glycero-3-phosphocholine (POPC, Avanti) and cardiolipin (Avanti) for 2 hours on ice. The protein samples with amphipol and nanodiscs were incubated with Bio-beads at 4°C overnight to remove detergents and were further purified by gel filtration in a buffer containing 150 mM NaCl, 10 mM Tris, pH 8.0, and 2 mM CaCl2. The peak fraction was collected for EM analysis.
Cell-based uptake assay
The MCU and a membrane-tethering calcium sensor Lck-GCaMP2 (refs 30,62) were co-expressed using a pETDuet1 vector. The transformed E. coli strain BL21(DE3) was induced as described above. A 3 ml cell culture was centrifuged and washed twice with 3 ml UAB buffer (100 mM KCl, 50 mM Tris, pH 7.5, 1 mM MgCl2), and then diluted to an OD600 of 1.0 for an uptake assay. A large negative membrane potential across the E. coli plasma membrane63 drives Ca2+ uptake. The assays were carried out using Greiner black polystyrene flat-bottom 96-well plates (Sigma-Aldrich). For each assay reaction, 50 μM or 0.5 mM calcium was added into 100 μl cells and immediately mixed to initiate the uptake. For ruthenium red inhibition experiments, 0.5–2 μM ruthenium red (Sigma-Aldrich) was mixed with cells before uptake assays. All experiments were performed at room temperature and repeated at least four times. Data were recorded on an infinite M1000Pro plate reader and processed using Tecan i-contro software. Fluorescent signals were measured every 5–10 seconds with the excitation set at 485 nm and emission at 510 nm. Ca2+ uptake activity is quantified as a linear fit of the fluorescence signal during the first 20 seconds after the addition of calcium. To evaluate the expression level of the MCU mutants, MCU mutant constructs were cloned into pNGFP-BC. Proteins were expressed in 3 ml LB culture under the identical condition as for the functional assay. Solubilized proteins were analyzed by SDS-PAGE and MCU-GFP fusion protein was visualized by in gel fluorescence using a Bio-Rad imaging system with excitation at 302 nm and emission at 440 nm.
Liposome-based flux assay
Liposome was reconstituted according to a published protocol64. Purified MCU proteins were mixed with E. coli polar lipids (Avanti) at a 1:80 ratio in the presence of reconstitution buffer (150 mM NaCl, 10 mM HEPES, pH 7.5, 5 mM EDTA) plus 0.12% (w/v) Triton-X100. Detergents were removed by overnight incubation with Bio-beads. After extrusion through a 0.4 μm membrane, proteoliposome was pelleted by ultracentrifugation at 100,000 g for 1 hour. The proteoliposome was washed twice with ice-cold FAB buffer that contained 150 mM N-methyl-D-glucamine (NMDG), 10 mM HEPES, pH 7.5, 5 mM EDTA and 2 μM 9-amino-6-chloro-2-methoxyacridine (ACMA), and then resuspended in the same buffer to a final lipid concentration of 100 mg/ml. The flux assay was performed following published protocols31,65,66 in a 96-well format. A total of 2 μl of proteoliposomes were diluted into 100 μl of FAB. After 150 seconds, 1 μM carbonyl cyanide m-chlorophenyl hydrazone (CCCP, Sigma-Aldrich) was added to initiate Na+ flux. A total of 20 nM sodium ionophore monensin (Sigma-Aldrich) was added near the end of the experiments to release Na+ from the liposomes. For Gd3+ blockage experiments, 0.3 mM GdCl3 was added to the FAB buffer before flux assays. Data collected on an infinite M1000Pro plate reader were processed using Tecan i-contro software. Fluorescent signals were measured every 15 seconds (excitation: 410 nm and emission: 490 nm).
Cysteine crosslinking
Double cysteine substitutions were introduced in a cysteine-free version of MaMCU by two-step PCR48. The mutants were expressed in the same manner as the WT protein. For crosslinking in detergent solution, 1 mg/ml purified protein in DDM buffer (20 mM Tris, pH 8.0, 150 mM NaCl, 2 mM CaCl2, 0.03% DDM) was incubated with 0.1 mM of Cu(II) (1,10-phenantroline)3 at 4°C. For crosslinking in membrane, the membrane fraction containing overexpressed His-tagged protein was prepared and incubated with 0.3 mM of Cu(II) (1,10-phenantroline)3 at 4°C. The reactions were stopped at different time points by the addition of EDTA to a final concentration of 50 mM, and the reaction products were analyzed by SDS-PAGE. For Western blot analysis, the proteins were transferred from a gel to a PVDF membrane and probed with mouse anti-penta-His antibody (Qiagen), followed by detection with donkey anti-mouse IR680 secondary antibody (LI-COR Biosciences). Blots were visualized and analyzed using a LI-COR Odyssey system. Double cysteine substitutions of mosquito MCU was expressed and purified in DDM with 0.01% cholesteryl hemisuccinate similarly to MaMCU. The crosslinking was performed in DDM buffer with 0.01% cholesteryl hemisuccinate in a similar manner to MaMCU.
Electron microscopy data acquisition
Negatively stained specimens were prepared following an established protocol with minor modifications67. Specifically, 2.5 μl of purified MCU was applied to glow-discharged copper EM grids covered with a thin layer of continuous carbon film, and the grids were stained with 2.5% (w/v) uranyl formate. These grids were imaged on a Tecnai T12 electron microscope (FEI) operated at 120 kV at a nominal magnification of 67,000x using a 4k × 4k CCD camera (UltraScan 4000, Gatan), corresponding to a calibrated pixel size of 1.68 Å on the specimen level. For cryo-EM of FgMCU in PMAL-C8 and nanodiscs, 4 μl of a 5 mg/mL sample containing 0.3 mM fluorinated Fos-Choline-8 (Anatrace) was applied to a glow-discharged Quantifoil holey carbon grid (1.2/1.3, 400 mesh), and blotted for 3 seconds with ~92% humidity before plunge-freezing in liquid ethane using a Cryoplunge 3 System (CP3, Gatan). For cryo-EM of MaMCU in A8–35, a 2.5 μl sample at a concentration of 2 mg/ml applied to a grid was similarly blotted and plunge-frozen using a CP3. The cryo-EM data were recorded on a 300 kV Polara electron microscope (FEI) at Harvard Medical School, and a 200 kV Talos Arctica and a 300 kV Titan Krios electron microscope (FEI) at the University of Massachusetts Medical School. All cryo-EM movies were recorded with a K2 Summit direct electron detector (Gatan) in super-resolution counting mode using UCSFImage468 or SerialEM69. The details of the EM data collection parameters are listed in Extended Data Table 1.
EM image processing
The EM data were processed as previously described70. Negative-stain EM images were binned over 2 × 2 pixels for further processing, yielding a pixel size of 3.36 Å. Dose-fractionated super-resolution movies collected using the K2 Summit direct electron detector were binned over 2 × 2 pixels, and then subjected to motion correction using the program MotionCor271. A sum of all frames of each image stack was calculated following a dose-weighting scheme, and used for all image-processing steps except for defocus determination. The program CTFFIND472 was used to calculate defocus values of the summed images from all movie frames without dose weighting. Particle picking was performed using a semi-automated procedure with SAMUEL and SamViewer73. 2D classification of selected particle images was carried out by SPIDER (samclasscas.py) or by RELION74,75. Initial 3D models were generated with 2D class averages by SPIDER 3D projection matching refinement (samrefine.py), starting from a cylindrical density mimicking the size and shape of the MCU. 3D classification and refinement were carried out using “relion_refine_mpi” in RELION. The masked 3D classification focusing on the TM domain of FgMCU in nanodiscs with residual signal subtraction was performed following a previously described procedure76. The first round of 3D classification of all cryo-EM data sets was carried out without symmetry, which was followed by further 3D classification and refinement with two-fold symmetry. All refinements followed the gold-standard procedure, in which two half data sets were refined independently. The overall resolutions were estimated based on the gold-standard criterion of Fourier shell correlation (FSC) = 0.143. Local resolution variations were estimated from two half data maps using ResMap77. The amplitude information of the final maps were corrected by applying a negative B-factor using the program bfactor.exe78. To compare the crystal structure with the cryo-EM maps, the atomic model was fitted into the cryo-EM maps as a rigid body using the function of “Fit in Map” in UCSF Chimera79.
Extended Data
Extended Data Figure 1 |. Sequence alignment, sample preparations and functional characterizations.
a, Sequence alignment of MCU. The protein sequences of MCUs from Fusarium graminearum (FgMCU), Metarhizium acridum (MaMCU), Homo sapiens (HsMCU) and Caenorhabditis elegans (CeMCU) were aligned using Clustal Omega with manual adjustment. The domain organization is shown above the sequences. b, FgMCU in DDM on size-exclusion chromatography. c, MaMCU in DDM on size-exclusion chromatography. Data in b-c are representative of five independent experiments with similar results. d, Ca2+ uptake activity of FgMCU in E. coli. Fluorescence changes upon addition of 0.5 mM Ca2+ are shown for WT (red), D351A/E354A (green), control (black), and with ruthenium red (blue). e, Cation flux activity of FgMCU in reconstituted liposomes. Fluorescence changes are shown for FgMCU (red) and with Gd3+ (blue). Data in d-e are representative of three independent experiments with similar results.
Extended Data Figure 2 |. Crystal packing and molecule interactions in the crystal.
a, The crystal lattice structure of MaMCU-Rub. One MaMCU channel is colored in blue and its associated rubredoxin is colored in cyan. In the crystal, the TM domain lacks clear protein-mediated contacts. Presumably, relatively disordered protein regions or detergent micelles mediate the contact. b, The crystal lattice structure of MaMCU in complex with nanobody. One MCU is shown in blue and the bound nanobodies are shown in cyan. c, The crystal lattice structure of MaMCU soluble domain, shown in ribbons. Each chain is colored differently. Two helices that formed a coiled coil were derived from two different chains, in a domain-swapped manner. d, A close-up view of the interaction between nanobody and McMCU in the crystal. Nanobody binds near the end of TM1 and is distant from the selectivity filter (shown as colored sticks). Nanobody is colored in grey and MaMCU is colored in cyan. e, Mercury and selenium sites identified by MR-SAD. Two protomers of MaMCU in one asymmetric unit are shown as ribbons in green and blue, respectively. The mercury sites identified from “marker mutants” are shown as red spheres; one selenium site from the labeled WT protein is shown in the same manner. F, 2Fo–Fc electron density map of MaMCU (cyan mesh, 1σ) with the structure model shown in ribbon. g, Close-up view of 2Fo–Fc electron density map of individual TM (cyan mesh, 1.5σ) with side chains shown in sticks.
Extended Data Figure 3 |. Comparison of the NMR structure of cMCU with the crystal structure of MaMCU, and the structure of soluble domain of MaMCU.
a, The pentameric NMR structure of cMCU is shown on the left. The dimer-of-dimer structure of MaMCU is shown on the right. A box outlines the equivalent region including the TM domain and coiled coil. b, Comparison of a subunit of cMCU by NMR with that of MaMCU by crystallography. The helical part of the pore-lining TM2 was superimposed. The rest of the protein shows markedly different structure. The zoomed-in view of the selectivity filter region is shown in the box on the right. The most conserved WDxxEP residues (shown as sticks) are organized in a different manner in these two structures. c, Ribbon representation of the soluble domain of MaMCU. Each subunit is colored in blue, green, gold, and cyan, with the portion before or after the TM domain of each subunit in a slightly different color. d, Structural comparison of the NTDs of MaMCU (purple) and the human MCU (cyan). Two structures have the same fold and superimpose well onto each other. e, A pair of human MCU NTDs (cyan and blue) superimposes well onto one of dimers formed by MaMCU NTDs (purple and pink).
Extended Data Figure 4 |. Negative-stain EM and cryo-EM of MaMCU and FgMCU.
a, Representative negative-stain EM image and 2D averages of MaMCU in A8–35 (from 28 micrographs with similar results), MaMCU in nanodiscs (from 28 micrographs with similar results), FgMCU in PMAL-C8 (from 20 micrographs with similar results), and FgMCU in nanodiscs (from 40 micrographs with similar results). The box dimension of the 2D averages is 215 Å. b, Representative cryo-EM image (from 1,862 micrographs with similar results), 2D averages, and image processing workflow of MaMCU in A8–35. The box dimension of the 2D averages is 172 Å. c, Representative cryo-EM image (from 4,055 micrographs with similar results), 2D averages, and image processing workflow of FgMCU in PMAL-C8. The box dimension of the 2D averages is 176 Å. d, Different views of the cryo-EM maps of MaMCU in A8–35 and FgMCU in PMAL-C8, both low-pass filtered to 7 Å. 2D averages and map calculation were not repeated.
Extended Data Figure 5 |. Single-particle cryo-EM analysis of FgMCU in nanodiscs.
a, Representative cryo-EM image (from 5332 micrographs with similar results). b, 2D averages of cryo-EM particle images. The box dimension is 187 Å. c, Image processing workflow. Two cryo-EM data sets were first independently subjected to 3D classification without symmetry, and the particle images in good classes were combined and further processed with two-fold symmetry, generating a 4.9 Å-resolution cryo-EM map. Subsequently, a final round of 3D classification focused on the TM domain sorted out two major classes, which generated two final maps at 5.0 and 4.8 Å resolutions for the TM domain. The conformations in these two maps are designated as type 1 and type 2. 2D averages and map calculations were not repeated.
Extended Data Figure 6 |. Cryo-EM maps of two conformations of FgMCU in nanodiscs.
a, Gold-standard FSC curves of the type 1 final cryo-EM map, calculated with a soft mask to include only the TM domain (TMD, solid line) or the entire MCU molecule without nanodisc (dashed line). The estimated resolutions based on an FSC = 0.143 criterion are indicated. b, Cross-sectional view of the type 1 final cryo-EM map filtered to 5.0 Å resolution and colored according to local resolution. c, Angular distribution of the particle images used for calculating the type 1 final cryo-EM map. (d-f) Same as A-C, but for the type 2 conformation. g, Two cross-sectional views of the TM domains of the type 1 and type 2 cryo-EM maps, superimposed with an MaMCU-based homology model of FgMCU. The missing density and extra densities in type 2 map are indicated. Map calculations in a and d were not repeated.
Extended Data Figure 7 |. Tetrameric assembly of MaMCU, overall architecture of a metazoan MCU and symmetry mismatch of MaMCU.
a, The design of cysteine pair mutations for crosslinking TM subunits. L314 on TM1 and M348 on TM2 were mutated to cysteines (side chains shown as sticks). b, Site-directed disulfide cross-linking of MaMCU in detergent solution. L314 on TM1 and M348 on TM2 were mutated to create a cysteine pair at the protomer interface on an otherwise cysteine-free background. The double cysteine mutant was purified and oxidized by copper phenanthroline (CuP) for various time durations. The cross-link product was analyzed by SDS-PAGE. c, Site-directed disulfide cross-linking of MaMCU in the membrane. Isolated membrane from the MaMCU L314C/M348C mutant was treated with CuP for an increasing amount of time. The cross-linking product was analyzed by Western blot using an antibody against the His tag on the protein. d, The size-exclusion profile of MaMCU with or without crosslinking. MaMCU L314C/M348C mutant treated or untreated with CuP in the membrane was purified and analyzed by size-exclusion chromatography. The peak fractions were subjected to SDS-PAGE and visualized by Coomassie blue staining. e, Site-directed disulfide cross-linking of mosquito MCU in detergent solution. A pair of residues (T294 on TM1 and V341 on TM2) that were equivalent to those used in MaMCU crosslinking at the protomer interface were mutated to cysteine. The purified double cysteine mutant was oxidized by CuP and analyzed by SDS-PAGE. The tetramer position on the SDS-PAGE gel is the same as that of MaMCU in panel b. F, 2D averages of negatively stained FgMCU in nanodiscs, mosquito MCU (T294C/V341C) in nanodiscs, and mosquito MCU (T294C/V341C) in amphipol A8–35. 2D averages were not repeated. g, Geometry of markers in TM domain and NTD of MaMCU. Site-specific mercury marker on TM domain (red sphere) and Cα position of Ile115 in NTD (blue sphere) are indicated. Data in b-e are representative of three independent experiments with similar results. For gel source data, see Supplementary Fig. 1.
Extended Data Figure 8 |. Expression levels of MaMCU mutants and ruthenium red sensitivity of selected mutants.
a, The expression level of WT MaMCU and those with a point mutation in the TM domain. Green fluorescent protein-tagged protein was analyzed on SDS-PAGE and the protein was visualized by in-gel fluorescence. The experiments were repeated twice independently with similar results. For gel source data, see Supplementary Fig. 1. (b-m) The effect of substituting residues near the intermembrane surface of MaMCU on its ruthenium red sensitivity. Ca2+ uptake activity of the WT or mutant MaMCU was assayed in an E. coli-based assay (0.5 mM Ca2+, 1 μM RuR). The Ca2+ uptake in the absence (blue) or in the presence (black) of ruthenium red is reflected by the fluorescence change. The experiments were repeated three times independently with similar results.
Extended Data Table 1.
Statistics of X-ray data collection and refinement.
| MaMCU | MaMCU soluble domain |
MaMCU-Rub | MaMCU Ca2+ |
|
|---|---|---|---|---|
| Data collection | ||||
| Space group | C2221 | C2 | P21212 | C2 |
| Cell dimensions | ||||
| a, b, c (Å) | 88.0, 290.4, 126.1 | 261.8, 119.9, 88.0 | 85.8, 109.9, 170.1 | 140.5, 263.81, 124.9 |
| α, β, γ(°) | 90.00, 90.00, 90.00 | 90.00, 106.88, 90.00 | 90.00, 90.00, 90.00 | 90.00, 124.08, 90.00 |
| Resolution (Å)* | 43.88–3.05 (3.16–3.05)# | 50.00–3.10 (3.17–3.10) | 50.00–3.23 (3.41–3.23) | 106.7–3.6 (3.80–3.60) |
| Wavelength (Å) | 1.00000 | 1.00000 | 1.00000 | 1.4938 |
| Rmerge (%)* | 26.5 (>100) | 8.9 (>100) | 32.8 (>100) | 19.3 (>100) |
| || σ|* | 11.1 (1.2) | 14.1 (1.0) | 4.7 (1.2) | 14.7 (1.9) |
| Completeness (%)* | 99.9 (99.9) | 100.0 (100.0) | 99.7 (99.8) | 98.6 (97.7) |
| Redundancy* | 13.1 (13.0) | 3.4 (3.6) | 12.4 (13.8) | 20.5 (18.7) |
| Refinement | ||||
| Resolution (Å) | 45.0 – 3.10 | 41.75 – 3.10 | ||
| Unique reflections | 23,520 | 47,294 | ||
| Rwork ∕ Rfree (%) | 25.5/30.1 | 26.1/30.6 | ||
| No. atoms | ||||
| Protein | 5746 | 9966 | ||
| Ligand/ion | 1 | N.A. | ||
| B-factors | ||||
| Protein | 75.71 | 99.07 | ||
| Ligand/ion | 32.96 | N.A. | ||
| R.m.s deviations | ||||
| Bond lengths (Å) | 0.002 | 0.003 | ||
| Bond angles (°) | 0.54 | 0.70 |
Footnotes:
High-resolution shell is shown in parentheses.
Reflections after anisotropic correction (3.9, 3.1, 3.3 Å, respectively along a*, b*, and c* reciprocal cell directions) were used in the refinement.
Extended Data Table 2.
Cryo-EM data collection statistics.
| FgMCU nanodisc-overall (EMDB-7800) | FgMCU Nanodisc - type 1 (EMDB-7801) | FgMCU Nanodisc - type 2 (EMDB-7802) | FgMCU amphipol PMAL-C8 (EMDB-7803) | MaMCU amphipol A8–35 (EMDB-7804) | |
|---|---|---|---|---|---|
| Data collection and processing | |||||
| Microscope | Talos/Krios | Talos/Krios | Talos/Krios | Polara | Polara |
| Magnification | 36,000/130,000 | 36,000/130,000 | 36,000/130,000 | 39,000 | 31000 |
| Voltage (kV) | 200/300 | 200/300 | 200/300 | 300 | 300 |
| Electron exposure (e-/Å2) | 72/46 | 72/46 | 72/46 | 74 | 46 |
| Defocus range (μm) | 0.5–2.5 | 0.5–2.5 | 0.5–2.5 | 1.5–3.0 | 1.0–3.0 |
| Pixel size (Å) | 1.169/1.09 | 1.169/1.09 | 1.169/1.09 | 0.98 | 1.23 |
| Symmetry imposed | C2 | C2 | C2 | C2 | C2 |
| Number of collected movies | 2,459/2,873 | 2,459/2,873 | 2,459/2,873 | 4,055 | 1,862 |
| Initial particle images (no.) | 577,209 | 577,209 | 577,209 | 250,880 | 154,902 |
| Final particle images (no.) | 236,959 | 44,990 | 51,737 | 115,063 | 37,658 |
| Map resolution (Å) (TMD) | 4.9 | 5.4 (5.0) | 5.3(4.8) | 5.0 | 7.0 |
| FSC threshold | 0.143 | 0.143 | 0.143 | 0.143 | 0.143 |
Supplementary Material
Acknowledgements.
We thank the staff at Beamline 24ID-C/E, 23ID-B/D, and 17ID (APS, Argonne National Laboratory), 12–2 (SSRL, SLAC National Laboratory), and 5.0.2 (Advanced Light Source). We thank Z. Li at HMS and C. Xu and K. Song at UMass cryo-EM facility for help in EM data collection. This work was made possible by support from Stanford University, the Klingenstein-Simons Fellowship, and the Harold and Leila Y. Mathers Charitable Foundation to L.F., and from a National Science Foundation Graduate Research Fellowship to N.M.F. NE-CAT is supported by NIH P41 GM103403 and S10 RR029205. We thank A. Manglik for discussions and R. Lewis for suggestions and comments.
Footnotes
Data availability
The crystallographic coordinates and structural factors are deposited into the Protein Data Bank with accession numbers 6C5W and 6C5R. The three-dimensional cryo-EM density maps of MaMCU in A8–35, FgMCU in PMAL-C8 and FgMCU in nanodiscs (overall, type 1 and type 2 conformations) have been deposited into the Electron Microscopy Data Bank under accession numbers EMDB-7800, EMDB-7801, EMDB-7802, EMDB-7803 and EMDB-7804.
Author Information. Reprints and permissions information are available at www.nature.com/reprints. Authors declare no competing financial interests. Correspondence and requests for materials should be addressed to L.F. (liangf@stanford.edu) or M.L. (maofu_liao@hms.harvard.edu).
REFERENCES
- 1.Gunter TE & Pfeiffer DR Mechanisms by which mitochondria transport calcium. Am. J. Physiol 258, C755–786 (1990). [DOI] [PubMed] [Google Scholar]
- 2.Rizzuto R, De Stefani D, Raffaello A & Mammucari C Mitochondria as sensors and regulators of calcium signalling. Nat. Rev. Mol. Cell Biol. 13, 566–578 (2012). [DOI] [PubMed] [Google Scholar]
- 3.Szabadkai G & Duchen MR Mitochondria: the hub of cellular Ca2+ signaling. Physiology 23, 84–94 (2008). [DOI] [PubMed] [Google Scholar]
- 4.Deluca HF & Engstrom GW Calcium uptake by rat kidney mitochondria. Proc. Natl. Acad. Sci. USA 47, 1744–1750 (1961). [DOI] [PMC free article] [PubMed] [Google Scholar]
- 5.Vasington FD & Murphy JV Ca ion uptake by rat kidney mitochondria and its dependence on respiration and phosphorylation. J. Biol. Chem 237, 2670–2677 (1962). [PubMed] [Google Scholar]
- 6.Kirichok Y, Krapivinsky G & Clapham DE The mitochondrial calcium uniporter is a highly selective ion channel. Nature 427, 360–364 (2004). [DOI] [PubMed] [Google Scholar]
- 7.De Stefani D, Rizzuto R & Pozzan T Enjoy the trip: calcium in mitochondria back and forth. Annu. Rev. Biochem 85, 161–192 (2016). [DOI] [PubMed] [Google Scholar]
- 8.Rizzuto R, Brini M, Murgia M & Pozzan T Microdomains with high Ca2+ close to IP3-sensitive channels that are sensed by neighboring mitochondria. Science 262, 744–747 (1993). [DOI] [PubMed] [Google Scholar]
- 9.Giacomello M et al. Ca2+ hot spots on the mitochondrial surface are generated by Ca2+ mobilization from stores, but not by activation of store-operated Ca2+ channels. Mol. Cell 38, 280–290 (2010). [DOI] [PubMed] [Google Scholar]
- 10.Baughman JM et al. Integrative genomics identifies MCU as an essential component of the mitochondrial calcium uniporter. Nature 476, 341–345 (2011). [DOI] [PMC free article] [PubMed] [Google Scholar]
- 11.De Stefani D, Raffaello A, Teardo E, Szabo I & Rizzuto R A forty-kilodalton protein of the inner membrane is the mitochondrial calcium uniporter. Nature 476, 336–340 (2011). [DOI] [PMC free article] [PubMed] [Google Scholar]
- 12.Chaudhuri D, Sancak Y, Mootha VK & Clapham DE MCU encodes the pore conducting mitochondrial calcium currents. Elife 2, e00704 (2013). [DOI] [PMC free article] [PubMed] [Google Scholar]
- 13.Kovacs-Bogdan E et al. Reconstitution of the mitochondrial calcium uniporter in yeast. Proc. Natl. Acad. Sci. USA 111, 8985–8990 (2014). [DOI] [PMC free article] [PubMed] [Google Scholar]
- 14.Lee SK et al. Structural insights into mitochondrial calcium uniporter regulation by divalent cations. Cell Chem. Biol 23, 1157–1169 (2016). [DOI] [PMC free article] [PubMed] [Google Scholar]
- 15.Csordas G et al. MICU1 controls both the threshold and cooperative activation of the mitochondrial Ca2+ uniporter. Cell Metab. 17, 976–987 (2013). [DOI] [PMC free article] [PubMed] [Google Scholar]
- 16.Mallilankaraman K et al. MCUR1 is an essential component of mitochondrial Ca2+ uptake that regulates cellular metabolism. Nat. Cell Biol. 14, 1336–1343 (2012). [DOI] [PMC free article] [PubMed] [Google Scholar]
- 17.Kamer KJ, Grabarek Z & Mootha VK High-affinity cooperative Ca2+ binding by MICU1-MICU2 serves as an on-off switch for the uniporter. EMBO Rep. 18, 1397–1411 (2017). [DOI] [PMC free article] [PubMed] [Google Scholar]
- 18.Perocchi F et al. MICU1 encodes a mitochondrial EF hand protein required for Ca2+ uptake. Nature 467, 291–296 (2010). [DOI] [PMC free article] [PubMed] [Google Scholar]
- 19.Liu JC et al. MICU1 serves as a molecular gatekeeper to prevent in vivo mitochondrial calcium overload. Cell Rep. 16, 1561–1573 (2016). [DOI] [PMC free article] [PubMed] [Google Scholar]
- 20.Patron M et al. MICU1 and MICU2 finely tune the mitochondrial Ca2+ uniporter by exerting opposite effects on MCU activity. Mol. Cell 53, 726–737 (2014). [DOI] [PMC free article] [PubMed] [Google Scholar]
- 21.Sancak Y et al. EMRE Is an essential component of the mitochondrial calcium uniporter complex. Science 342, 1379–1382 (2013). [DOI] [PMC free article] [PubMed] [Google Scholar]
- 22.Tsai MF et al. Dual functions of a small regulatory subunit in the mitochondrial calcium uniporter complex. Elife 5, e15545 (2016). [DOI] [PMC free article] [PubMed] [Google Scholar]
- 23.Raffaello A et al. The mitochondrial calcium uniporter is a multimer that can include a dominant-negative pore-forming subunit. EMBO J. 32, 2362–2376 (2013). [DOI] [PMC free article] [PubMed] [Google Scholar]
- 24.Chaudhuri D, Artiga DJ, Abiria SA & Clapham DE Mitochondrial calcium uniporter regulator 1 (MCUR1) regulates the calcium threshold for the mitochondrial permeability transition. Proc. Natl. Acad. Sci. USA 113, E1872–E1880 (2016). [DOI] [PMC free article] [PubMed] [Google Scholar]
- 25.Tomar D et al. MCUR1 Is a scaffold factor for the MCU complex function and promotes mitochondrial bioenergetics. Cell Rep. 15, 1673–1685 (2016). [DOI] [PMC free article] [PubMed] [Google Scholar]
- 26.Bick AG, Calvo SE & Mootha VK Evolutionary diversity of the mitochondrial calcium uniporter. Science 336, 886–886 (2012). [DOI] [PMC free article] [PubMed] [Google Scholar]
- 27.Mammucari C, Gherardi G & Rizzuto R Structure, activity regulation, and role of the mitochondrial calcium uniporter in health and disease. Front. Oncol 7, 139 (2017). [DOI] [PMC free article] [PubMed] [Google Scholar]
- 28.Oxenoid K et al. Architecture of the mitochondrial calcium uniporter. Nature 533, 269–273 (2016). [DOI] [PMC free article] [PubMed] [Google Scholar]
- 29.Song JX, Liu X, Zhai PF, Huang JJ & Lu L A putative mitochondrial calcium uniporter in A. fumigatus contributes to mitochondrial Ca2+ homeostasis and stress responses. Fungal Genet. Biol 94, 15–22 (2016). [DOI] [PubMed] [Google Scholar]
- 30.Shigetomi E, Kracun S, Sofroniew MV & Khakh BS A genetically targeted optical sensor to monitor calcium signals in astrocyte processes. Nat. Neurosci 13, 759–766 (2010). [DOI] [PMC free article] [PubMed] [Google Scholar]
- 31.Hou XW, Pedi L, Diver MM & Long SB Crystal structure of the calcium release-activated calcium channel Orai. Science 338, 1308–1313 (2012). [DOI] [PMC free article] [PubMed] [Google Scholar]
- 32.Yang W, Lee HW, Hellinga H & Yang JJ Structural analysis, identification, and design of calcium-binding sites in proteins. Proteins 47, 344–356 (2002). [DOI] [PubMed] [Google Scholar]
- 33.Saotome K, Singh AK, Yelshanskaya MV & Sobolevsky AI Crystal structure of the epithelial calcium channel TRPV6. Nature 534, 506–511 (2016). [DOI] [PMC free article] [PubMed] [Google Scholar]
- 34.Dong ZW et al. Mitochondrial Ca2+ uniporter is a mitochondrial luminal redox sensor that augments MCU channel activity. Mol. Cell 65, 1014–1028 (2017). [DOI] [PMC free article] [PubMed] [Google Scholar]
- 35.Lee Y et al. Structure and function of the N-terminal domain of the human mitochondrial calcium uniporter. EMBO Rep. 16, 1318–1333 (2015). [DOI] [PMC free article] [PubMed] [Google Scholar]
- 36.Arduino DM et al. Systematic identification of MCU modulators by orthogonal interspecies chemical screening. Mol. Cell 67, 711–723 (2017). [DOI] [PMC free article] [PubMed] [Google Scholar]
- 37.Liao MF, Cao EH, Julius D & Cheng YF Structure of the TRPV1 ion channel determined by electron cryo-microscopy. Nature 504, 107–112 (2013). [DOI] [PMC free article] [PubMed] [Google Scholar]
- 38.Doyle DA et al. The structure of the potassium channel: molecular basis of K+ conduction and selectivity. Science 280, 69–77 (1998). [DOI] [PubMed] [Google Scholar]
- 39.Yan Z et al. Structure of the rabbit ryanodine receptor RyR1 at near-atomic resolution. Nature 517, 50–55 (2015). [DOI] [PMC free article] [PubMed] [Google Scholar]
- 40.Sobolevsky AI, Rosconi MP & Gouaux E X-ray structure, symmetry and mechanism of an AMPA-subtype glutamate receptor. Nature 462, 745–756 (2009). [DOI] [PMC free article] [PubMed] [Google Scholar]
- 41.Fan G et al. Gating machinery of InsP3R channels revealed by electron cryomicroscopy. Nature 527, 336–341 (2015). [DOI] [PMC free article] [PubMed] [Google Scholar]
- 42.Zalk R et al. Structure of a mammalian ryanodine receptor. Nature 517, 44–49 (2015). [DOI] [PMC free article] [PubMed] [Google Scholar]
- 43.Efremov RG, Leitner A, Aebersold R & Raunser S Architecture and conformational switch mechanism of the ryanodine receptor. Nature 517, 39–43 (2015). [DOI] [PubMed] [Google Scholar]
- 44.Wu J et al. Structure of the voltage-gated calcium channel Cav1.1 at 3.6 Å resolution. Nature 537, 191–196 (2016). [DOI] [PubMed] [Google Scholar]
- 45.Tang L et al. Structural basis for Ca2+ selectivity of a voltage-gated calcium channel. Nature 505, 56–61 (2014). [DOI] [PMC free article] [PubMed] [Google Scholar]
- 46.Zhu S & Gouaux E Structure and symmetry inform gating principles of ionotropic glutamate receptors. Neuropharmacology 112, 11–15 (2017). [DOI] [PMC free article] [PubMed] [Google Scholar]
- 47.Doublie S Preparation of selenomethionyl proteins for phase determination. Methods Enzymol. 276, 523–530 (1997). [PubMed] [Google Scholar]
- 48.Ho SN, Hunt HD, Horton RM, Pullen JK & Pease LR Site-directed mutagenesis by overlap extension using the polymerase chain reaction. Gene 77, 51–59 (1989). [DOI] [PubMed] [Google Scholar]
- 49.Walter TS et al. Lysine methylation as a routine rescue strategy for protein crystallization. Structure 14, 1617–1622 (2006). [DOI] [PMC free article] [PubMed] [Google Scholar]
- 50.Pardon E et al. A general protocol for the generation of Nanobodies for structural biology. Nat. Protoc 9, 674–693 (2014). [DOI] [PMC free article] [PubMed] [Google Scholar]
- 51.McMahon C et al. Yeast surface display platform for rapid discovery of conformationally selective nanobodies. Nat. Struct. Mol. Biol 25, 289–296 (2018). [DOI] [PMC free article] [PubMed] [Google Scholar]
- 52.Chao G et al. Isolating and engineering human antibodies using yeast surface display. Nat. Protoc 1, 755–768 (2006). [DOI] [PubMed] [Google Scholar]
- 53.Kabsch W XDS. Acta Crystallogr. D Biol. Crystallogr 66, 125–132 (2010). [DOI] [PMC free article] [PubMed] [Google Scholar]
- 54.Otwinowski Z & Minor W Processing of X-ray diffraction data collected in oscillation mode. Methods Enzymol. 276, 307–326 (1997). [DOI] [PubMed] [Google Scholar]
- 55.McCoy AJ et al. Phaser crystallographic software. J. Appl. Crystallogr 40, 658–674 (2007). [DOI] [PMC free article] [PubMed] [Google Scholar]
- 56.Adams PD et al. PHENIX: a comprehensive Python-based system for macromolecular structure solution. Acta Crystallogr. D Biol. Crystallogr 66, 213–221 (2010). [DOI] [PMC free article] [PubMed] [Google Scholar]
- 57.Emsley P, Lohkamp B, Scott WG & Cowtan K Features and development of Coot. Acta Crystallogr. D Biol. Crystallogr 66, 486–501 (2010). [DOI] [PMC free article] [PubMed] [Google Scholar]
- 58.Pape T & Schneider TR HKL2MAP: a graphical user interface for macromolecular phasing with SHELX programs. J. Appl. Cryst 37, 843–844 (2004). [Google Scholar]
- 59.Bricogne G et al. BUSTER (Global Phasing Ltd, Cambridge, UK, 2017). [Google Scholar]
- 60.Chen VB et al. MolProbity: all-atom structure validation for macromolecular crystallography. Acta Crystallogr. D Biol. Crystallogr 66, 12–21 (2010). [DOI] [PMC free article] [PubMed] [Google Scholar]
- 61.Smart OS, Neduvelil JG, Wang X, Wallace BA & Sansom MS HOLE: a program for the analysis of the pore dimensions of ion channel structural models. Journal of molecular graphics 14, 354–360, 376 (1996). [DOI] [PubMed] [Google Scholar]
- 62.Tallini YN et al. Imaging cellular signals in the heart in vivo: Cardiac expression of the high-signal Ca2+ indicator GCaMP2. Proc. Natl. Acad. Sci. USA 103, 4753–4758 (2006). [DOI] [PMC free article] [PubMed] [Google Scholar]
- 63.Felle H, Porter JS, Slayman CL & Kaback HR Quantitative measurements of membrane potential in Escherichia coli. Biochemistry 19, 3585–3590 (1980). [DOI] [PubMed] [Google Scholar]
- 64.Veenhoff LM & Poolman B Substrate recognition at the cytoplasmic and extracellular binding site of the lactose transport protein of Streptococcus thermophilus. J. Biol. Chem 274, 33244–33250 (1999). [DOI] [PubMed] [Google Scholar]
- 65.Zhang J, Feng Y & Forgac M Proton conduction and bafilomycin binding by the V0 domain of the coated vesicle V-ATPase. J. Biol. Chem 269, 23518–23523 (1994). [PubMed] [Google Scholar]
- 66.Feng L, Campbell EB, Hsiung Y & MacKinnon R Structure of a eukaryotic CLC transporter defines an intermediate state in the transport cycle. Science 330, 635–641 (2010). [DOI] [PMC free article] [PubMed] [Google Scholar]
- 67.Booth DS, Avila-Sakar A & Cheng Y Visualizing proteins and macromolecular complexes by negative stain EM: from grid preparation to image acquisition. J. Vis. Exp, 10.3791/3227 (2011). [DOI] [PMC free article] [PubMed] [Google Scholar]
- 68.Li X, Zheng S, Agard DA & Cheng Y Asynchronous data acquisition and on-the-fly analysis of dose fractionated cryoEM images by UCSFImage. J. Struct. Biol 192, 174–178 (2015). [DOI] [PMC free article] [PubMed] [Google Scholar]
- 69.Mastronarde DN Automated electron microscope tomography using robust prediction of specimen movements. J. Struct. Biol 152, 36–51 (2005). [DOI] [PubMed] [Google Scholar]
- 70.Mi W et al. Structural basis of MsbA-mediated lipopolysaccharide transport. Nature 549, 233–237 (2017). [DOI] [PMC free article] [PubMed] [Google Scholar]
- 71.Zheng SQ et al. MotionCor2: anisotropic correction of beam-induced motion for improved cryo-electron microscopy. Nat. Methods 14, 331–332 (2017). [DOI] [PMC free article] [PubMed] [Google Scholar]
- 72.Rohou A & Grigorieff N CTFFIND4: Fast and accurate defocus estimation from electron micrographs. J. Struct. Biol 192, 216–221 (2015). [DOI] [PMC free article] [PubMed] [Google Scholar]
- 73.Ru H et al. Molecular mechanism of V(D)J recombination from synaptic RAG1-RAG2 complex structures. Cell 163, 1138–1152 (2015). [DOI] [PMC free article] [PubMed] [Google Scholar]
- 74.Scheres SH RELION: implementation of a Bayesian approach to cryo-EM structure determination. J. Struct. Biol 180, 519–530 (2012). [DOI] [PMC free article] [PubMed] [Google Scholar]
- 75.Scheres SH A Bayesian view on cryo-EM structure determination. J. Mol. Biol 415, 406–418 (2012). [DOI] [PMC free article] [PubMed] [Google Scholar]
- 76.Bai XC, Rajendra E, Yang G, Shi Y & Scheres SH Sampling the conformational space of the catalytic subunit of human γ-secretase. Elife 4, e11182 (2015). [DOI] [PMC free article] [PubMed] [Google Scholar]
- 77.Kucukelbir A, Sigworth FJ & Tagare HD Quantifying the local resolution of cryo-EM density maps. Nat. Methods 11, 63–65 (2014). [DOI] [PMC free article] [PubMed] [Google Scholar]
- 78.Lyumkis D, Brilot AF, Theobald DL & Grigorieff N Likelihood-based classification of cryo-EM images using FREALIGN. J. Struct. Biol 183, 377–388 (2013). [DOI] [PMC free article] [PubMed] [Google Scholar]
- 79.Pettersen EF et al. UCSF chimera–A visualization system for exploratory research and analysis. J. Comput. Chem 25, 1605–1612 (2004). [DOI] [PubMed] [Google Scholar]
Associated Data
This section collects any data citations, data availability statements, or supplementary materials included in this article.


