

Abstract
Objective:
Sphingolipids have a fundamental role in many cellular processes, and they have been implicated in insulin resistance and Diabetes Mellitus (DM) and its complications, including diabetic retinopathy (DR). Little is known about how bioactive sphingolipids relate to retinopathies in human DM. In this study, we analyzed the sphingolipid composition of type 2 diabetic (T2DM) and non-diabetic human vitreous samples.
Methods:
We conducted an observational study on post-mortem human vitreous samples from non-diabetic (Controls; n=4; age: 71.6 ± 11.0 yrs, mean ± SD) and type 2 diabetic (T2DM; n=9; age: 67.0 ± 9.2 yrs) donors to identify changes in sphingolipid composition. Samples were analyzed by a triple quadrupole mass spectrometer and individual sphingolipid species were identified and quantified using established protocols.
Results:
The total quantity (pmol/mg) of ceramide (Cer), lactosylceramide (Lac-Cer), and sphingomyelin (SM) were increased in type 2 diabetic vitreous samples. Among individual species, we found a general trend of increase in the longer chain species of ceramides, hexosylceramides (Hex-Cer), Lac-Cer, and SM.
Conclusions:
This study shows the presence of measurable levels of sphingolipids in human vitreous. The results indicate changes in sphingolipid composition in the vitreous due to type 2 diabetes, which could be connected to the disease pathologies of the retina, retinal vessels, vitreous and the surrounding tissues.
Keywords: Sphingolipids, Ceramide, Diabetes Mellitus, Vitreous, Diabetic Retinopathy
1. Introduction
Diabetes Mellitus (DM) is a chronic disease of epidemic proportions and is responsible for a multitude of debilitating complications including diabetic neuropathy and diabetic retinopathy (DR), which is a leading cause of blindness in adults 1. Not only is diabetes widespread, affecting one out of every 11 adults worldwide, it is also a disease of insidious onset. One out of 3 U.S. adults meet pre-diabetic criteria but 9 out of 10 pre-diabetics are unaware of their risk of progressing to full diabetic state 2. The extensive strain that DM and its related complications place on healthcare systems worldwide make the development of diagnostic tools, preventive measures, and management strategies a leading priority of medical research. The identification of new and reliable biomarkers associated with DM onset and progression could be of great utility in the development of such tools and is therefore a major focus of DM research. Sphingolipids are increasingly recognized as having major roles in the pathogenesis of complications arising from DM, such as diabetic retinopathy, and are a promising candidate for further research as potential biomarkers and targets of therapeutic treatment 3-9.
DM can be broken into three classifications: gestational, type 1, and type 2. Type 2 DM (T2DM) is the most common form of DM by far and is characterized by a systemic decrease in cellular insulin sensitivity, resulting in inhibition of cells’ ability to uptake glucose. The hyperglycemic conditions and disruption of metabolic pathways associated with T2DM are responsible for the initial development and exacerbation of conditions such as DR. However, reports suggest that consistent management of hyperglycemia, the defining characteristic of DM, is insufficient by itself to prevent the development of DR 4. Abnormalities in sphingolipid metabolism are now regarded to have a major role in complications associated with DM 3-10, though this has not yet been sufficiently explored to develop a full mechanistic understanding of their role in the development and progression of certain complications such as DR.
Diabetic retinopathy is a leading cause of vision loss and blindness and can be expected to develop within 20 years of DM onset 1. DR is characterized by changes to the retinal arteries and dysfunction of the blood-retinal barrier, leading to ischemia and degeneration of the retinal neurons. Proliferative diabetic retinopathy (PDR) is an advanced form of the disease in which chronic retinal ischemia leads to neovascularization, resulting in new blood vessel formation throughout the retina and into the vitreous. Left untreated, DR can result in vision deterioration and blindness through destruction/detachment of the retina and vitreous hemorrhage 11.
The human vitreous humor is a gelatinous mass which fills the space between the retina and the lens of the eye. It is held together by a network of collagen and hyaluronan and is relatively devoid of intrinsic metabolic activity 12. However, the vitreous directly contacts and serves as an interface between the retina, lens, and ciliary body. It is believed that a variety of compounds diffuse into the vitreous via these interfaces, especially the vitreous-retina interface. Indeed, proteomic analyses of the regional compositional differences between the different regions of the human vitreous suggest that surrounding tissue in contact with the vitreous influences the composition of different compounds in the vitreous tissue. The presence of proteins in the vitreous and compositional changes associated with ocular disease, especially DR and PDR, is supported in literature 11, 13-16. Though the presence of lipids in the human vitreous has been reported previously and changes to vitreous lipids have been documented in ocular disease states 17-19, to our knowledge no prior attempt has been made to specifically characterize vitreous sphingolipids between diabetic and non-diabetic humans. As it is evident that changes to vitreous and retinal protein and lipid composition are associated with DM and DR, we believe it is likely that changes in vitreous sphingolipids will be seen in diabetic human samples.
Advances in the understanding of sphingolipids in the context of processes such as cell migration, inflammation, and neovascularization have illuminated new avenues of research into their role in the pathology of diseases such as DM 20-25. Sphingolipid abnormalities have been implicated in the progression of DM and alterations in sphingolipid profiles have been characterized in diabetic retinas 5, 26-29. Major sphingolipid metabolites with alleged cell signaling roles include ceramide and related classes hexosylceramide (Hsx-Cer) and lactosylceramide (Lac-Cer), sphingosine (Sph), and sphingosine 1-phosphate (S1P) 30, which have been implicated in the pathophysiology of a number of diseases 31. The body of evidence supporting sphingolipid involvement in inflammation, cell proliferation, neovascularization, and metabolic disorders leads us to hypothesize that changes in sphingolipid composition will be observed between diabetic and non-diabetic human vitreous samples. Identifying a change in sphingolipid composition in the diabetic vitreous may offer evidence in support of the association between sphingolipid metabolism and T2DM pathogenesis, help elucidate sphingolipid-dependent pathological mechanisms, and identify additional areas of investigation regarding novel therapeutic targets.
2. Methods
2.1. Ethics
All experiments were conducted in accordance with the University of Oklahoma Health Science Center Institutional Review Board (IRB), and the study met the tenets of the Declaration of Helsinki. Vitreous samples were obtained from the National Development and Research Institute (NDRI) and the Oklahoma Lions Eye Bank.
2.2. Subjects and Sample Collection
In this observational study, post-mortem human eyes from either T2DM donors or donors with unremarkable ophthalmologic history were collected. Cadaver donors were selected based on prior T2DM diagnosis and donors with major prior ocular trauma or major ocular disease of non-diabetic etiology were excluded. For samples obtained from T2DM cadavers, the duration in years of known diabetic status was collected. Samples were collected from age-matched Controls (n = 4; age: 71.6 ± 11.0 years) and T2DM (n = 9; age: 67.0 ± 9.2 years) donors (Table 1).
Table 1. Post-mortem vitreous samples from non-diabetics and diagnosed type 2 diabetics (T2DM).
Human vitreous samples were obtained from the eyes of either non-diabetic (Control) or type 2 diabetic (T2DM) cadavers. Abbreviations: BPH: benign prostatic hyperplasia; CAD: coronary artery disease; CHF: congestive heart failure; CVA: cerebrovascular accident; DJD: degenerative joint disease; DM: diabetes mellitus; DR: diabetic retinopathy; GERD: gastroesophageal reflux disease; HTN: hypertension; IBS: irritable bowel syndrome; MRSA: methicillin-resistant staphylococcus aureus; PE: pulmonary embolism; PVD: peripheral vascular disease.
| Sample # |
Age (years) |
Sex | Diabetes Status |
Diabetes Type |
Duration (years) |
Additional Medical History |
|---|---|---|---|---|---|---|
| 1 | 61 | F | No | None | N/A | Metastatic Lung Cancer, HTN, IBS, GERD, Gastroparesis, DJD, Hyperlipidemia, Lymphocytic Colitis, Cholecystectomy, Hysterectomy, Tubal Ligation |
| 2 | 87 | M | No | None | N/A | PVD, Aortic Aneurysm, MRSA Infection, PE, Rheumatoid Arthritis |
| 3 | 73 | M | No | None | N/A | Cancer, Cerebral Palsy, Chronic Kidney Disease, CAD, Gout, Hyperlipidemia, HTN, PVD |
| 4 | 68 | M | No | None | N/A | COPD, HTN, CHF, MI, Valvular Heart Disease, Cataract Surgery, Welding burn to R eye |
| 5 | 76 | M | DM | Type 2 | Unknown | Renal Cancer, Renal Failure, HTN, PE, BPH, Gout, Partial Nephrectomy, Psoriasis, Sleep Apnea |
| 6 | 69 | F | DM | Type 2 | 14 | Bilateral Cataracts, Bilateral Background Diabetic Retinopathy, Bilateral Glaucoma suspected, CHF, HTN |
| 7 | 77 | M | DM | Type 2 | 20+ | CVA, Renal Failure on dialysis, Pneumonia (MRSA), CAD, A-fib |
| 8 | 73 | F | DM | Type 2 | Unknown | Bronchitis, Asthma, Hypercholesterolemia, Angina, CHF, Pneumonia, Hypothyroidism, Migraines, Spinal Stenosis, Limited Vision |
| 9 | 53 | M | DM | Type 2 | Unknown | Anemia, Cancer, Diabetic Retinopathy, Hypercholesterolemia, HTN, Obesity, PE, Renal Failure |
| 10 | 71 | M | DM | Type 2 | 11 | Diabetic Retinopathy, CHF, Thrombocytopenia, Chronic Renal Failure, Hyperlipidemia, CAD, Orthostatic HTN, Vasculopathy |
| 11 | 55 | M | DM | Type 2 | 45 | Dementia, Diabetic Retinopathy, GERD |
| 12 | 74 | F | DM | Type 2 | 7 | Diabetic Retinopathy, Osteoporosis, PVD, CVA, Chronic Kidney Disease, CAD, CHF, Depression, Diverticulitis |
| 13 | 60 | F | DM | Type 2 | 40 | Diabetic Retinopathy, Cancer, CVA, CHF, CAGB, CAD, HTN, MI |
2.3. Extraction and Analysis of Sphingolipids:
Human vitreous samples were collected from post-mortem eyes. The vitreous protein was quantified from 50 uL of vitreous using T-PER Tissue Protein Extraction Reagent (Thermo Fisher) and quantified by BCA assay ((Thermo Scientific, IL) as published earlier 32-34. We used 3.0 mg protein equivalent vitreous sample (100-300 uL) for sphingolipid extraction according to previously established protocols in the Lipidomics Core at Virginia Commonwealth University, Richmond, VA 33-38. Internal standards were purchased from Avanti Polar Lipids (Alabaster, AL). Internal standards were added to samples in 20 ul ethanol:methanol:water (7:2:1) as a cocktail of 500 pmol each. Standards for sphingoid bases and sphingoid base 1-phosphates were 17-carbon chain length analogs: C17-Sph, (2S,3R,4E)-2-aminoheptadec-4-ene-1,3-diol (d17:1-So); C17-sphinganine, (2S,3R)-2-aminoheptadecane-1,3-diol (d17:0-Sa); C17-S1P, heptadecasphing-4-enine-1-phosphate (d17:1-So1P); and C17-sphinganine 1-phosphate, heptadecasphinganine-1-phosphate (d17:0-Sa1P). Standards for N-acyl SPLs were C12-fatty acid analogs: C12-Cer, N-(dodecanoyl)-sphing-4-enine (d18:1/C12:0); C12-Cer 1-phosphate, N-(dodecanoyl)-sphing-4-enine-1-phosphate (d18:1/C12:0-Cer1P); C12-SM, N-(dodecanoyl)-sphing-4-enine-1-phosphocholine (d18:1/C12:0-SM); C12-lactoosylceramide, N-(dodecanoyl)-1-β-lactosy1-sphing-4-eine, and C12-glucosylceramide, N-(dodecanoyl)-l-β-glucosyl-sphing-4-eine. The MS grade solvents [chloroform (EM-CX1050) and methanol (EM-MX0475), as well as formic acid (ACS grade, EM-FX0440-7)] were obtained from VWR (West Chester, PA).
Samples were collected into 13 × 100 mm borosilicate tubes with a Teflon-lined cap (catalog number 60827-453; VWR). Then, 1 ml of CH3OH and 0.5 ml of CHCl3 were added along with the internal standard cocktail (500 pmol of each species dissolved in a final total volume of 20 μl of ethanol:methanol:water 7:2:1). The contents were dispersed using an ultra sonicator at room temperature for 30 s. This single-phase mixture was incubated at 48°C overnight. After cooling, 75 μl of 1 M KOH in CH3OH were added and after brief sonication, incubated in a shaking water bath for 2 h at 37°C to cleave potentially interfering glycerolipids. The extract was brought to neutral pH with 6 μl of glacial acetic acid, then the extract was centrifuged using a table-top centrifuge, and the supernatant was removed by a Pasteur pipette and transferred to a new tube. The extract was reduced to dryness using a SpeedVac. The dried residue was reconstituted in 0.5 ml of the starting mobile phase solvent for LC-MS/MS analysis, sonicated for ~15s, and then centrifuged for 5 min in a tabletop centrifuge before transfer of the clear supernatant to the autoinjector vial for analysis.
The sphingoid bases, sphingoid base 1-phosphates, and complex sphingolipids were separated by reverse phase LC using a Supelco 2.1 (internal diameter) × 50 mm Ascentis Express C18 column (Sigma-Aldrich) and a binary solvent system at a flow rate of 0.5 ml/min with a column oven set to 35°C. Prior to injection of the sample, the column was equilibrated for 0.5 min with a solvent mixture of 95% mobile phase A1 (CH3OH/H2O/HCOOH, 58/41/1, v/v/v, with 5 mM ammonium formate) and 5% mobile phase B1 (CH3OH/HCOOH, 99/1, v/v, with 5 mM ammonium formate), and after sample injection (typically 40 μl), the A1/B1 ratio was maintained at 95/5 for 2.25 min, followed by a linear gradient to 100% B1 over 1.5 min, which was held at 100% B1 for 5.5 min, followed by a 0.5 min gradient return to 95/5 A1/B1. The column was re-equilibrated with 95/5 A1/B1 for 0.5 min before the next run.
For MS/MS analyses, a Shimadzu Nexera LC-30 AD binary pump system coupled to a SIL-30AC autoinjector and DGU20A5R degasser coupled to a Sciex 5500 quadrupole/linear ion trap (QTrap) (SCIEX Framingham, MA) operating in a triple quadrupole mode was used. Q1 and Q3 were set to pass molecularly distinctive precursor and product ions (or a scan across multiple m/z in Q1 or Q3), using N2 to collisionally induce dissociations in Q2 (which was offset from Q1 by 30–120 eV); the ion source temperature was set to 500°C. These methods are described in detail in previous publication38. In brief, C12-Cer internal standards for complex species is utilized because the fragmentation is mainly dependent on a dehydration at the 3-position, cleavage of the headgroup from the 1-position, and cleavage of the N-acyl chain irrespective of the chain length. Slight adjustments in collision energy were required (approximately a 2.5 eV per C2:0 increase). These adjustments have been evaluated for linearity across the entire dynamic range for all the analytes (over 3 orders of magnitude). Similarly, sphingoid bases fragmented via double dehydration to a conjugated carbocation of m/z 264.4. The exception to this pattern is sphingomyelin (SM), which fragments via cleavage of the phosphocholine headgroup, thus retaining the charge on the resultant m/z 184.4 product ion. This requires reverse phase chromatography to separate isotopic SM species (i.e. d18:1/24:0 and d18:0/24:1). Also of note, typical reverse phase chromatography does not resolve glucosylceramide and galactosylceramide. These require a separate normal phase run for resolution. The species of Cer, Hex-Cer, Lac-Cer, SM, and sphingoid lipids, such as Sph, dihydro-Sph (Dh-Sph), S1P, and Dh-S1P, were identified based on their retention time and m/z ratio and quantified as described in previous publications 35-38. As published previously, a standard curve method of quantitation was used 38. Standard curves were made from serially diluted (0.5–1000 pmol) internal standards as described above. Standard curves were generated to calculate the linear regression lines and that were used for approximate absolute quantitation (in pmol) of all the sphingolipids 38. The detailed MS parameters and species identification chart is published previously 33, 34.
2.4. Data analysis and statistics:
Differences in individual sphingolipid species between diabetic and control samples were determined using ANOVA, followed by Sidak’s multiple comparisons test (GraphPad Prism 6.0 software). Differences in the mean abundance of sphingolipid classes between diabetic and control samples were evaluated using Student’s t-test assuming unequal variance due to small sample size necessitating non-parametric analysis. Statistical significance was defined as p<0.05.
3. Results:
3.1. Analysis of major sphingolipid classes:
Changes to vitreous sphingolipid composition between T2DM and non-diabetic control donors were assessed quantitatively. Relative levels of Cer were increased by 3% in T2DM samples, along with corresponding 1% and 2% decreases in Hex-Cer and SM, respectively (Figure 1). Quantification (pmol/mg protein) of various classes of sphingolipids showed significant increases in Cer (p<0.05), Lac-Cer (p<0.05), and SM (p<0.05) in T2DM samples (Figure 2A). Quantification of long chain sphingolipid bases and their phosphorylated forms showed a significant increase in dh-S1P in T2DM (p<0.05; Figure 2B). No significant changes were found in the levels of Hex-Cer, Sph, dh-Sph, and S1P (Figure 2).
Figure 1: Composition of major sphingolipids in human vitreous.
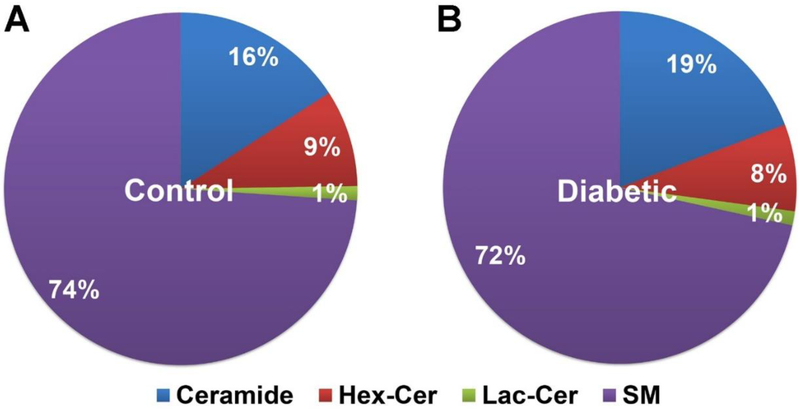
Human vitreous samples from type 2 diabetic (T2DM) and non-diabetic (Control) cadavers were processed to collect sphingolipids and analyzed using LC-MS/MS. Percentages are the relative quantity of each sphingolipid class with respect to other classes. Relative Ceramide (Cer) levels appeared to be elevated in T2DM samples while relative Hexosylceramide (Hex-Cer) and Sphingomyelin (SM) levels were slightly decreased. Control human vitreous obtained from non-diabetic cadavers; Diabetic (T2DM) human vitreous obtained from cadavers with documented type 2 diabetes mellitus (Control: n = 4; T2DM: n = 9).
Figure 2: Quantification of major sphingolipids in human vitreous.
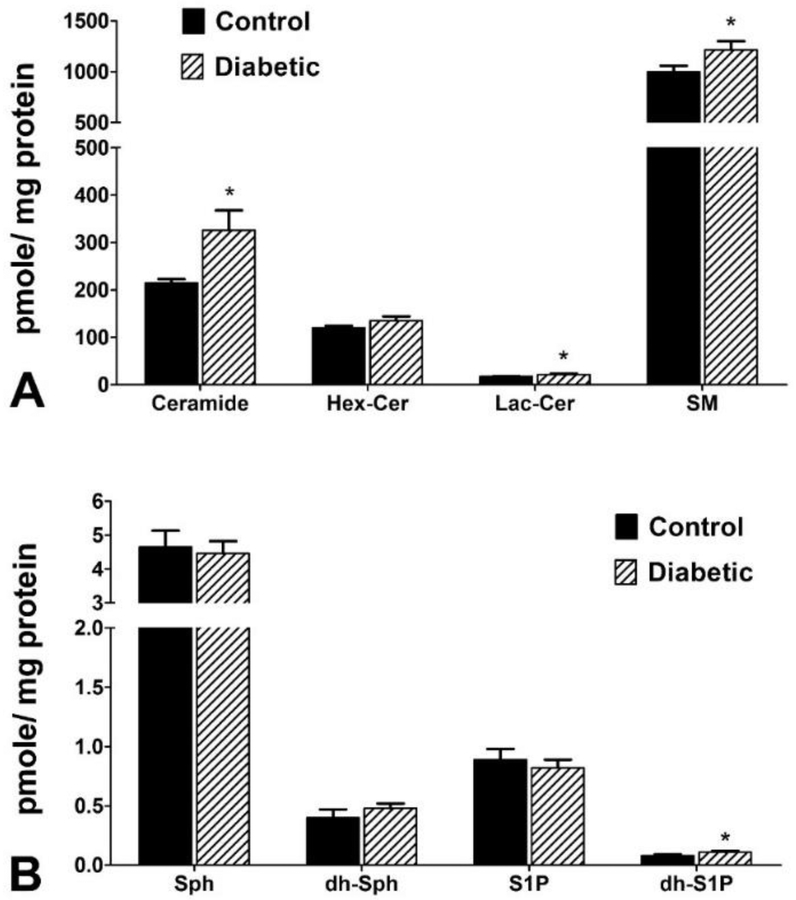
Human vitreous samples from T2DM and non-diabetic cadavers were analyzed for sphingolipids using LC-MS/MS. A) Quantification (pmol/mg) of major vitreal sphingolipids ceramide (Cer), hexosylceramide (Hex-Cer), lactosylceramide (Lac-Cer), and sphingomyelin (SM). Cer, Lac-Cer, and SM were significantly elevated in T2DM vitreous samples relative to control samples. B) Quantification (pmol/mg) of long-chain vitreal sphingolipid bases sphingosine (Sph), dihydro-sphingosine (dh-Sph), sphingosine 1-phosphate (S1P), and dihydro-sphingosine 1-phosphate (dh-S1P). The levels of dh-S1P were increased in T2DM vitreous samples compared to controls. No changes were detected in the Sph, dh-Sph, and S1P levels between diabetic and control groups. Data presented as mean pmol/mg protein ± SEM. * p < 0.05. (Control: n = 4; T2DM: n = 9).
3.2. Analysis of individual species of various sphingolipid classes:
Compositional analysis (molar ratio) of Cer, Hex-Cer, Lac-Cer, and SM species relative to other species within the same class showed a higher ratio of long-chain to short-chain Cer species in T2DM samples. Notably, Cer C24:0, C24:1, and C22:0 increased by 3%, 4%, and 3%, respectively, while C18:0 and C20:0 both decreased by 5% (Figure 3A). Quantification of species within each sphingolipid class revealed significant differences between T2DM and controls. Significant increases were seen in the levels of C22:0 (p<0.01) and the long-chain Cer species C24:1 (p< 0.05), C24:0 (p<0.05), and C26:0 (p<0.01) in T2DM, as well as an overall increase in total Cer levels (p<0.05; Table 2). Hex-Cer species C20:0 (p<0.05), C22:0 (p<0.05), and long-chain C26:0 (p<0.01) were all significantly increased in T2DM (Table 3). Lac-Cer species followed a similar trend with significant increases in C20:0 (p<0.05), C26:0 (p<0.05), and total Lac-Cer levels (p<0.05; Table 4). Quantification of SM showed a significant increase in C24:1 (p<0.05) (Table 5), and an overall increase in long-chain species (p<0.05).
Figure 3: Relative composition of major species of sphingolipid classes in control and diabetic vitreous samples.

Human vitreous samples from T2DM and non-diabetic (Control) cadavers were analyzed for sphingolipids using LC-MS/MS. Relative compositions of A) ceramide (Cer), B) hexosylceramide (Hex-Cer), C) lactosylceramide (Lac-Cer), and D) sphingomyelin (SM) species were quantified relative to their own chain length variants within each class of sphingolipid. Control human vitreous obtained from non-diabetic cadavers with unremarkable ocular pathologic history; Diabetic (T2DM) human vitreous obtained from cadavers with documented type 2 diabetes mellitus (Control: n = 4; T2DM: n = 9).
Table 2. Composition of ceramide (Cer) species from human vitreous samples.
Human vitreous samples were obtained from the eyes of either non-diabetic (Control) or type 2 diabetes mellitus (T2DM) cadavers. Quantification (pmol/mg) values are presented for each Cer species (pmol lipid/mg of protein; mean ± SE).
| Ceramide Species | Control (pmol/mg protein) |
Diabetic (pmol/mg protein) |
|---|---|---|
| C14:0 | 1.03 ± 0.24 | 1.21 ± 0.30 |
| C16:0 | 18.12 ± 3.79 | 22.98 ± 2.62 |
| C18:1 | 0.36 ± 0.11 | 0.51 ± 0.09 |
| C18:0 | 41.86 ± 3.81 | 45.43 ± 5.81 |
| C20:0 | 48.61 ± 2.05 | 58.01 ± 7.97 |
| C22:0 | 42.76 ± 3.14 | 74.33 ± 10.36 ** |
| C24:1 | 28.53 ± 2.59 | 59.43 ± 12.15 * |
| C24:0 | 33.24 ± 1.17 | 65.03 ± 14.41 * |
| C26:1 | 0.00 ± 0.00 | 0.06 ± 0.03 |
| C26:0 | 0.04 ± 0.01 | 0.15 ± 0.04 ** |
| Total | 214.55 ± 8.20 | 327.15 ± 46.70 * |
p < 0.05
p < 0.01; (Control: n = 4; T2DM: n = 9).
Table 3. Composition of monohexosylceramide (Hex-Cer) species from human vitreous samples.
Human vitreous samples were obtained from the eyes of either non-diabetic (Control) or type 2 diabetes mellitus (T2DM) cadavers. Quantification (pmol/mg) values are presented for each Hex-Cer species (pmol/mg of protein; mean ± SEM).
| Monohexosylceramide Species |
Control (pmol/mg protein) |
Diabetic (pmol/mg protein) |
|---|---|---|
| C14:0 | 0.62 ± 0.16 | 0.67 ± 0.12 |
| C16:0 | 9.70 ± 0.82 | 11.10 ± 0.93 |
| C18:1 | 0.41 ± 0.18 | 0.60 ± 0.08 |
| C18:0 | 10.87 ± 0.76 | 12.84 ± 2.56 |
| C20:0 | 6.87 ± 0.77 | 11.24 ± 1.68 * |
| C22:0 | 23.76 ± 0.37 | 30.00 ± 3.26 * |
| C24:1 | 42.56 ± 4.11 | 43.45 ± 4.01 |
| C24:0 | 24.48 ± 2.05 | 25.11 ± 1.57 |
| C26:1 | 1.01 ± 0.17 | 1.38 ± 0.39 |
| C26:0 | 0.01 ± 0.01 | 0.08 ± 0.02 ** |
| Total | 120.30 ± 4.11 | 136.46 ± 9.60 |
p < 0.05
p < 0.01, (Control: n = 4; T2DM: n = 9).
Table 4. Composition of lactosylceramide (Lac-Cer) species from human vitreous samples.
Human vitreous samples were obtained from the eyes of either non-diabetic (Control) or type 2 diabetes mellitus (T2DM) cadavers. Quantification (pmol/mg) values are presented for each Lac-Cer species (mean pmol/mg of protein ± SEM).
| Lactosylceramide Species |
Control (pmol/mg protein) |
Diabetic (pmol/mg protein) |
|---|---|---|
| C14:0 | 0.07 ± 0.02 | 0.08 ± 0.01 |
| C16:0 | 4.10 ± 0.23 | 5.05 ± 0.48 |
| C18:1 | 0.06 ± 0.03 | 0.10 ± 0.01 |
| C18:0 | 2.03 ± 0.02 | 2.66 ± 0.57 |
| C20:0 | 1.23 ± 0.13 | 2.12 ± 0.34 * |
| C22:0 | 2.20 ± 0.06 | 3.14 ± 0.51 |
| C24:1 | 5.07 ± 0.45 | 5.60 ± 0.58 |
| C24:0 | 2.74 ± 0.30 | 3.17 ± 0.22 |
| C26:1 | 0.13 ± 0.02 | 0.21 ± 0.07 |
| C26:0 | 0.00 ± 0.00 | 0.01 ± 0.00 * |
| Total | 17.65 ± 0.38 | 22.14 ± 2.12 * |
p < 0.05; (Control: n = 4; T2DM: n = 9).
Table 5. Composition of sphingomyelin (SM) species from human vitreous samples.
Human vitreous samples were obtained from the eyes of either non-diabetic (Control) or type 2 diabetes mellitus (T2DM) cadavers. Quantification (pmol/mg) values presented for each SM species (mean pmol/mg of protein ± SE).
| Sphingomyelin Species | Control (pmol/mg protein) |
Diabetic (pmol/mg protein) |
|---|---|---|
| C14:0 | 18.73 ± 3.12 | 24.06 ± 3.16 |
| C16:0 | 187.15 ± 32.82 | 199.97 ± 14.55 |
| C18:1 | 51.12 ± 11.35 | 61.93 ± 6.57 |
| C18:0 | 126.37 ± 11.15 | 144.34 ± 10.18 |
| C20:0 | 117.41 ± 7.24 | 125.38 ± 6.83 |
| C22:0 | 143.99 ± 5.95 | 173.45 ± 15.91 |
| C24:1 | 182.72 ± 19.18 | 256.43 ± 30.58 * |
| C24:0 | 171.23 ± 12.82 | 204.51 ± 23.37 |
| C26:1 | 1.84 ± 1.69 | 6.04 ± 2.60 |
| C26:0 | 0.02 ± 0.01 | 0.02 ± 0.01 |
| Total | 1000.58 ± 57.80 | 1196.14 ± 93.53 |
p < 0.05; (Control: n = 4; T2DM: n = 9).
4. Discussion
Our results suggest an alteration of sphingolipid composition in human T2DM vitreous from control vitreous. We found that T2DM vitreous is associated with an increase in total Cer levels (p<0.05; Figure 2A) and with significant increases in Cer species that have longer-chain length (C>20) (Table 2). Likewise, total Lac-Cer levels were significantly elevated in T2DM (p<0.05; Figure 2A), with significant increases noted specifically in long-chain C20:0 (p<0.05) and C26:0 (p<0.05; Table 4). Among SM species, we observed significant elevation of C24:1 (p<0.05; Figure 2A, and Table 5). Significant elevations of Hex-Cer species C20:0 (p<0.05), C22:0 (p<0.05), and C26:0 (p<0.01) were also observed (Table 3), though no increase in total Hex-Cer levels was seen (Figure 2A). Among long-chain base species, we observed a significant increase in dh-S1P (Figure 2B). Among the four sphingolipid classes we quantified, we saw a 3% increase in Cer along with 2% and 1% decreases in SM and Hex-Cer, respectively (Figure 1).
DM is a widespread and fast-growing epidemic which already affects nearly one-tenth of the world’s population and can be expected to become the 7th leading cause of death by 2030 2, 39. The risk factors for developing T2DM, which comprises 90% of all DM cases 2, mirror risk factors for a number of dangerous comorbid diseases such as cardiovascular disease, hypertension and chronic kidney disease. Only 14% of diabetic patients had no other comorbidities in the US population from a study conducted from 1999 to 2004 40. Complications arising from DM will continue to contribute an enormous increase in disability among the growing diabetic population. As over one-third of diabetics were found to have signs of developing DR or proliferative DR (PDR) in 2010, blindness associated with PDR will continue to weigh heavily on healthcare systems worldwide 41. The prevalence and severity of DM and its complications can be reduced with the aid of improved diagnostic and therapeutic methods, which in turn would benefit from advances in the lipidomic understanding of DM.
Sphingolipids have increasingly gained recognition in recent years for their important roles in fundamental cellular processes and cell structure as membrane components 20-25. They are lipids that are found in all cell membranes 42, 43, and are composed of a variety of classes, including ceramides, sphingomyelins, and S1Ps. Recently, they have gained attention due to their involvement in cell signaling 43, 44. Sphingolipids play a key role in the regulation of several fundamental biological processes, such as signal transduction, cell proliferation, migration, and apoptosis 22, 43-46. Cer, Sph, and S1P are bioactive sphingolipids 30 and S1P in particular has been shown to be involved in blood vessel formation, differentiation, and endothelial cell migration 47. Sphingolipid signaling has been implicated in the development of diabetes and diabetes-induced complications, and alterations in the sphingolipid profile have previously been reported in diabetic retinas 5, 26-29, specifically including changes in different molecular species of Cer and certain glucosylceramide species 26. However, while there are multiple proteomic studies focusing on the diabetic vitreous, there is very little information on the role of sphingolipids in the human diabetic vitreous that we have been able to find.
The vitreous occupies the posterior chamber of the eye and represents about 80% of the ocular volume in humans. It is a gel-like connective tissue comprised of 98% water. Of the remaining 2% of the vitreous, 87% consists of proteins, 9% lipids, and 4% carbohydrates 48. The vitreous humor is also known to serve as a potassium sink and may be involved in the regulation of potassium currents in retina via Muller cells 49. In terms of specific sphingolipid composition of the human vitreous, there was no report except a published abstract which has suggested the presence of various sphingolipid species including Cer, Lac-Cer, Hex-Cer, and SM in surgically-isolated (vitrectomy) samples of diabetic patients 50. The sphingolipids SM, sphingoid base, S1P, and Cer have also been characterized in the aqueous humor in human eyes, with differences noted between normal and hypertensive samples 51. It has been shown that that changes to the vitreous can result from neovascularization secondary to PDR, but there is also potential for the state of the vitreous to influence neovascularization. Retinal neovascularization requires the presence of a collagenous scaffold provided by the vitreoretinal interface, which is disrupted in posterior vitreous detachment (PVD). The presence of PVD has been found to be associated with protection from PDR due to disruption of the vitreoretinal interface, and induced PVD has been suggested as a potential preventative surgical treatment for PDR 52. Findings such as this highlight the importance of filling in the gaps in our collective understanding of the biochemical mechanisms of ocular disease within the vitreous, which necessarily includes sphingolipid analysis.
The potential clinical significance of vitreous analysis is becoming more apparent as our understanding of the functional role of the vitreous grows and minimally-invasive ante-mortem vitreous extraction techniques continue to develop. In understanding the changes associated with the vitreous in a diabetic state, further advances in the diagnosis and tracking of diabetes progression in a clinical setting can be developed. Methods of vitreous extraction are evolving to become increasingly less invasive, to the point where small samples (50-100 μL) of vitreous humor can be collected in an outpatient setting with negligible risk to the patient involved 53. The actual diagnostic utility of vitreous sampling will continue to increase as our understanding of the vitreous in various disease states evolves. Vitreous sampling has the potential to become a useful tool in the diagnosis of a wide range of ocular diseases and we expect sphingolipids to play a major role to that end.
A hallmark of PDR is neovascularization and proliferation of blood vessels throughout the retina and into the vitreous, which may result in vitreous hemorrhage _ENREF_5454. Therefore, leakage of extra-vitreal substance into the vitreous through hemorrhage as in advanced PDR should be evident in analysis of vitreous composition. Unfortunately, we were unable to obtain samples from any donors which had been definitively diagnosed with PDR or vitreous hemorrhage as indicated by medical records. We noticed some of the vitreous samples were pinkish in color, indicating possible vitreous hemorrhage. However, we analyzed those against the transparent vitreous samples and found no major difference in the quantity of lipids. Similarly, the samples from donors with a medical history of DR were found to have no significant differences in sphingolipid concentration from diabetic samples with no noted DR. It may not be prudent to draw many conclusions from this due to the lack of detail in the patients’ medical records. For example, for the donors diagnosed with DR, none of the medical records we were able to obtain contained the date of DR diagnosis, physician’s examination or follow-up notes, laboratory or imaging results, or any other reports needed to determine the state of progression of the donors’ DR. The other major limitation could be that our sample size was very small. A study with much higher number of samples is needed with more detailed medical records to delineate the minute differences between DM without retinopathy, DR, and PDR in terms of sphingolipid composition. The primary merit of this study is that it is the first where we could determine the presence of bioactive sphingolipids in human vitreous. Second, despite the small sample size, we found differences between T2DM and control samples in bioactive sphingolipids, which could have been very well connected to the disease pathologies of the retina, retinal vessels, vitreous and the surrounding tissues. This may justify a further detailed study of samples from vitrectomy surgeries to compare the state of the vitreous under different disease conditions. Ultimately, we hope that this study lays the groundwork for future investigation into the possibility that the sphingolipids identified in diseased human vitreous samples can eventually serve as diagnostic biomarkers or targets for T2DM and other diseases.
Highlights:
This is the first study on Sphingolipid profile in human vitreous humor.
Sphingolipid profile of human vitreous is compared in postmortem eyes from individuals with type 2 diabetes and no-diabetes.
Diabetic samples contain higher levels of ceramide, lactosylceramide, and sphingomyelin.
Diabetic samples contain increased levels of longer chain species of ceramide, hexosylceramide, lactosylceramide, and sphingomyelin.
Acknowledgements:
This work was supported by National Eye Institute grants [EY022071, EY025256, EY021725], and grants from Foundation Fighting Blindness Inc., USA and Research to Prevent Blindness Inc., USA. The Lipidomic services [Virginia Commonwealth University (VCU) Lipidomics/Metabolomics Core] and products in support of the study were generated, in part, by the VCU Massey Cancer Center, with funding from National Institutes of Health Grant [P30 CA016059]. The content is solely the responsibility of the authors and does not necessarily represent the official views of the National Institutes of Health, the Department of Veterans Affairs, or the U.S. government.
Abbreviations:
- Cer
Ceramide
- DM
Diabetes Mellitus
- Hex-Cer
Hexosylceramide
- Lac-Cer
Lactosylceramide
- S1P
sphingosine 1-phosphate
- SM
Sphingomyelin
- Sph
Sphingosine
Footnotes
Publisher's Disclaimer: This is a PDF file of an unedited manuscript that has been accepted for publication. As a service to our customers we are providing this early version of the manuscript. The manuscript will undergo copyediting, typesetting, and review of the resulting proof before it is published in its final citable form. Please note that during the production process errors may be discovered which could affect the content, and all legal disclaimers that apply to the journal pertain.
References
- 1.Klein R. The epidemiology of diabetic retinopathy: findings from the Wisconsin Epidemiologic Study of Diabetic Retinopathy. Int Ophthalmol Clin. 1987;27(4): 230–238. [DOI] [PubMed] [Google Scholar]
- 2.Center for Disease Control and Prevention, 2017. National Diabetes Statistics Report. U.S. Department of Health and Human Services. 2017. [Google Scholar]
- 3.Ng ML, Wadham C, Sukocheva OA. The role of sphingolipid signalling in diabetesassociated pathologies (Review). Int J Mol Med. 2017;39(2): 243–252. [DOI] [PMC free article] [PubMed] [Google Scholar]
- 4.Holland WL, Summers SA. Sphingolipids, insulin resistance, and metabolic disease: new insights from in vivo manipulation of sphingolipid metabolism. Endocr Rev. 2008;29(4): 381–402. [DOI] [PMC free article] [PubMed] [Google Scholar]
- 5.Bergman BC, Brozinick JT, Strauss A, et al. Muscle sphingolipids during rest and exercise: a C18:0 signature for insulin resistance in humans. Diabetologia. 2016;59(4): 785–798. [DOI] [PubMed] [Google Scholar]
- 6.Wei N, Pan J, Pop-Busui R, et al. Altered sphingoid base profiles in type 1 compared to type 2 diabetes. Lipids Health Dis. 2014;13: 161. [DOI] [PMC free article] [PubMed] [Google Scholar]
- 7.Mwinyi J, Bostrom A, Fehrer I, et al. Correction: Plasma 1-deoxysphingolipids are early predictors of incident type 2 diabetes mellitus. PloS one. 2017;12(6): e0179313. [DOI] [PMC free article] [PubMed] [Google Scholar]
- 8.Schofield JD, Steiner R, Liu Y, et al. Sphingolipids and deoxysphingolipids in diabetes. Atherosclerosis. 2016;255: 4. [Google Scholar]
- 9.Mwinyi J, Bostrom A, Fehrer I, et al. Plasma 1-deoxysphingolipids are early predictors of incident type 2 diabetes mellitus. PloS one. 2017;12(5): e0175776. [DOI] [PMC free article] [PubMed] [Google Scholar]
- 10.Habib AA, Brannagan TH 3rd. Therapeutic strategies for diabetic neuropathy. Curr Neurol Neurosci Rep. 2010;10(2): 92–100. [DOI] [PubMed] [Google Scholar]
- 11.Wang H, Feng L, Hu J, Xie C, Wang F. Differentiating vitreous proteomes in proliferative diabetic retinopathy using high-performance liquid chromatography coupled to tandem mass spectrometry. Exp Eye Res. 2013;108: 110–119. [DOI] [PubMed] [Google Scholar]
- 12.Noulas AV, Skandalis SS, Feretis E, Theocharis DA, Karamanos NK. Variations in content and structure of glycosaminoglycans of the vitreous gel from different mammalian species. Biomed Chromatogr. 2004;18(7): 457–461. [DOI] [PubMed] [Google Scholar]
- 13.Angi M, Kalirai H, Coupland SE, Damato BE, Semeraro F, Romano MR. Proteomic analyses of the vitreous humour. Mediators Inflamm. 2012;2012: 148039. [DOI] [PMC free article] [PubMed] [Google Scholar]
- 14.Monteiro JP, Santos FM, Rocha AS, et al. Vitreous humor in the pathologic scope: insights from proteomic approaches. Proteomics Clin Appl. 2015;9(1-2): 187–202. [DOI] [PubMed] [Google Scholar]
- 15.Simsek IB, Artunay O. Evaluation of Biochemical Composition of Vitreous of Eyes of Diabetic Patients Using Proton Magnetic Resonance Spectroscopy. Curr Eye Res. 2017;42(5): 754–758. [DOI] [PubMed] [Google Scholar]
- 16.Young SP, Nessim M, Falciani F, et al. Metabolomic analysis of human vitreous humor differentiates ocular inflammatory disease. Mol Vis. 2009;15: 1210–1217. [PMC free article] [PubMed] [Google Scholar]
- 17.Schwartzman ML, Iserovich P, Gotlinger K, et al. Profile of lipid and protein autacoids in diabetic vitreous correlates with the progression of diabetic retinopathy. Diabetes. 2010;59(7): 1780–1788. [DOI] [PMC free article] [PubMed] [Google Scholar]
- 18.Mancino R, Di Pierro D, Varesi C, et al. Lipid peroxidation and total antioxidant capacity in vitreous, aqueous humor, and blood samples from patients with diabetic retinopathy. Mol Vis. 2011;17: 1298–1304. [PMC free article] [PubMed] [Google Scholar]
- 19.Nuzzi R, Marchese A, Gulino GR, Versino E, Ghigo D. Influence of posterior vitreous detachment and type of intraocular lens on lipid peroxidation in the human vitreous. Mol Vis. 2015;21: 1106–1112. [PMC free article] [PubMed] [Google Scholar]
- 20.Presa N, Gomez-Larrauri A, Rivera IG, Ordonez M, Trueba M, Gomez-Munoz A. Regulation of cell migration and inflammation by ceramide 1-phosphate. Biochimica et biophysica acta. 2016;1861(5): 402–409. [DOI] [PubMed] [Google Scholar]
- 21.Rivera IG, Ordonez M, Presa N, et al. Ceramide 1-phosphate regulates cell migration and invasion of human pancreatic cancer cells. Biochem Pharmacol. 2016;102: 107–119. [DOI] [PubMed] [Google Scholar]
- 22.Hannun YA, Obeid LM. Principles of bioactive lipid signalling: lessons from sphingolipids. Nature reviews Molecular cell biology. 2008;9(2): 139–150. [DOI] [PubMed] [Google Scholar]
- 23.Chan AY, Mann SN, Chen H, Stone DU, Carr DJ, Mandal NA. Sphingolipids in ocular inflammation. Advances in experimental medicine and biology. 2014;801: 623–629. [DOI] [PMC free article] [PubMed] [Google Scholar]
- 24.Dong A, Xie B, Shen J, et al. Oxidative stress promotes ocular neovascularization. Journal of cellular physiology. 2009;219(3): 544–552. [DOI] [PMC free article] [PubMed] [Google Scholar]
- 25.Xie B, Shen J, Dong A, Rashid A, Stoller G, Campochiaro PA. Blockade of sphingosine-1-phosphate reduces macrophage influx and retinal and choroidal neovascularization. Journal of cellular physiology. 2009;218(1): 192–198. [DOI] [PMC free article] [PubMed] [Google Scholar]
- 26.Fox TE, Han X, Kelly S, et al. Diabetes alters sphingolipid metabolism in the retina: a potential mechanism of cell death in diabetic retinopathy. Diabetes. 2006;55(12): 3573–3580. [DOI] [PMC free article] [PubMed] [Google Scholar]
- 27.Priyadarsini S, Sarker-Nag A, Allegood J, Chalfant C, Karamichos D. Description of the sphingolipid content and subspecies in the diabetic cornea. Curr Eye Res. 2015;40(12): 1204–1210. [DOI] [PMC free article] [PubMed] [Google Scholar]
- 28.Chakravarthy H, Navitskaya S, O'Reilly S, et al. Role of Acid Sphingomyelinase in Shifting the Balance Between Proinflammatory and Reparative Bone Marrow Cells in Diabetic Retinopathy. Stem cells. 2016;34(4): 972–983. [DOI] [PMC free article] [PubMed] [Google Scholar]
- 29.Tikhonenko M, Lydic TA, Opreanu M, et al. N-3 polyunsaturated Fatty acids prevent diabetic retinopathy by inhibition of retinal vascular damage and enhanced endothelial progenitor cell reparative function. PloS one. 2013;8(1): e55177. [DOI] [PMC free article] [PubMed] [Google Scholar]
- 30.Bartke N, Hannun YA. Bioactive sphingolipids: metabolism and function. Journal of lipid research. 2009;50 Suppl: S91–96. [DOI] [PMC free article] [PubMed] [Google Scholar]
- 31.Chen H, Chan AY, Stone DU, Mandal NA. Beyond the cherry-red spot: Ocular manifestations of sphingolipid-mediated neurodegenerative and inflammatory disorders. Surv Ophthalmol. 2014;59(1): 64–76. [DOI] [PMC free article] [PubMed] [Google Scholar]
- 32.Chen H, Tran JT, Eckerd A, et al. Inhibition of de novo ceramide biosynthesis by FTY720 protects rat retina from light-induced degeneration. J Lipid Res. 2013;54(6): 1616–1629. [DOI] [PMC free article] [PubMed] [Google Scholar]
- 33.Qi H, Priyadarsini S, Nicholas SE, et al. Analysis of sphingolipids in human corneal fibroblasts from normal and keratoconus patients. J Lipid Res. 2017;58(4): 636–648. [DOI] [PMC free article] [PubMed] [Google Scholar]
- 34.Stiles M, Qi H, Sun E, et al. Sphingolipid profile alters in retinal dystrophic P23H-1 rats and systemic FTY720 can delay retinal degeneration. J Lipid Res. 2016;57(5): 818–831. [DOI] [PMC free article] [PubMed] [Google Scholar]
- 35.Simanshu DK, Kamlekar RK, Wijesinghe DS, et al. Non-vesicular trafficking by a ceramide-1-phosphate transfer protein regulates eicosanoids. Nature. 2013;500(7463): 463–467. [DOI] [PMC free article] [PubMed] [Google Scholar]
- 36.Wijesinghe DS, Allegood JC, Gentile LB, Fox TE, Kester M, Chalfant CE. Use of high performance liquid chromatography-electrospray ionization-tandem mass spectrometry for the analysis of ceramide-1-phosphate levels. J Lipid Res. 2010;51(3): 641–651. [DOI] [PMC free article] [PubMed] [Google Scholar]
- 37.Wijesinghe DS, Brentnall M, Mietla JA, et al. Ceramide kinase is required for a normal eicosanoid response and the subsequent orderly migration of fibroblasts. J Lipid Res. 2014;55(7): 1298–1309. [DOI] [PMC free article] [PubMed] [Google Scholar]
- 38.Shaner RL, Allegood JC, Park H, et al. Quantitative analysis of sphingolipids for lipidomics using triple quadrupole and quadrupole linear ion trap mass spectrometers. J Lipid Res. 2009;50(8): 1692–1707. [DOI] [PMC free article] [PubMed] [Google Scholar]
- 39.Mathers CD, Loncar D. Projections of global mortality and burden of disease from 2002 to 2030. PLoS Med. 2006;3(11): e442. [DOI] [PMC free article] [PubMed] [Google Scholar]
- 40.Suh DC, Choi IS, Plauschinat C, Kwon J, Baron M. Impact of comorbid conditions and race/ethnicity on glycemic control among the US population with type 2 diabetes, 1988-1994 to 1999-2004. J Diabetes Complications. 2010;24(6): 382–391. [DOI] [PubMed] [Google Scholar]
- 41.Lee R, Wong TY, Sabanayagam C. Epidemiology of diabetic retinopathy, diabetic macular edema and related vision loss. Eye Vis (Lond). 2015;2: 17. [DOI] [PMC free article] [PubMed] [Google Scholar]
- 42.Milhas D, Clarke CJ, Hannun YA. Sphingomyelin metabolism at the plasma membrane: implications for bioactive sphingolipids. FEBS letters. 2010;584(9): 1887–1894. [DOI] [PMC free article] [PubMed] [Google Scholar]
- 43.Goni FM, Sot J, Alonso A. Biophysical properties of sphingosine, ceramides and other simple sphingolipids. Biochem Soc Trans. 2014;42(5): 1401–1408. [DOI] [PubMed] [Google Scholar]
- 44.Ponnusamy S, Meyers-Needham M, Senkal CE, et al. Sphingolipids and cancer: ceramide and sphingosine-1-phosphate in the regulation of cell death and drug resistance. Future oncology. 2010;6(10): 1603–1624. [DOI] [PMC free article] [PubMed] [Google Scholar]
- 45.Patwardhan GA, Beverly LJ, Siskind LJ. Sphingolipids and mitochondrial apoptosis. J Bioenerg Biomembr. 2016;48(2): 153–168. [DOI] [PMC free article] [PubMed] [Google Scholar]
- 46.Hannun YA, Luberto C. Lipid metabolism: ceramide transfer protein adds a new dimension. Curr Biol. 2004;14(4): R163–165. [PubMed] [Google Scholar]
- 47.Wendler CC, Rivkees SA. Sphingosine-1-phosphate inhibits cell migration and endothelial to mesenchymal cell transformation during cardiac development. Developmental biology. 2006;291(2): 264–277. [DOI] [PubMed] [Google Scholar]
- 48.Reddy TS, Birkle DL, Packer AJ, Dobard P, Bazan NG. Fatty acid composition and arachidonic acid metabolism in vitreous lipids from canine and human eyes. Curr Eye Res. 1986;5(6): 441–447. [DOI] [PubMed] [Google Scholar]
- 49.Newman EA. Regional specialization of retinal glial cell membrane. Nature. 1984;309(5964): 155–157. [DOI] [PMC free article] [PubMed] [Google Scholar]
- 50.Glazer LC, Lydic TA, McSorley K, Reid GE, Mohr S, Busik JV. Changes in Sphingolipid metabolism in the Vitreous from Diabetic Patients. Investigative Ophthalmology & Visual Science. 53 2012:2215–2215. [Google Scholar]
- 51.Edwards G, Aribindi K, Guerra Y, Bhattacharya SK. Sphingolipids and ceramides of mouse aqueous humor: Comparative profiles from normotensive and hypertensive DBA/2J mice. Biochimie. 2014;105: 99–109. [DOI] [PMC free article] [PubMed] [Google Scholar]
- 52.de Smet MD, Gad Elkareem AM, Zwinderman AH. The vitreous, the retinal interface in ocular health and disease. Ophthalmologica. 2013;230(4): 165–178. [DOI] [PubMed] [Google Scholar]
- 53.Pfahler SM, Brandford AN, Glaser BM. A prospective study of in-office diagnostic vitreous sampling in patients with vitreoretinal pathology. Retina. 2009;29(7): 1032–1035. [DOI] [PubMed] [Google Scholar]
- 54.Chaudhury A, Duvoor C, Reddy Dendi VS, et al. Clinical Review of Antidiabetic Drugs: Implications for Type 2 Diabetes Mellitus Management. Front Endocrinol (Lausanne). 2017;8: 6. [DOI] [PMC free article] [PubMed] [Google Scholar]