Abstract
Alpha fetoprotein (AFP) is produced by over 50% of hepatocellular carcinomas (HCC). Uptake of tumor-derived AFP (tAFP) can impair activity of human dendritic cells (DC). The expression pattern of the lipid antigen presenting genes from the CD1 family is reduced in AFP-treated monocyte-derived DC. Surface CD1 family proteins, particularly CD1d, were reduced in AFP-exposed DC (by both normal cord blood-derived AFP (nAFP) and tAFP). NKT cells recognize lipid antigens presented by CD1d molecules. They play an important role in connecting the innate and adaptive immune systems, and in anti-tumor immunity. We hypothesized that AFP might impair the ability of DC to stimulate natural killer T (NKT) cells. No significant impact of AFP was observed on NKT cell stimulation. By examining secreted cytokines, we observed non-significant AFP-induced changes in several secreted proteins. These data indicate that AFP downregulates CD1 molecules on DC, but the impact on NKT cell activations is minimal.
Keywords: NKT cells, liver cancer, alpha-fetoprotein, CD1, cytokines, dendritic cells, alpha galactosylceramide, tumor, human, tetramer
1.0. INTRODUCTION
Hepatocellular carcinoma (HCC) is one of the most common global cancers, particularly in Asia. Over 782,000 people are newly diagnosed with HCC worldwide, and over 745,000 deaths are caused by HCC annually [1]. Alpha fetoprotein (AFP) is a protein normally expressed in the fetus which plays an important role in embryonic development. When found circulating at high levels in human blood, it is often related to tumor growth. Over 50% of HCC patients have elevated AFP in their serum, which has been used as a biomarker. High serum AFP level is correlated with increased tumor burden, large tumor volume and poor clinical outcomes [2].
We have observed that uptake of AFP causes morphologic change in monocyte-derived DC (DC) and impairs their differentiation [3]. The effects of tumor-derived AFP (tAFP) are more potent than those of cord blood-derived “normal” AFP (nAFP). The surface level of the monocyte and immature DC marker CD14 was higher in nAFP and tAFP treated DC compared to those treated with the control albuminoid family member protein ovalbumin (OVA). Human lymphocyte class I antigens (HLA-ABC), mannose receptor (CD206), the costimulatory molecule CD80 and maturation marker CD83 were all down-regulated in nAFP and tAFP treated DC. DC maturation with IFNγ+LPS failed to overcome the AFP-induced effects, particularly on HLA-ABC, CD80 and CD83 [3]. DC exposed to AFP also had greatly reduced cytoplasm and significantly reduced metabolic activity (Santos, 2018, submitted). DC derived from monocytes cultured in the presence of AFP (both tAFP and nAFP) stimulated T cells with a lower level of proliferation, in both a mixed lymphocyte reaction (MLR), and in an influenza-specific T cell recall response assay [3]. More recently, we found that AFP can impact the ability of human dendritic cells (DC) to stimulate NK cells [4], resulting in altered cytokine production and decreased NK cell viability.
Natural killer T cells (NKT cells) are a lineage of T cells that have characteristics of both conventional T cells and natural killer (NK) cells. They play an important role in immune surveillance of cancer, and may be important effector cells for cancer immunotherapy [5]. Although the frequency of NKT cells is low in the peripheral blood in humans, they are found to be enriched in adipose tissue and human liver [6]. Instead of recognizing peptide antigens presented by MHC class I or II molecules, invariant NKT cells, in particular, recognize lipid antigens (mainly glycolipids) presented by CD1d molecules on antigen presenting cells (APC) [7]. Given the immune tolerant environment in the liver and the immune modulating effects of AFP, here we examined the impact of nAFP and tAFP on the CD1 family of molecules on DC and tested the downstream effects on DC modulation of NKT cell function in vitro.
2.0. MATERIALS AND METHODS
2.1. Generation of human dendritic cells from monocytes
Peripheral blood mononuclear cells (PBMC) were isolated from human healthy donor blood using Ficoll-Paque Plus (GE Healthcare Life Sciences, Piscataway, NJ, USA). CD14+ monocytes were separated from PBMC with CD14 magnetic body cell (CD14-MACS) selection (Miltenyi Biotec, Auburn, CA, USA). The monocytes were then cultured in AIM-V Medium Albu-Max (Life Technologies, Carlsbad, CA, USA) supplemented with 2% human AB serum (Sigma-Aldrich, Saint Louise, MO, USA), 500U/mL IL-4 (Gemini, West Sacramento, CA, USA) and 800U/mL GM-CSF (Gemini, West Sacramento, CA, USA) for 5 days to derive myeloid DC. OVA, nAFP or tAFP treated DC were derived by adding purified OVA (Fisher Scientific, Suwanee, GA, USA), human cord serum AFP (purity > 95% by SDS-PAGE; Cell Sciences, Newburyport, MA, USA), and HCC cell line culture-derived AFP (purity > 95% by SDS-PAGE; Bio-Rad, Hercules, CA, USA) at 10 μg/ml. DC were harvested with cold PBS on day 5, and kept in normal DC medium, AIM-V Medium Albu-Max supplemented with 2% human AB serum, 500U/mL IL-4 and 800U/mL GM-CSF for another 24h without the proteins. To mature the DC, 1000U/mL IFN-γ and 250ng/mL lipopolysaccharide (LPS) were added to the culture and cultured for 24h.
2.2. DC and NKT co-cultures
T cells were isolated from CD14-depleted PBMC using CD3 magnetic bead (CD3-MACS) selection (Miltenyi Biotec, Auburn, CA, USA) and cryopreserved at −80 °C for 5 days. On day 5, NKT activating antigens α-GalCer or C24:1 Glucosyl(ß) Ceramide (d18:1/24:1(15Z))(β-GlcCer) (Avanti Polar Lipids, Alabaster, AL, USA) were added to the DC culture overnight. On day 6, DC were harvested with TrypLE Select (Life Technologies, Carlsbad, CA, USA), and were co-cultured with thawed autologous T cells at a 1:5 ratio in AIM-V/5% human AB serum/1% penicillin/streptomycin/ 1% L-glutamine. T cells stimulated with 50ng/ml phorbol 12-myristate 13-acetate (PMA) and 2 μM ionomycin were used as a positive control. On day7, 10μg/ml of brefeldin (Sigma-Aldrich, Saint Louis, MO, USA) was added into the culture to block cytokine secretion. Five hours later, cells were collected with cold PBS and analyzed with BD LSR Fortessa flow cytometer (Becton Dickinson, Franklin Lakes, NJ).
2.3. DC and NKT analysis
On day 5, DC were harvested with TrypLE Select. Cells were stained with antibodies (CD1a - FITC, HI149; CD1b - APC, SN13 K5-B8; CD1c - PE-Cy7, L161; CD1d - APC, 1B1 - eBioscience) according to manufacturer’s instructions, and staining was performed in FACS buffer (0.2% BSA and 0.02% NaN3 in PBS). Samples were analyzed using a BD Accuri C6 flow cytometer (Becton Dickinson, Franklin Lakes, NJ).
After surface staining, cells were fixed with IC fixation buffer (eBioscience, San Diego, CA, USA), permeabilized (0.1% Saponin in FACS buffer) and stained for intracellular CD1d molecules with CD1d-PE mAb. Peroxisome proliferator-activated receptor gamma coactivator 1-alpha (PGC-1α), was used as a positive control for permeabilization, while co-stimulatory molecule CD86 was used as a control for surface molecules. PGC-1α was stained with polyclonal rabbit anti-human antibody at 1:100 dilution (Santa Cruz Biotechnology, Santa Cruz, CA, USA), and anti-rabbit Fab conjugated with Alexa 488 (Cell Signaling Technology, Danvers, MA, USA) as a secondary antibody, used at 1:500 dilution. 5% human AB serum in permeablization buffer was used to block unspecific bindings of the antibody.
NKT cells were identified by staining with human CD1d tetramers conjugated with PE, provided by National Institutes of Health Tetramer Core Facility (Atlanta, GA, USA) with 1:1000 dilution. CD1d tetramers loaded with PBS-57. Unloaded CD1d tetramers were used as a negative control for unspecific binding. In some cases, NKT cells were also stained with APC anti-human TCR Vα24-Jα18 (iNKT cell) antibody (Biolegend, San Diego, CA, USA). Antibodies used for NKT cells staining were: CD3 - FITC, UCHT1; CD4 - PerCP- Cy5.5, RPA-T4; CD8 - APC-Cy7, RPA-T8; CD25 - Brilliant Violet 421, M-A251; CD56 - Brilliant Violet 510, NCAM16.2; CD69 - Brilliant Violet 786, FN50; IL-4 - AP C, 8D4– 8; IFNγ - PE-Cy7, B27 (BD Biosciences). Flow cytometry data were analyzed with FlowJo. Gating was based on control beads (BD CompBeads) stained with the same antibodies, and all samples were gated identically, based on automated gating by FlowJo, to avoid changing the analysis parameters between weakly positive samples and strongly positive controls.
Cell-free supernatants were collected and analyzed with ProcartaPlex Mix&Match Human 12-plex Luminex kit eotaxin, GM-CSF, IFN-γ, IL-10, IL-13, IL-17A, IL-2, IL-4, MIP-1α, MIP-1β, RANTES and TNF-α). (Invitrogen, Vienna, Austria). according to manufacturer’s instructions in the UPMC Hillman Cancer Center Immunologic Monitoring Laboratory using a Bio-Plex Luminex 200 System (BioRad, Hercules, CA, USA). The data was analyzed using Bio-Plex Manager 6.0 Software (BioRad, Hercules, CA, USA).
3.0. RESULTS
3.1. Surface CD1d family proteins are reduced in AFP treated DC
Based on analysis of our RNA microarray data for OVA, nAFP and tAFP cultured DC [3], we observed significantly reduced mRNA expression of the CD1 family of antigen presentation molecules with AFP exposure. To confirm these findings, we performed flow cytometric analysis to determine surface expression of CD1d molecule proteins in DC exposed to OVA, nAFP and tAFP. We observed significant reductions in protein levels of CD1 molecules (CD1a, CD1b, CD1c and CD1d) in both nAFP and tAFP treated DC compared to control OVA treated DC (Figure 1A).
Figure 1.
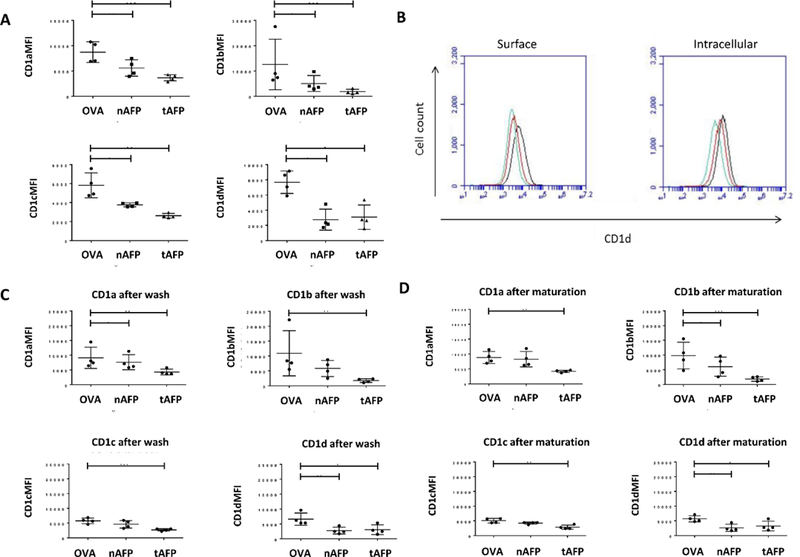
A. DC surface staining for CD1 family molecules. CD14+ monocytes were cultured with OVA, nAFP or tAFP and GM-CSF and IL-4 to derive DC. (A)-(D), The MFI of surface CD1a, b, c, and d. on DC at day 5 is shown. * indicates p< 0.05, ** indicates p<0.01 of AFP groups compared to OVA control. B. Intracellular staining for CD1d. Left, surface staining only; right, surface and intracellular staining. Black, OVA treated DC; Green, nAFP treated DC; Red, tAFP treated DC. Shown is one representative histogram from one of three donors. C. Surface staining for CD1 family molecules of DC after washout of AFP/OVA. Flow cytometric analysis was performed to determine levels of CD1a, CD1b, CD1c and CD1d molecules. * indicates p< 0.05, ** indicates p<0.01, ***indicates p<0.001. D. Surface staining for CD1a, CD1b, CD1c and CD1d on DC matured with LPS+IFNγ. * indicates p< 0.05, ** indicates p<0.01, ***indicates p<0.001
3.2. Down-regulation of CD1 molecules was not caused by internalization
AFP uptake could cause internalization of CD1d, leading to a decrease of surface protein level, while keeping total protein amounts constant. To investigate this, we permeabilized DC treated with OVA, nAFP or tAFP and performed intracellular staining to compare with surface staining. Data showed that there was detectable intracellular CD1d, but the overall protein level of CD1d in AFP treated DC remained significantly lower than that in OVA treated DC (Figure 1B). This indicates that this down-regulation of CD1d molecules was global, and not a translocation of surface CD1d to the cytoplasm.
3.3. AFP washout and impact of DC maturation
To determine whether removal of the AFP proteins after exposure would allow CD1 molecules to return to unexposed values, DC were exposed to OVA, nAFP or tAFP for 5 days, then washed and recultured in medium alone for 1 day. Protein washout did not result in an increase of CD1 molecules to unexposed levels (Figure 1C). To determine whether DC maturation with LPS+IFN-γ, which is known to increase MHC class I and II molecule and costimulatory molecule expression on DC (and which we used previously [3]), would reverse the AFP effects on CD1 family molecules, exposed DC were matured for 24 hours. Figure 1D shows that DC maturation did not reverse the AFP-induced reduction in expression, despite resulting in expected increases in other stimulatory molecules (CD80, CD83, HLA-ABC [3]).
3.4. Detection of NKT cells in PBMC of healthy donors
CD1d plays a critical role in lipid antigen presentation to NKT lymphocytes [7], and CD1d tetramers loaded with a CD1d ligand are commonly used to detect these cells [8]. Invariant NKT cells also express a distinct T cell receptor (Vα24-Jα18 α-chain co-expressed with Vβ11 TCR β-chain) [7] and monoclonal antibodies against Vα24-Jα18 α-chain can also be used to detect iNKT cells [9]. We used both methods to detect circulating NKT cell frequencies in the PBMC of 16 healthy donors. We observed a broad range of NKT cell frequencies among donors, from 0.00% (undetectable) to 0.3% of PBMC (Table 1). Both methods showed similar efficiency in NKT cell detection (Figure 2A), and the results obtained by these two methods were consistent (Figure 2B). Donors with higher frequencies of NKT cells were used for co-culture experiments.
Table 1.
NKT cell frequency in healthy donor PBMC as measured by Vα24 antibodies and CD1d tetramers
| Healthy donor | Vα24-Jα18+% | CD1d Tetramer+% |
|---|---|---|
| 1 | 0.011 | 0.005 |
| 2 | 0.023 | 0.018 |
| 3 | 0.034 | 0.031 |
| 4 | 0.250 | 0.283 |
| 5 | 0.066 | 0.073 |
| 6 | 0.004 | 0.002 |
| 7 | 0.039 | 0.058 |
| 8 | 0.049 | 0.049 |
| 9 | 0.089 | 0.109 |
| 10 | 0.055 | 0.060 |
| 11 | 0.002 | 0.002 |
| 12 | 0.054 | 0.046 |
| 13 | 0.035 | 0.035 |
| 14 | 0.045 | 0.058 |
| 15 | 0.002 | 0.002 |
| 16 | 0.031 | 0.037 |
Figure 2.
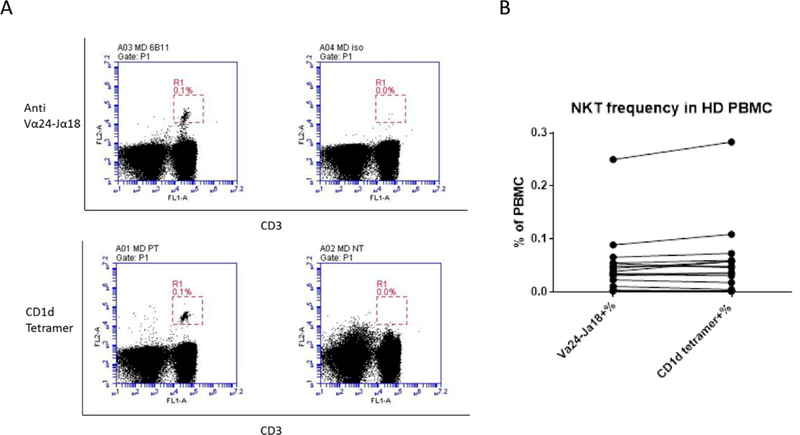
Detecting NKT cells in healthy donor PBMC with Vα24-Jα18 monoclonal antibodies and CD1d tetramers. A. Mouse anti human IgG1 antibody and unloaded CD1d tetramers were used as negative controls for non-specific binding. Left panel, Vα24-Jα18 antibody (top) and CD1d tetramers (bottom) loaded with PBS-57; right panel, mouse anti human IgG1 controls (top) and unloaded CD1d tetramers (bottom). Representative results from one donor is shown. B. NKT cell frequency in healthy donor PBMC is compared (n = 16 donors).
3.5. Activation of NKT cells using AFP-exposed DC pulsed with α-GalCer or β-GlcCer
To test the impact on NKT cell activation using the potently stimulatory CD1d ligand α-GalCer, DC were co-cultured with CD3+ T cells for 24 hours. T cells were examined for intracellular IFN-γ and IL-4 production in addition to expression of CD25 and CD69 activation markers by NKT cells (identified by staining with CD1d tetramers). To stimulate NKT cells, DC were pulsed with α-GalCer at 100ng/ml overnight prior to co-culture. Different DC:T cell ratios were tested (Figure 3 and data not shown) and PMA+ ionomycin was used as a strong positive control. Cytokine production was observed in all the tested DC:NKT cell ratios (Figure 3A) and a ratio of 1:5 was used for subsequent experiments.
Figure 3.
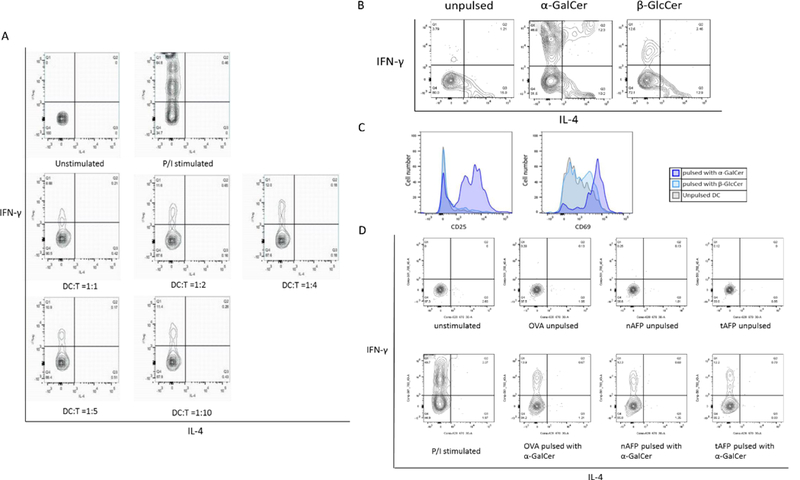
A. DC (pulsed with α-GalCer)-T co-culture ratio titration. The DC:T ratios tested were 1:1, 1:2, 1:4, 1:5 and 1: 10. At all ratios, cytokine production, (IFN-γ production) was observed in CD1d tetramer+ NKT cells. B. Cytokine production in NKT cells stimulated with α-GalCer or β-GlcCer. CD3+ T cells were co-cultured with DC pulsed with or without α-GalCer or β-GlcCer at 1: 5 ratios. α-GalCer induced 3–4 times more IFN-γ than β-GlcCer, while NKT cells co-cultured with unpulsed DC were used as a control for baseline stimulus. C. Up-regulation of CD25 and CD69 on NKT cells stimulated with α-GalCer or β-GlcCer. CD3+ cells were co-cultured with DC pulsed with or without α-GalCer or β- GlcCer at 1:5 ratio. NKT cells co-cultured with α-GalCer pulsed DC strongly upregulated CD25 and CD69, β-GlcCer had a weaker effect. D. Cytokine production of α-GalCer activated NKT cells. α-GalCer presented by DC treated with either OVA, nAFP or tAFP stimulated NKT cells and induced IL-4 and IFN-γ. OVA, nAFP and tAFP treated DC was pulsed with or without α-GalCer overnight before the co-culture. Representative result from one of five healthy donors are shown.
To confirm the NKT stimulatory activity of the NKT cell ligands α-GalCer and β-GlcCer, IFN-γ and IL-4 production in addition to expression of CD25 and CD69 were examined. Production of IFN-γ and IL-4 (Figure 3B) and up-regulation of CD25 and CD69 (Figure 3C) were observed indicating the activation of NKT cells by both ligand. As expected, α-GalCer pulsed DC induced more cytokine production and higher expression of CD25 and CD69 than β-GlcCer pulsed DC, confirming studies that show α-GalCer as the stronger CD1d ligand (Figure 3B).
3.6. Effect of OVA, nAFP or tAFP treated DC on activation of NKT cells
To test the NKT cell stimulatory ability of OVA, nAFP and tAFP treated DC, CD3+ cells were co-cultured with α-GalCer pulsed OVA-DC, nAFP-DC and tAFP-DC, and NKT cells were examined. Activation (CD25 and CD69) and cytokine production (IL-4 and IFN-γ) was tested, while T cells co-cultured with DC without α-GalCer ligand were used as a negative control, to exclude the possible indirect activation of NKT cells by DC (Figure 3D). No significant differences were observed in cytokine production or expression of activation markers in NKT cells stimulated with OVA, nAFP or tAFP-treated DC (Figure 4A-D). We hypothesized that α-GalCer might lead to potent activation of NKT cells regardless of the reduction in antigen presentation via CD1d. We titrated the concentration of α-GalCer down (1ng/mL, 5 ng/mL, 10 ng/mL, 20 ng/mL and 100 ng/mL) and observed induction of IFN-γ and IL-4 production even at the minimum concentration of 10 ng/mL (not shown).
Figure 4.
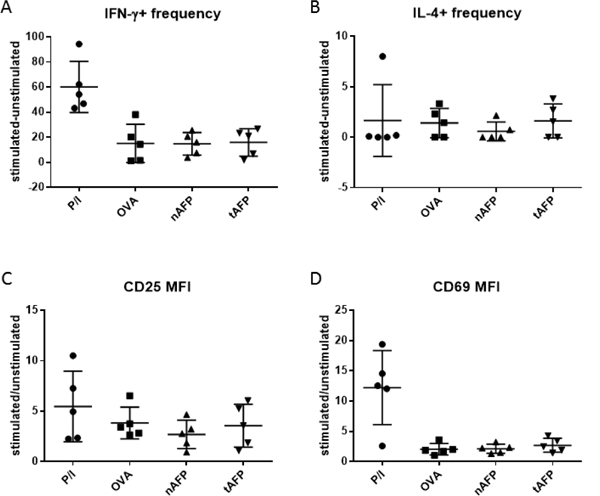
NKT stimulatory activity of OVA, nAFP, or tAFP treated DC. Different DC groups were tested for cytokine production and expression of activation markers. A. Frequency change of IFN-γ producing NKT cells after stimulation compared to unstimulated (i.e. frequency of IFN-γ + NKT cells stimulated with PMA and ionomycin or co-cultured with α-GalCer pulsed DC minus frequency of IFN-γ+ unstimulated NKT cells or NKT cells co-cultured with DC without α-GalCer). B. Frequency change of IL-4 producing NKT cells after stimulation compared to unstimulated. Any negative values are presented as zero. C. Fold change of CD25 MFI of NKT cells after stimulation compared to unstimulated (i.e. CD25 MFI of NKT cells stimulated with PMA and ionomycin or cocultured with α-GalCer pulsed DC divided by CD25 MFI of unstimulated NKT cells or NKT cells co-cultured with DC without α-GalCer). D. Fold change of CD69 MFI of NKT cells after stimulation compared to unstimulated.
3.7. Activation of NKT cells by OVA, nAFP or tAFP treated DC with β-GlcCer
We then tested NKT cell activation using DC pulsed with β-GlcCer to detect any defects in antigen presentation caused by reduced CD1d expressed [10]. Stimulation of NKT cells by β-GlcCer pulsed DC was weaker than that by α-GalCer (Figure 5) as expected. There was still no significant difference observed in NKT activation among OVA, nAFP and tAFP treated DC, as measured by intracellular staining for IL-4 and IFN-γ and analysis of CD25 and CD69 expression (Figure 5A-D).
Figure 5.
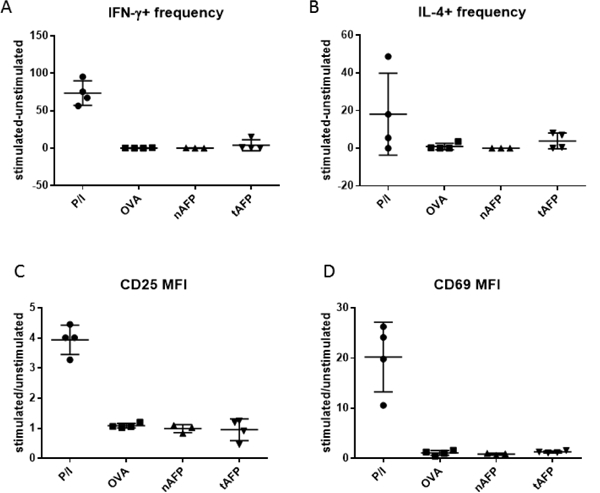
NKT stimulatory activity of OVA, nAFP, or tAFP treated DC pulsed with β-GlcCer. No significant difference was observed in NKT stimulation among different DC groups, regarding cytokine production. A. Frequency change of IFN- γ producing NKT cells after stimulation compared to unstimulated ones (i.e. frequency of IFN- γ+ NKT cells stimulated with PMA and ionomycin or co-cultured with β-GlcCer pulsed DC minus frequency of IFN- γ+ unstimulated NKT cells or NKT cells co-cultured with DC without β- GlcCer). B. Frequency change of IFN- γ producing NKT cells after stimulation compared to unstimulated ones. Any negative values are presented as zero. C. Fold change of CD25 MFI of NKT cells after stimulation compared to unstimulated. D. Fold change of CD69 MFI of NKT cells after stimulation compared to unstimulated ones.
3.8. Cytokine and chemokine production of NKT cells stimulated with AFP treated DC
Upon activation, NKT cells can produce a variety of cytokines and chemokines, including GM-CSF, IFN-γ, IL-4, IL-2, IL-10, IL-13, IL-17, TNF-α, RANTES (CCL5), Exotaxin (CCL11), MIP-1α (CCL3), and MIP-1β (CCL4) [11, 12]. To further study the possibility of changes in NKT cell activation after stimulation with AFP exposed DC, supernatants from DC-T co-culture were collected on day 7. The concentration of cytokines present in the supernatant were measured by Luminex. No statistically significant differences were observed between the different DC groups with either α-GalCer (Figure 6) or β-GLcCer (Figure 7) as the stimulus. There was overall less cytokine production using DC pulsed with β-GLcCer compared to DC pulsed with α-GalCer. There were differences detected that did not reach statistical significance: AFP (both nAFP and tAFP) increased the production of the inflammatory cytokine IL-17A and suppressive cytokine IL-10, while the production of the type 1 cytokine IFN-γ was reduced (Figure 6).
Figure 6.
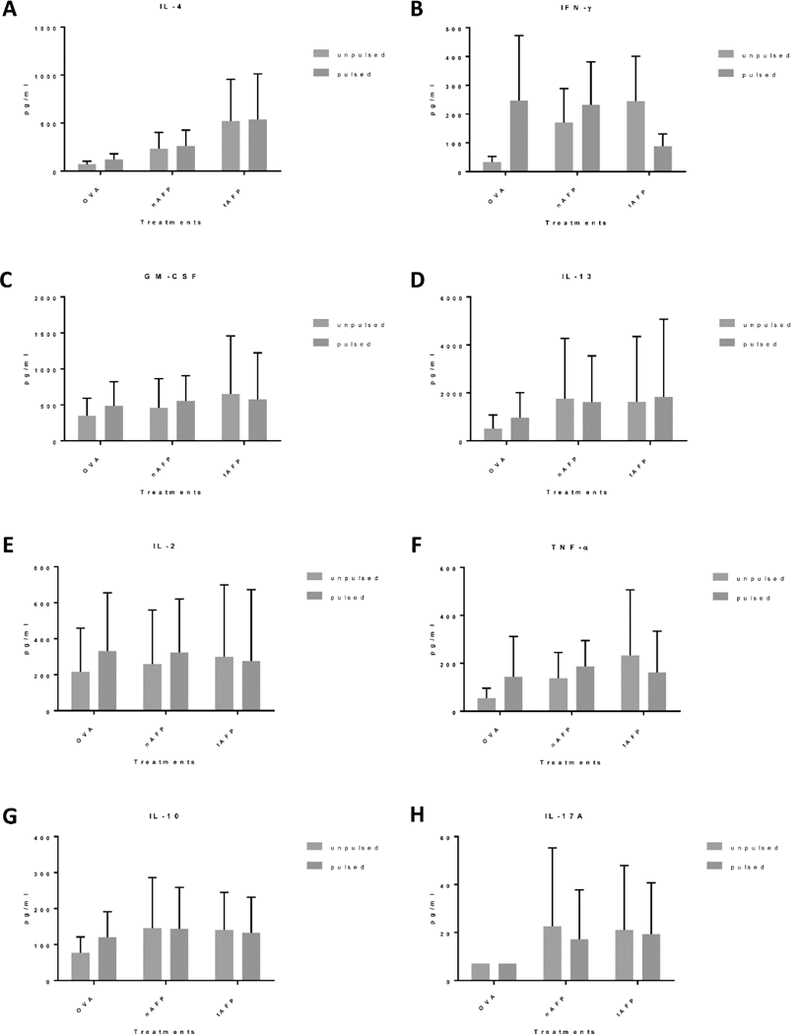
Cytokine production of co-cultured NKT cells (α-GalCer stimulated) Supernatants were collected from the DC-T co-culture on day 7 and analyzed using Luminex. There was no statistically significant difference between cytokine concentration of supernatants collected from total CD3+ T cells co-cultured with DC treated with OVA, nAFP or tAFP. A-H. Summary graphs of cytokine concentration in healthy donor DC-T cell coculture supernatants (n=5).
Figure 7.
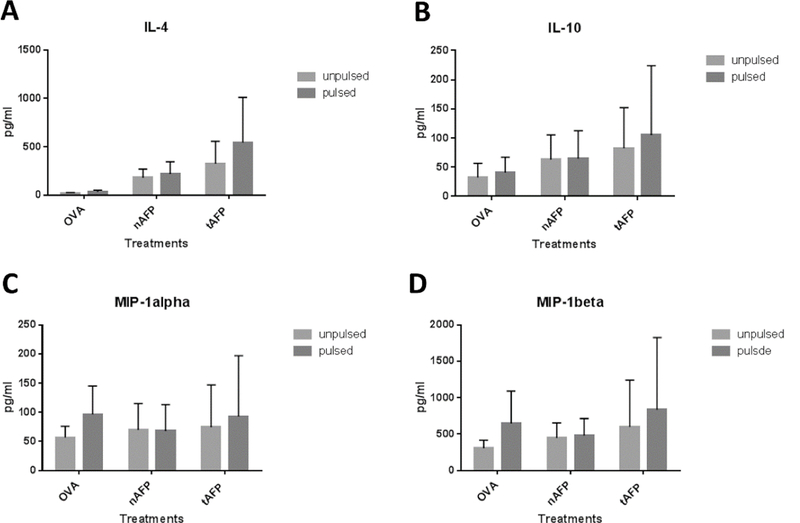
Cytokine productions of co-cultured NKT cells (β-GlcCer stimulated). Supernatants were collected from the DC-T co-culture (n=3) and were analyzed using Luminex. There was no statistically significant difference between cytokine concentration with DC treated with OVA, nAFP or tAFP. A-D. Summary graphs of IL-4, IL-10, MIP-1 α and MIP-1β.
4.0. DISCUSSION
Based on RNA microarray data for OVA, nAFP and tAFP treated DC, we examined the functional consequences of strongly reduced expression of CD1 family molecules, particularly CD1d, which plays a critical role in antigen presentation to NKT cells. We confirmed with flow cytometry that exposure to AFP (both nAFP and tAFP) led to down-regulation of CD1 family molecules, and that the down-regulation is not normalized by either washing out the AFP protein or by delivering a strong maturation signal (IFN-γ + LPS) to the DC. We further confirmed that the decrease of surface CD1d is not due to transient internalization. Considering its function in antigen presentation by DC to NKT cells, we hypothesized that this down-regulation of CD1d might have an effect on NKT cell antigen presentation and activity, however, no significant difference in NKT activation was observed. Supernatants from the DC-T cell co-culture were analyzed for cytokine production. The concentration of 12 different cytokines were measured and minor differences in IL-17, IL-10 and IFN-γ were detected.
A difficulty in studying primary human NKT cells is the rarity of these cells in the circulation. Only 5 of 15 screened healthy donors had circulating NKT cells (ranging from 0.08% of T cells to 0.3% of T cells) capable of direct ex vivo testing. Furthermore, it has been shown that the activity of NKT cells also varies substantially between donors [13].
It is also possible that the reduction in CD1d expression (a 50%−75% reduction in MFI) in DC was not sufficient to cause impaired NKT cell activation. It has been reported in mice that CD1d expression levels did not affect the development of NKT cells. Both CD1d+/− mice (where the level of CD1d is 50% that of wild type) and a CD1d-transgenic line where CD1d expression was driven by its own promoter at levels twice above wild-type exhibited normal NKT cell frequencies in mice [14]. Furthermore, it was reported that plasma membrane lipid rafts also play an important part in antigen presentation by CD1d to NKT cells [15, 16]. With confocal microscopy, stimulated emission depletion (STED) microscopy and other super-power-imaging technologies, the link between the spatial organization of CD1d molecules on the cell membrane of APCs and the activation profile of NKT cells was shown [17]. Further studies show that the CD1d molecules form nanoclusters, and that the density and area of the clusters were fine-tuned by APC via actin cytoskeleton [18]. The actin cytoskeleton restricts the lateral diffusion of transmembrane CD1d by creating temporal physical barriers close to the cell membrane, locally confining membrane receptors, increasing their local concentration and promoting clustering but also preventing long-range hCD1d nanoclustering by lowering the encountering probability of distant diffusing hCD1d nanoclusters. Disruption of actin could lead to formation of larger clusters and more effectively activates NKT cells. AFP-treated DC also had their actin skeleton disrupted when compared to OVA DC [3]. Hence the possible disruption of actin in AFP treated cells might compensate for the impaired NKT stimulation caused by CD1d down-regulation.
We observed that AFP treated DC have a detectable baseline NKT stimulatory activity without exogenous antigen pulsing, and that this baseline activity is stronger than that of OVA-DC (3 of 5 donors had higher level of NKT stimulation by AFP treated unpulsed DC). Previous studies from our groups showed that some of the immune suppressive effects by AFP were caused by a low molecular mass (LMM) binding partner [3]. It is conceivable that the LMM binding partner of AFP could also be a lipidic antigen for NKT cells. AFP treatment to DC might result in the binding of the LMM partner by CD1d molecules, thus leading to excess activation of NKT cells. It was reported that lysophosphatidic acid (LPA) could cause the down-regulation of CD1 family molecules on DC [19], and lysophosphatidylcholine (LPC) was reported to bind to CD1d molecules and stimulate NKT cells [20]. LPC can be converted into LPA by autotaxin, a lysophospholipase D. These possibilities are under current investigation.
4.1. Conclusions
AFP significantly and irreversibly reduces CD1a, b, c and d expression by human monocyte-derived DC. The reduced level of expression did not significantly impact NKT cell activation or expression of IFNγ and IL-4 by NKT cells.
Highlights.
AFP reduces CD1a, b, c and d molecules on DC
CD1 molecule reductions cannot be reversed by AFP removal or DC maturation
NKT cell function was not impaired by AFP-exposed DC
Acknowledgements
This study used the Immunologic Monitoring and Cellular Products Laboratory (IMCPL) Core Facility of the UPMC Hillman Cancer Center (Mary Jo Buffo, Jennifer Muzzio, Misty DeRiggi, Sharon Sember, Sylvia Shrader-Thomas and Kathy Whelan), supported in part by NIH award #P30 CA047904. This research was also supported by Skin Cancer SPORE (NIH Grant #P50 CA121973, JM Kirkwood, PI). CL was supported by the Chinese Scholar Council (CSC). CD1d tetramers were provided by the NIH Tetramer Core Facility, supported by contract HHSN272201300006C from the National Institute of Allergy and Infectious Diseases, a component of the National Institutes of Health in the Department of Health and Human Services. We thank Dr. Louise D’Cruz for her helpful advice on NKT cell experiments.
Abbreviations
- NK
natural killer
- APC
antigen presenting cells
- HCC
hepatocellular carcinoma
- AFP
alpha-fetoprotein
- nAFP
normal AFP
- tAFP
tumor AFP
- DC
dendritic cell
- IL
interleukin
- TNF-α
tumor necrosis factor-alpha
- IFN
interferon
- α-GalCer
α -galactocylceramide
- MHC
major histocompatibility complex
- iNKT
invariant natural killer T cells
- PBMC
peripheral blood mononuclear cells
- TLR
Toll-like receptor
- TCR
T cell receptor
- GM-CSF
granulocyte-macrophage colony stimulatory factor
- ELISpot
enzyme-linked immunospot
Footnotes
Conflict of Interest
The authors report no conflicts of interest.
Publisher's Disclaimer: This is a PDF file of an unedited manuscript that has been accepted for publication. As a service to our customers we are providing this early version of the manuscript. The manuscript will undergo copyediting, typesetting, and review of the resulting proof before it is published in its final citable form. Please note that during the production process errors may be discovered which could affect the content, and all legal disclaimers that apply to the journal pertain.
References
- [1].Ferlay J, Soerjomataram I, Dikshit R, Eser S, Mathers C, Rebelo M, Parkin DM, Forman D, Bray F, Cancer incidence and mortality worldwide: sources, methods and major patterns in GLOBOCAN 2012, Int J Cancer, 136 (2015) E359–386. [DOI] [PubMed] [Google Scholar]
- [2].Debruyne EN, Delanghe JR, Diagnosing and monitoring hepatocellular carcinoma with alpha-fetoprotein: new aspects and applications, Clin Chim Acta, 395 (2008) 19–26. [DOI] [PubMed] [Google Scholar]
- [3].Pardee AD, Shi J, Butterfield LH, Tumor-derived alpha-fetoprotein impairs the differentiation and T cell stimulatory activity of human dendritic cells, J Immunol, 193 (2014) 5723–5732. [DOI] [PMC free article] [PubMed] [Google Scholar]
- [4].Vujanovic L, Stahl EC, Pardee AD, Geller DA, Tsung A, Watkins SC, Gibson GA, Storkus WJ, Butterfield LH, Tumor-Derived alpha-Fetoprotein Directly Drives Human Natural Killer-Cell Activation and Subsequent Cell Death, Cancer Immunol Res, 5 (2017) 493–502. [DOI] [PubMed] [Google Scholar]
- [5].McEwen-Smith RM, Salio M, Cerundolo V, The regulatory role of invariant NKT cells in tumor immunity, Cancer Immunol Res, 3 (2015) 425–435. [DOI] [PMC free article] [PubMed] [Google Scholar]
- [6].Lee WY, Moriarty TJ, Wong CH, Zhou H, Strieter RM, van Rooijen N, Chaconas G, Kubes P, An intravascular immune response to Borrelia burgdorferi involves Kupffer cells and iNKT cells, Nat Immunol, 11 (2010) 295–302. [DOI] [PMC free article] [PubMed] [Google Scholar]
- [7].Bendelac A, Savage PB, Teyton L, The biology of NKT cells, Annu Rev Immunol, 25 (2007) 297–336. [DOI] [PubMed] [Google Scholar]
- [8].Sharma AA, Chew L, Ladd M, Jen R, Lavoie PM, Ex vivo purification and characterization of human invariant Natural Killer T cells, J Immunol Methods, 373 (2011) 1–7. [DOI] [PMC free article] [PubMed] [Google Scholar]
- [9].Berzins SP, Smyth MJ, Godfrey DI, Working with NKT cells—pitfalls and practicalities, Curr Opin Immunol, 17 (2005) 448–454. [DOI] [PubMed] [Google Scholar]
- [10].Brennan PJ, Tatituri RV, Brigl M, Kim EY, Tuli A, Sanderson JP, Gadola SD, Hsu F, Besra GS, Brenner MB, Invariant natural killer T cells recognize lipid self antigen induced by microbial danger signals, Nat Immunol, 12 (2011) 1202–1211. [DOI] [PMC free article] [PubMed] [Google Scholar]
- [11].Gumperz JE, Miyake S, Yamamura T, Brenner MB, Functionally distinct subsets of CD1d-restricted natural killer T cells revealed by CD1d tetramer staining, J Exp Med, 195 (2002) 625–636. [DOI] [PMC free article] [PubMed] [Google Scholar]
- [12].Lee PT, Benlagha K, Teyton L, Bendelac A, Distinct functional lineages of human V(alpha)24 natural killer T cells, J Exp Med, 195 (2002) 637–641. [DOI] [PMC free article] [PubMed] [Google Scholar]
- [13].Fujii S, Shimizu K, Steinman RM, Dhodapkar MV, Detection and activation of human Valpha24+ natural killer T cells using alpha-galactosyl ceramide-pulsed dendritic cells, J Immunol Methods, 272 (2003) 147–159. [DOI] [PubMed] [Google Scholar]
- [14].Forestier C, Park SH, Wei D, Benlagha K, Teyton L, Bendelac A, T cell development in mice expressing CD1d directed by a classical MHC class II promoter, J Immunol, 171 (2003) 4096–4104. [DOI] [PubMed] [Google Scholar]
- [15].Lang GA, Maltsev SD, Besra GS, Lang ML, Presentation of alpha- galactosylceramide by murine CD1d to natural killer T cells is facilitated by plasma membrane glycolipid rafts, Immunology, 112 (2004) 386–396. [DOI] [PMC free article] [PubMed] [Google Scholar]
- [16].Park YK, Lee JW, Ko YG, Hong S, Park SH, Lipid rafts are required for efficient signal transduction by CD1d, Biochem Biophys Res Commun, 327 (2005) 1143–1154. [DOI] [PubMed] [Google Scholar]
- [17].Im JS, Arora P, Bricard G, Molano A, Venkataswamy MM, Baine I, Jerud ES, Goldberg MF, Baena A, Yu KO, Ndonye RM, Howell AR, Yuan W, Cresswell P, Chang YT, Illarionov PA, Besra GS, Porcelli SA, Kinetics and cellular site of glycolipid loading control the outcome of natural killer T cell activation, Immunity, 30 (2009) 888–898. [DOI] [PMC free article] [PubMed] [Google Scholar]
- [18].Torreno-Pina JA, Manzo C, Salio M, Aichinger MC, Oddone A, Lakadamyali M, Shepherd D, Besra GS, Cerundolo V, Garcia-Parajo MF, The actin cytoskeleton modulates the activation of iNKT cells by segregating CD1d nanoclusters on antigen- presenting cells, Proc Natl Acad Sci U S A, 113 (2016) E772–781. [DOI] [PMC free article] [PubMed] [Google Scholar]
- [19].Leslie DS, Dascher CC, Cembrola K, Townes MA, Hava DL, Hugendubler LC, Mueller E, Fox L, Roura-Mir C, Moody DB, Vincent MS, Gumperz JE, Illarionov PA, Besra GS, Reynolds CG, Brenner MB, Serum lipids regulate dendritic cell CD1 expression and function, Immunology, 125 (2008) 289–301. [DOI] [PMC free article] [PubMed] [Google Scholar]
- [20].Fox LM, Cox DG, Lockridge JL, Wang X, Chen X, Scharf L, Trott DL, Ndonye RM, Veerapen N, Besra GS, Howell AR, Cook ME, Adams EJ, Hildebrand WH, Gumperz JE, Recognition of lyso-phospholipids by human natural killer T lymphocytes, PLoS Biol, 7 (2009) e1000228. [DOI] [PMC free article] [PubMed] [Google Scholar]


