

Summary
Transcriptional regulation occurs via changes to rates of different biochemical steps of transcription, but it remains unclear which rates are subject to change upon biological perturbation. Biochemical studies have suggested that stimuli predominantly affect the rates of RNA polymerase II (Pol II) recruitment and polymerase release from promoter-proximal pausing. Single cell studies revealed that transcription occurs in discontinuous bursts, suggesting that features of such bursts like frequency and intensity could also be regulated. We combined Pol II ChIP-seq and single cell transcriptional measurements to show that an independently regulated burst initiation step is required before polymerase recruitment can occur. Using a number of global and targeted transcriptional regulatory perturbations, we showed that biological perturbations regulated both burst initiation and polymerase pause release rates, but seemed not to regulate polymerase recruitment rate. Our results suggest that transcriptional regulation primarily acts by changing the rates of burst initiation and polymerase pause release.
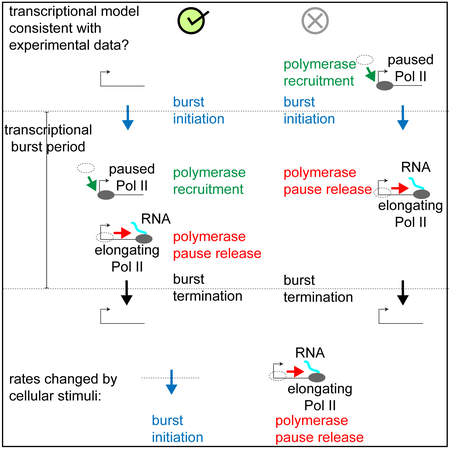
Graphical Abstract
EToC Blurb
Mammalian genes are transcribed in discontinuous bursts. Using experimental data and computational modeling, Bartman et al. show that the key control points of transcriptional regulation are burst initiation and the release of RNA polymerase II from a paused state, but unexpectedly, not polymerase recruitment rate.
Introduction
Transcription of RNA is a highly regulated process, and many cellular responses manifest as changes in the overall rate of transcription, meaning the number of RNAs produced per unit time. Transcriptional regulation involves several distinct steps, and it remains unclear which of these steps are targets of regulation. Studies using chiefly population-averaging biochemical assays have suggested that transcriptional regulation primarily affects two such steps: RNA polymerase II (Pol II) recruitment to a gene’s promoter and the release of Pol II from promoter-proximal pausing (Levine et al. 2014; Jonkers & Lis 2015; Hager et al. 2009; Juven-Gershon et al. 2008; Goodrich & Tjian 2010; Core et al. 2008; Core & Lis 2008; Guenther et al. 2007; Muse et al. 2007; Henriques et al. 2013). Both polymerase recruitment and polymerase pause release are required to produce RNA, and studies have extensively characterized the proteins involved in both processes. Single cell studies have, however, complicated this view of transcriptional regulation by revealing that genes fluctuate between transcriptionally active and inactive states in a phenomenon known as transcriptional bursting, and that the rates of these transitions (burst initiation and burst termination) may also be subject to regulation (Raj et al. 2006; Zenklusen et al. 2008; Suter et al. 2011; Chubb et al. 2006; Bahar Halpern et al. 2015; Lionnet et al. 2011; Coleman et al. 2015; Golding et al. 2005; Dar et al. 2012; Senecal et al. 2014; Kalo et al. 2015; Bartman et al. 2016). Transitions between the transcriptionally active and inactive states are typically slower than the time required for polymerase recruitment and polymerase pause release (hours vs. tens of minutes) (Henriques et al. 2013; Cisse et al. 2013; Cho et al. 2016; Coulon et al. 2013; Jonkers et al. 2014; Tantale et al. 2016). Thus, changes to the rates of burst initiation and burst termination could regulate transcriptional activity by forming an independent, slower layer of transcriptional regulation compared to polymerase recruitment and pause release. It remains unclear whether the initiation of a burst permits polymerase recruitment to occur, or whether it permits release from the paused state (Shao & Zeitlinger 2017).
It has been difficult to distinguish between these possibilities in part because single cell and population-averaging biochemical measures of transcription give different types of information. Nascent transcript RNA FISH uses probes specific to introns of a gene of interest to measure transcription of that gene in single cells, thus measuring average changes in burst frequency and amplitude (Femino et al. 1998; Raj et al. 2006; Fremeau et al. 1986). In contrast, biochemical methods like Pol II ChIP-seq measures average changes in polymerase occupancy and pause release (Churchman & Weissman 2011; Core et al. 2008; Kwak et al. 2013; Winter et al. 2017; Rahl et al. 2010; Henriques et al. 2013)). We hypothesized that combining these methods to simultaneously measure changes in bursting properties as well as polymerase occupancy and pause release should allow us to clarify whether either polymerase recruitment only occurs during bursts or polymerase pause release only occurs during bursts, and, furthermore, which of those rates are the targets of biological regulation.
We first constructed several possible models of transcription that incorporated steps associated with bursting (burst initiation and termination) together with polymerase recruitment and pause release steps. Comparing frameworks in which burst initiation permits polymerase to bind ("polymerase recruitment only occurs during bursts") or in which burst initiation permits release of bound polymerases ("polymerase pause release only occurs during bursts"), each made distinct predictions for how nascent transcript RNA FISH and Pol II ChIP-seq measurements should change in response to transcriptional perturbations. Measuring the effects of a number of global and gene-specific perturbations via nascent transcript RNA FISH and Pol II ChIP-seq revealed that polymerase recruitment can only occur after a burst is initiated, excluding the possibility that burst initiation permits pause release of pre-bound polymerase. We then used the "polymerase recruitment only occurs during bursts" model of transcription to show that alteration of burst initiation and polymerase pause release rates accounted for the majority of changes in the overall rate of transcription. In contrast to what was previously expected (Juven-Gershon et al. 2008; Goodrich & Tjian 2010), most perturbations that we examined seemed not to greatly change the rate of polymerase recruitment. Our study supports a model of transcription in which polymerase recruitment only occurs during bursts and implicates transcriptional burst initiation and polymerase pause release as critical control points in transcriptional regulation.
Results
Identifying the regulated steps of transcription requires selection of a model of transcription
To ultimately identify which steps of transcription are regulated by complex biological perturbations, we first clarified how transcriptional bursting regulation fits together with polymerase recruitment and pause release regulation. We built quantitative models of transcription, each with a different configuration of the processes of burst initiation, polymerase recruitment, and pause release (Figure 1A). For each model, we used simulations to predict the experimental outcome for changing the rates of each transcriptional step. We hypothesized that changing different rates would lead to distinct experimental changes, ultimately allowing us to determine which rates changed in complex biological perturbations. A key feature of our models was that transcription occurred in a burst-like pattern (given that all genes we have examined show this behavior, Supplementary Figure 1A). In one model, the “on” period of the transcriptional burst dictates when polymerase can be recruited ("polymerase recruitment only occurs during bursts") (Figure 1A-B). In the other model, polymerase recruitment could happen any time, irrespective of whether the gene is active or not, and instead it is pause release that only occurs during “on” periods ("polymerase pause release only occurs during bursts") (Figure 1A-B).
Figure 1. Combining RNA FISH and Pol II ChIP-seq reveals that polymerase recruitment only occurs during bursts.

a. Structure of the "polymerase recruitment only occurs during bursts" model and the "polymerase pause release only occurs during bursts" model.
b. Model predictions for how changing individual transcriptional rates should change nascent transcript RNA FISH and Pol II ChIP-seq measurements.
c. Schematics of nascent transcript RNA FISH and Pol II ChIP-seq.
d. Top, representative images from nascent transcript RNA FISH and Pol II ChIP-seq after 60 minutes 100nM flavopiridol treatment of G1E-ER4 cells that had been differentiated for 24 hours with 100nM estradiol to stabilize the GATA1-ER fusion protein expressed by the cells. RNA FISH channel contrast equal in both images. Bottom, data summarizing nascent transcript RNA FISH and Pol II ChIP-seq after 0,10,100, or 1000 nM flavopiridol treatment for 60 minutes of G1E-ER4 cells that had been differentiated for 24 hours with 100nM estradiol to stabilize the GATA1-ER fusion protein expressed by the cells. n=3 biological replicates of nascent transcript RNA FISH (49-172 cells per gene per treatment per replicate, error bars display SEM) and n=3 biological replicates of Pol II ChIP-seq. Transcription sites per cell was measured by counting mean transcription sites, transcription site intensity was calculated as the mean fluorescence intensity of those sites calculated by 2D Gaussian fitting, and Pol II traveling ratio was calculated as (the Pol II density from the gene end to 1500bp past the gene end) divided by (the Pol II density 750 bp upstream to 750 bp downstream of the transcription start site) (effects robust to choice of 3’ region; Supplementary Figure 1F). ChIP-seq data for ‘selected genes’ represents data for 5 genes corresponding to RNA FISH experiments (Hbb-b1, Prdx2, Slc25a37, Slc4a1, and Tal1) and “all genes” represents 1416 genes still transcribed after drug treatment.
e. Nascent transcript RNA FISH and Pol II ChIP-seq after 0 or 300 nM triptolide was applied for 60 minutes to G1E-ER4 cells that had been differentiated for 24 hours with 100nM estradiol. n=3 biological replicates of nascent transcript RNA FISH (81-202 cells per gene per treatment per replicate, error bars display SEM) and n=3 biological replicates of Pol II ChIP-seq. ChIP-seq data for ‘selected genes’ represents data for 5 genes corresponding to FISH experiments (Hbb-b1, Prdx2, Slc25a37, Slc4a1, and Tal1) and all genes represents 1416 genes still transcribed after drug treatment.
f. Nascent transcript RNA FISH and Pol II ChIP-qPCR after overexpression of looping factor or GFP-expressing empty vector control in G1E-ER4 cells that had been differentiated for 9 hours with 100nM estradiol. n=3 biological replicates of nascent transcript RNA FISH (124-249 cells per treatment per replicate) and n=3 replicates of Pol II ChIP-qPCR. For this figure subsection, traveling ratio was calculated as (input-normalized ChIP-qPCR signal from the 3’ gene region) divided by (input-normalized ChIP-qPCR signal from the transcription start site region). See also Supplementary Figure 1, 2, 3, and 6.
To determine the experimental predictions of these two models of transcriptional regulation, we used Gillespie stochastic simulations of the model framework, including steps of burst initiation, polymerase recruitment, polymerase pause release, and burst termination (Gillespie 1976). Importantly, in each model only one polymerase is permitted to bind each promoter-proximal region at a time, and this bound polymerase has to undergo pause release before a second polymerase can be recruited to a gene copy (Shao & Zeitlinger 2017; Gressel et al. 2017). We then used the molecular events occurring over time in each set of simulations to predict the resulting Pol II ChIP-seq and nascent transcript RNA FISH outcomes as follows. The mean polymerase recruitment along all gene copies was averaged to create a simulated Pol II ChIP-seq profile. We used this predicted Pol II ChIP-seq profile to calculate the Pol II traveling ratio (the ratio between gene body and promoter-proximal polymerase), which has been used to measure changes in pause release rate (although we note that experimentally, promoter-proximal Pol II includes both paused and early-transcribing polymerase) (Churchman & Weissman 2011; Core et al. 2008; Kwak et al. 2013; Winter et al. 2017; Rahl et al. 2010; Henriques et al. 2013). Next, we used the number of polymerases that underwent pause release and were actively transcribing nascent RNA to predict measurements from nascent transcript RNA FISH, a method that measures recent transcription in single cells using fluorescent probes specific to introns (Figure 1C, Supplementary Figure 1B). Nascent transcript RNA FISH probes bind to nascent RNA to create a fluorescent spot near a gene’s location in the nucleus (a ‘transcription site’) if a gene has transcribed recently (Figure 1C). We predicted the average number of active transcription sites per cell (the proportion of gene copies active at a time) and the mean transcription site fluorescence intensity (the average number of RNAs recently transcribed by a single gene copy). By changing the value of each rate parameter one at a time in the simulations (Supplementary Figure 3E), we predicted how changing specific rates of transcriptional steps would change both Pol II ChIP-seq (population) and nascent transcript RNA FISH (single cell) measurements of transcription.
In this way, we predicted the effects of changing specific rates on the fold change in experimental measurements for both models of transcriptional regulation (Figure 1B, Supplementary Figures 2A, 6; see Supplementary Figure 3 for other models examined). For each model, changes to the rates of burst initiation, polymerase recruitment, or pause release each resulted in a distinct signature of experimental outcomes. Moreover, these signatures revealed a critical distinction between the two models: altering the burst initiation rate would change the Pol II traveling ratio in the "polymerase pause release only occurs during bursts" model but not in the "polymerase recruitment only occurs during bursts" model.
Combining nascent transcript RNA FISH and Pol II ChIP-seq reveals that polymerase recruitment only occurs during bursts
While our simulations predicted that altering burst initiation rate would discriminate between the models via differences in Pol II traveling ratio, it also made predictions for the result of perturbing the rates of polymerase pause release and polymerase recruitment, which we wanted to verify first (Figure 1B). To decrease the rate of polymerase pause release, we used flavopiridol to inhibit the p-TEFb kinase complex (Jonkers et al. 2014; Henriques et al. 2013; Zhou et al. 2012). Both the "polymerase recruitment only occurs during bursts" and "polymerase pause release only occurs during bursts" models predicted that all transcriptional measures should decrease: transcription sites per cell and transcription site intensity measured by nascent transcript RNA FISH, and Pol II traveling ratio measured by Pol II ChIP-seq (Figure 1A-B). Intuitively, if pause release occurred less frequently, a gene would be associated with nascent RNA for a lower fraction of the time (less transcription sites per cell), each transcription site would contain fewer RNA molecules (lower transcription site intensity), and Pol II would be released into the gene body less frequently (lower Pol II traveling ratio). As predicted by both models, all three measures decreased (Figure 1D, Supplementary Figure 6E). Pol II traveling ratio was calculated using genes that maintained detectable Pol II occupancy after drug treatment (gene properties shown in Supplementary Figure 1C) and was robust to choice of 3’ Pol II binding region (Supplementary Figure 1F). (Importantly, we used intermediate drug doses and measured transcription after 60 minutes, thus measuring a new steady state of transcription with a reduced pause release rate in contrast to some previous studies (Jonkers et al. 2014).)
Our data was also not consistent with the commonly used telegraph model of transcription (Figure 1D, Supplementary Figure 3A). The telegraph model does not include an independently regulated pause release step, and so cannot distinguish the effects of changing polymerase pause release versus polymerase recruitment rates (Raj et al. 2006; Suter et al. 2011; Peccoud & Ycart 1995; Larson et al. 2013).
We next reduced the polymerase recruitment rate with triptolide, which inhibits the helicase activity of TFIIH (Jonkers et al. 2014; Henriques et al. 2013; Titov et al. 2011; Vispé et al. 2009; Bensaude - Transcription & 2011 2011). Both the "polymerase recruitment only occurs during bursts" and the "polymerase pause release only occurs during bursts" models predicted that reducing polymerase recruitment rate would reduce transcription sites per cell and transcription site intensity, but unlike reducing the pause release rate, would leave Pol II traveling ratio unchanged. (The reason that transcription sites per cell should decrease is because even when the gene is active, the percentage of that time during which there is a nascent transcript from an active polymerase would be less as the polymerase recruitment rate decreased.) As predicted, 60 minute triptolide treatment decreased both the transcription sites per cell and the transcription site intensity in G1E-ER4 cells while leaving the Pol II traveling ratio unchanged (Figure 1E, Supplementary Figure 1D, Supplementary Figure 6F). Importantly, we used a low dose of drug and a later time point than some previous studies, in order to measure the new transcriptional steady state, and indeed we saw no Pol II enrichment at the 3’ end of genes (Supplementary Figure 6F) (Jonkers et al. 2014). These results matched the predictions of the two models and confirmed that we could experimentally distinguish changes in polymerase recruitment rate from changes in polymerase pause release rate (Figure 1D-E).
Then, to distinguish between the "polymerase recruitment only occurs during bursts" or the "polymerase pause release only occurs during bursts" model (Figure 1B), we sought to change the burst initiation rate. Both models predicted that changing burst initiation should change transcription sites per cell and should not change transcription site intensity but they disagreed on the effect on Pol II traveling ratio. The "polymerase recruitment only occurs during bursts" model predicted no change in Pol II traveling ratio, while the "polymerase pause release only occurs during bursts" model predicted that increasing burst initiation should also increase the Pol II traveling ratio (Figure 1B). The molecular underpinnings of burst initiation are unclear, and there is no known pharmacological inhibitor of this transcriptional step. However, we previously showed that increasing enhancer-promoter contact for the Hbb-b1 gene using a synthetic looping factor increased transcription sites per cell without changing transcription site intensity (Bartman et al. 2016). Both models predicted that such a result could only occur if forced enhancer-promoter looping changed the burst initiation rate. Therefore, we expressed the looping factor to see whether the Pol II traveling ratio changed or remained constant. We found that increasing promoter-enhancer contact did not alter the Pol II traveling ratio for Hbb-b1, suggesting that burst initiation was required for polymerase recruitment rather than pause release (the "polymerase recruitment only occurs during bursts" model, Figure 1B) for this gene. A caveat of the looping factor experiment was that we could only modulate burst initiation for one gene, but in Figure 2A we will show that erythroid differentiation changed burst initiation rate for the housekeeping gene Prdx2 in addition to Hbb-b1, arguing for the generality of this model. In sum, the "polymerase recruitment only occurs during bursts" model was most consistent with our data from the perturbation of three steps of transcription, providing a set of predictions we will subsequently use to identify transcriptional steps changed by complex perturbations. We concluded that burst initiation must take place before polymerase recruitment, since the effect of increasing burst initiation with the looping factor is not consistent with a model where polymerase recruitment can take place before burst initiation (comparing Figure 1F to the right-hand model in Figure 1B).
Figure 2. Erythroid differentiation changes both burst initiation and polymerase pause release rates.

a. Nascent transcript RNA FISH and Pol II ChIP-seq after 4 hours of differentiation with 100nM estradiol of G1E-ER4 cells for Hbb-b1 and Prdx2 genes. n=3 biological replicates of nascent transcript RNA FISH (274-534 cells per gene per treatment per replicate), n=2 biological replicates of Pol II ChIP-seq.
b. Nascent transcript RNA FISH and Pol II ChIP-seq after 13 hours of erythroid differentiation with 100nM estradiol of G1E-ER4 cells for Hbb-b1 and Prdx2 genes, n=3 biological replicates of nascent transcript RNA FISH (84-665 cells per gene per treatment per replicate) and n=3 replicates of Pol II ChIP-seq.
We also evaluated several other possible model structures, but none were more consistent with our experimental data than the "polymerase recruitment only occurs during bursts" model (Supplementary Figure 3B-D). A model in which only polymerase recruitment and pause release rates could be regulated (Supplementary Figure 3B) was inconsistent with the experimental data in Figure 1F because it did not allow transcription sites per cell to change independently of changes in transcription site intensity and Pol II traveling ratio. Modifying the "polymerase recruitment only occurs during bursts" model to allow polymerases to drop off from the pause site before undergoing elongation (Supplementary Figure 3D) (Henriques et al. 2013; Wagschal et al. 2012) did not change any model predictions. In line with some live imaging studies (Suter et al. 2011; Larson et al. 2013), in another model variant we included a refractory period of transcriptional silence occurred after each burst (Supplementary Figure 3C). This model predicted that modulating the rate of escape from the refractory period would change transcription sites per cell but would not change transcription site intensity or Pol II traveling ratio, similar to the experimental result in Figure 1F. Thus, our data cannot distinguish a potential refractory period escape rate from regular burst initiation. It is thus important to note that our conclusions about burst initiation may equally well refer to escape from the refractory period.
Erythroid differentiation changes both burst initiation and polymerase pause release rates
Having established the "polymerase recruitment only occurs during bursts" model, we next sought to apply this model to identify which steps of transcription are regulated in more complex biological perturbations. First, we differentiated G1E-ER4 erythroid cells (Weiss et al. 1997) and performed both nascent transcript RNA FISH and Pol II ChIP-seq at several time points during differentiation. We expected that a complex biological process like erythroid differentiation would be associated with changes to multiple steps of transcription, so first we looked for genes where we could conclusively identify changes to the rates of individual steps of transcription.
Early in differentiation (4 hours) both the Hbb-b1 gene, encoding an erythroid-specific subunit of hemoglobin, and the Prdx2 gene, encoding a broadly-expressed antioxidant enzyme, had increased transcription sites per cell while their transcription site intensities and Pol II traveling ratios were unchanged (Figure 2A). According to the "polymerase recruitment only occurs during bursts" model, only a change in burst initiation could change transcription sites per cell without altering transcription site intensity or Pol II traveling ratio. Thus, we concluded that early erythroid differentiation specifically changes burst initiation for these genes. (Moreover, these data provided further evidence against the "polymerase pause release only occurs during bursts" model, in which transcription sites per cell cannot be changed without also changing either Pol II traveling ratio or transcription site intensity, Figure 1B.)
After 13 hours of differentiation, Hbb-b1 and Prdx2 had increased transcription sites per cell, transcription site intensity, and Pol II traveling ratio, making it impossible to isolate one specific rate as having changed (Figure 2B). In our model, only a change in polymerase pause release rate could change Pol II traveling ratio, so at least polymerase pause release rate changed for these genes. However, changing either polymerase recruitment rate or burst initiation (in addition to pause release rate) could lead to the increases in all three experimental measures, making further discrimination impossible.
Combined modeling and experimentation suggests that erythroid differentiation does not greatly change polymerase recruitment rate
While the qualitative predictions of the “polymerase recruitment only occurs during bursts” model were ambiguous for many genes upon erythroid differentiation, the model also predicted how rate changes could affect the quantitative relationship between changes in nascent transcript RNA FISH and Pol II ChIP-seq. These quantitative relationships had characteristic signatures for simultaneous changes to particular combinations of rates; thus, by measuring the quantitative relationships across many genes, we could statistically identify which combination of rates were most likely changing amongst all the genes in the group.
Consider the relationship between transcription site intensity and Pol II traveling ratio changes (Figure 3A). Each point represents changes in these measurements predicted from increasing or decreasing the indicated rates over a 1000 fold range of values. Changes to polymerase pause release rate led to correlated changes in both Pol II traveling ratio and transcription site intensity. In contrast, a change in polymerase recruitment rate would change transcription site intensity but not change Pol II traveling ratio, resulting in a vertical line relationship. (Changing burst termination rate led to a similar outcome; Supplementary Figure 4A.) Finally, changing the rate of burst initiation rate resulted in minimal changes to transcription site intensity nor Pol II traveling ratio.
Figure 3. Combining modeling and experimentation suggests that erythroid differentiation does not greatly change polymerase recruitment rate.

a. Predictions of the “polymerase recruitment only occurs during bursts” model for how changing one or multiple rates of transcription should change transcription site intensity and Pol II traveling ratio. Indicated rates were changed up and down from intermediates over a 1000-fold range.
b. Fold change in transcription site intensity and Pol II traveling ratio for 7 genes after 13 hours of differentiation with 100nM estradiol of G1E-ER4 cells, n=3 biological replicates each of nascent transcript RNA FISH (84-665 cells per gene per treatment per replicate) and n=3 biological replicates of Pol II ChIP-seq. Error bars display SEM. See also Supplementary Figure 3 and 4.
Similarly, the model predicted that changes in different combinations of rates would result in distinct quantitative relationships between transcription site intensity and Pol II traveling ratio changes. Specifically, changing both burst initiation and pause release rates would lead to correlated changes in these two measurements across many parameter sets, with each parameter set representing a different “gene” (Figure 3A top right, R2=0.95). The relationship is approximately log(fold change transcription site intensity)= 0.55*log(fold change traveling ratio), although the slope of relationship depends somewhat on model parameters (Supplementary Figure 4C). This is because changing burst initiation rate does not affect these measures much, leaving the changes in polymerase pause release rates to dominate, producing the strong correlation. However, if polymerase recruitment rate were changed in addition to pause release rates, the model predicted that across many parameter sets (i.e. “genes”), the changes in traveling ratio and transcription site intensity should NOT be strongly correlated (R2=0.39) (Figure 3A, bottom right), because changes to each of these rates push these measurements in different directions. (Similar results arose for changes to termination rate; Supplementary Figure 4B.)
Thus, to test this model, we could measure the effects of 13 hours of erythroid differentiation on several genes (each presumably corresponding changing different rates to different degrees) and measure the quantitative relationship between changes to Pol II traveling ratio and transcription site intensity (Figure 3B). We found that the changes in transcription site intensity and Pol II traveling ratio were strongly correlated (R2=0.88): for example, both Prdx2 and Hbb-b1 genes had increased transcription site intensity and Pol II traveling ratio, while both Myc (encoding a broadly-expressed transcription factor controlling proliferation) and Gata2 (encoding a hematopoietic stem cell transcription factor) genes had decreased transcription site intensity and Pol II traveling ratio. Moreover, this quantitative relationship fell near the log y= 0.55* log × relationship predicted if only burst initiation and pause release were changed, with a slope of 0.62. Taken together, experimental data for these genes suggested that polymerase recruitment rate was not greatly changed in erythroid differentiation. (We can similarly exclude a large change in burst termination rate, by comparing to Supplementary Figure 4B). Thus we conclude that burst initiation and polymerase pause release are the main rates changed by erythroid differentiation.
We checked whether promoter accessibility correlated with changes to different rates by looking for associated changes in promoter DNAse sensitivity (Supplementary Figure 4D). We found no strong correlations. Further studies will be required to examine why different genes react differently in response to erythroid differentiation.
BET inhibition changes both burst initiation and polymerase pause release rates
To test the generality of our conclusions, we examined several more complex biological perturbations to see whether they too chiefly affected burst initiation and polymerase pause release rates, starting with treatment with a BET inhibitor. BET inhibitor treatment blocks the transcriptional activator proteins BRD2, BRD3 and BRD4 from binding to chromatin, and may inhibit multiple facets of gene regulation including polymerase pause release and enhancer activity (Shi & Vakoc 2014; Belkina & Denis 2012; Stonestrom et al. 2016). We first looked for genes where we could pinpoint changes to precisely one transcriptional rate. Acute BET inhibitor treatment reduced mean transcription sites per cell for the Hbb-b1 gene without changing transcription site intensity or Pol II traveling ratio, showing that burst initiation alone was specifically reduced for this gene (Figure 4A). In contrast, for the genes Tal1, Slc25a37, and Slc4a1 (which encode an erythroid transcription factor and two solute channels highly expressed in erythroid cells), all three RNA FISH and Pol II ChIP-seq measures were reduced (Figure 4B).
Figure 4. BET inhibitor treatment changes both burst initiation and polymerase pause release rates.

a. Representative and summary nascent transcript RNA FISH and Pol II ChIP-seq after 60 minutes of 250nM JQ1 BET inhibitor treatment of G1E-ER4 cells differentiated for 24 hours with 100nM estradiol for the Hbb-b1 gene, n=3 biological replicates of nascent transcript RNA FISH (72-306 cells per replicate per experiment) and n=3 replicates of Pol II ChIP-seq. Contrast for RNA FISH channel was set equally.
b. Nascent transcript RNA FISH and Pol II ChIP-seq after 60 minutes of 250 nM JQ1 BET inhibitor treatment of G1E-ER4 cells differentiated for 24 hours with 100nM estradiol for Slc25a37, Tal1, and Slc4a1 genes, n=3 biological replicates of nascent transcript RNA FISH (94-195 cells per replicate per experiment) and n=3 biological replicates of Pol II ChIP-seq. Top, representative data. Contrast for RNA FISH channel was set to equally. See also Supplementary Figure 5.
Combining modeling and experimentation suggests that BET inhibition does not greatly change polymerase recruitment rate
The changes to all three measures necessitating the use of the same statistical approach used for erythroid differentiation of correlating changes in transcription site intensity and Pol II traveling ratio across multiple (12) genes. As before, the "polymerase recruitment only occurs during bursts" model predicted that simultaneous changes to the rates of burst initiation and pause release would result in highly correlated changes to Pol II traveling ratio and transcription site intensity., while if polymerase recruitment rate were also changed to varying degrees in some genes, this correlation would weaken considerably (R2=0.39, Figure 3A lower right). Examining 12 genes, including both important erythroid genes as well as housekeeping genes such as Pabpc1 and Hnrnpl, we found that BET inhibition produced a strongly correlated relationship between changes in Pol II traveling ratio and transcription site intensity (R2=0.77) falling near the log(transcription site intensity)= 0.55*log(traveling ratio) line (Figure 5A) with a slope of 0.41. We thus concluded that BET inhibitor treatment likely affected primarily the rates of burst initiation and pause release but not polymerase recruitment rate.
Figure 5. Combining modeling and experimentation suggests that BET inhibitor treatment does not greatly change polymerase recruitment rate.

a. Fold change in transcription site intensity and Pol II traveling ratio for 12 genes after 60 minutes of 250nM JQ1 BET inhibitor treatment of G1E-ER4 cells differentiated for 24 hours with 100nM estradiol, n=3 biological replicates of nascent transcript RNA FISH (72-306 cells per gene per replicate per experiment) and n=3 biological replicates of Pol II ChIP-seq. Error bars display SEM. See also Supplementary Figure 5.
Because BET proteins bind to acetylated histones, we wondered if we could predict which genes had changes in different rates by looking at Histone 3 lysine 27 acetyl levels at gene promoters. We found that promoter H3K27ac weakly correlated to change in transcription sites per cell in response to BET inhibition (Supplementary Figure 5B), but not to changes in other transcriptional measurements. It is unclear what to make of this weak association.
Some previous studies suggested that BET inhibition might alter transcriptional elongation rate(Kanno et al. 2014), which we assumed to be constant in our models. To test this assumption, we blocked transcriptional pause release using DRB and then allowed transcriptional elongation to resume in the presence or absence of BET inhibitor. By measuring the time it took to transcribe from an early to a late region of the nascent RNA using RNA FISH (Supplementary Figure 5A), we found (for the Zfpm1 gene) that BET inhibitor did not greatly affect the elongation rate. Our estimate for the elongation rate, 2.0 kilobases per minute, was similar to that of previous studies, (2-5 kilobases per minute, (Danko et al. 2013; Jonkers et al. 2014; Singh & Padgett 2009).
Slc25a37 enhancer mutation does not greatly change polymerase recruitment rate
We also used the "polymerase recruitment only occurs during bursts" model to examine what rates were changed by enhancer mutagenesis of the lineage-specific Slc25a37 (mitoferrin-1) enhancer. The Xu group (Huang et al. 2016) previously created a series of G1E-ER4 cell lines with partial and full deletions of the large Slc25a37 enhancer region which reduced the RNA output of the target gene (encoding an erythroid-specific mitochondrial iron transporter) to varying degrees (Supplementary Figure 5C-D). Applying the same methodology as above, we found the enhancer-deletion cells had correlated reductions of Pol II traveling ratio and transcription site intensity (R2=0.89) falling near the log(transcription site intensity)= 0.55*log(traveling ratio) line, with a slope of 0.70 (Supplementary Figure 5E). (Our modeling suggests that these enhancer mutations likely also reduce burst initiation rate, due to the strong reduction produced in Pol II promoter occupancy.) Thus, mutation of the Slc25a37 enhancer reduced polymerase pause release rate, but appeared not to greatly change polymerase recruitment rate. Taken together, our results from both complex and targeted genetic perturbations suggest that burst initiation and pause release are the two main control points of transcriptional regulation; indeed, only the targeted inhibitor triptolide seemed to strongly alter polymerase recruitment rate.
Discussion
We sought to build a comprehensive framework of the steps of transcription including transcriptional bursting, polymerase recruitment, and polymerase pause release, and then determine which of these steps are biologically regulated by combining single cell and bulk biochemical measures of transcription. This approach revealed that polymerase recruitment can only occur after a burst is initiated, and rejected the possibility (Shao & Zeitlinger 2017) that polymerase can reside in the promoter-proximal paused state after a burst ends and then can be released when a burst begins (Figure 6). We then applied a number of biological perturbations and found that burst initiation and polymerase pause release were the main transcriptional steps whose rates were altered by stimuli. Such experiments should be also performed with other genes and in other systems to confirm the generality of these conclusions.
Figure 6. Summary Schematic.

a. The “polymerase recruitment only occurs during bursts” model is consistent with experimental data, in which we perturbed the rates of burst initiation and polymerase pause release. The data were not consistent with the “polymerase pause release only occurs during bursts” model or the telegraph model.
Notably, both Pol II ChIP-seq, which averages polymerase occupancy for a population of cells, and nascent transcript RNA FISH, which measures transcription in single cells, were required to uniquely map changes in the rates of transcriptional steps to changes in experimental measurements. Only nascent transcript RNA FISH could distinguish changes in polymerase recruitment rate from changes in burst initiation rate (using transcription site intensity) (Figure 1E-F). On the other hand, only Pol II ChIP-seq could distinguish between changes in polymerase recruitment and polymerase pause release rates (Figures 1D-E). Therefore combining the genomic resolution of bulk measurements with single-cell transcriptional measures to reveal burst kinetics was critical to determine which step of transcription was changed by a biological perturbation.
Our results point primarily to burst initiation rate and polymerase pause release rate as key regulated steps in response to the various biological perturbations of our experiments. We note, however, that polymerase recruitment is certainly a required step of transcription. Indeed, polymerase recruitment rate was rate limiting in the context of triptolide treatment. The finding that polymerase recruitment rate is not typically altered by biological perturbations corresponds well to recent single molecule imaging studies of Pol II, in which the authors found that even when a gene was lowly transcribed, many molecules of polymerase clustered near its promoter (Cho et al. 2016; Cisse et al. 2013). Since only one polymerase can bind a promoter at a time (Shao & Zeitlinger 2017; Gressel et al. 2017), it is possible that polymerase recruitment typically occurs with a very high rate in all conditions. It would be interesting in future to examine whether each gene has its own polymerase recruitment rate, and whether this is encoded by gene promoters.
Given that our study and others (Fukaya et al. 2016; Senecal et al. 2014; Chen et al. 2018) show that control of transcriptional bursting is a key aspect of gene regulation, it will be essential to characterize its biochemical underpinnings. An intriguing hypothesis with some experimental support is that burst initiation is related to enhancer-promoter looping (Bartman et al. 2016; Fukaya et al. 2016; Chen et al. 2018). Here, we have shown for Hbb-b1 that increasing enhancer-promoter contacts specifically increases burst initiation. It is possible that the enhancer must contact a promoter before every burst (Chen et al. 2018). Burst initiation could also be controlled by other events such as transcription factor binding or nucleosome remodeling. Recently, some have suggested that bursting could be related to condensation or phase separation of transcriptional proteins, and others may wish to investigate this possibility (Hnisz et al. 2017; Cho et al. 2018). Ultimately, we believe that understanding the mechanistic basis of transcriptional bursts will require the ability to perform more biochemical assays in single cells.
Our experiments with BET inhibitor treatment show that BET proteins can regulate both burst initiation rate and polymerase pause release rate. Many papers in the literature have suggested that a chief effect of BET inhibition was to inhibit polymerase pause release, and we also found that this is a dominant effect (Bartholomeeusen et al. 2012; Yang et al. 2005; Jang et al. 2005; Winter et al. 2017). However, we also observed significant effects of BET inhibitors on burst initiation rate. Tor example, BET inhibition of Hbb-b1 only altered burst initiation rate and did not change polymerase pause release rate (Figure 4). Thus, BET proteins likely have multiple modes for modulating gene expression (Shi & Vakoc 2014; Belkina & Denis 2012; Stonestrom et al. 2016).
We concluded that burst initiation and polymerase pause release were the key control points of transcription based on analysis of a total of 16 genes, but the same stimulus led to different magnitudes of response. Future studies examining more genes may identify features of these genes, such as enhancer or promoter characteristics, that predict this spectrum of responses. The genes we measured included mostly developmentally-regulated genes (e.g. Hbb-b1, Slc25a37, Myc) as well as widely expressed ‘housekeeping’ genes (e.g. Pabpc1, Hnrnpl). Some studies have suggested that different classes of genes might be preferentially regulated by different transcriptional control points: for example, genes strongly regulated by pause release rate are enriched for signal-responsive genes (Guenther et al. 2007; Adelman & Lis 2012). Measurement of different classes of genes using our methodology may identify such different modes of regulation.
Our study found that polymerase recruitment can only take place during active transcriptional bursts, contrary to previous speculation that polymerase could be recruited anytime and then could undergo pause release during a burst (Shao & Zeitlinger 2017). Two lines of experimental evidence support this conclusion. First, if bursts led to release of polymerase stuck at the pause site, Pol II traveling ratio would increase, but increasing burst initiation rate with the looping factor did not increase the Pol II traveling ratio (Figure 1F versus Figure 1B). Second, the “polymerase pause release only occurs during bursts” model predicts coordinated changes in the number of transcription sites per cell and traveling ratio, but in multiple situations, we observed only changes to number of transcription sites per cell (Figure 1F, 2A, 4A). This sequence of steps helps put findings from other groups about the properties of polymerase pause release into context. For example, in the “polymerase recruitment only occurs during bursts” framework, a gene would exhibit a long-lived pause (i.e. as measured in Henriques et al. 2013) if that gene has a low pause release rate; in that case, polymerase might bind during a burst, but would be unlikely to undergo pause release, and would remain bound in the promoter-proximal region until the burst terminates.
Our study more generally demonstrates the utility of a model-based approach to identifying regulated transcriptional steps. In particular, previous studies of the burst initiation and termination phases have been largely phenomenological, characterized primarily by observables like burst frequency and transcription site intensity (Senecal et al. 2014; Dar et al. 2012; Mateos-Langerak et al. 2016; Octavio et al. 2009). It has, however, proven difficult to discern any general rules or principles from these studies. Our study suggests that this may be due to the fact that these experimental observables can be convolved in counterintuitive ways; indeed, there is no reason a priori to believe that such observables map one-to-one to particular biological processes. For example, our study suggests that transcription site intensity was not independently regulated; rather, transcription sites per cell and transcription site intensity were both altered when polymerase recruitment or polymerase pause release are changed (Figure 1). By using a model-based approach informed by a combination of data types, we were instead able to interpret these observables in terms of parameters of a simple model of transcription, thus revealing a more consistent underlying picture over a variety of perturbations.
STAR Methods
Contact For Reagents and Resource Sharing
Further information and requests for resources and reagents should be directed to and will be fulfilled by the Lead Contact, Arjun Raj (arjunrajlab@gmail.com).
Experimental Model and Subject Details
G1E cells were previously derived through deletion of GATA1 in mouse embryonic stem cells, followed by in vitro differentiation (Weiss et al., 1997). We cultured a subline of G1E cells, G1E-ER4, in which GATA-1-ER was transduced by retrovirus (Weiss et al., 1997). G1E-ER4 cells were grown in IMDM+15% FBS, penicillin/streptomycin, Kit ligand, monothioglycerol and epoetin alpha in a standard tissue culture incubator at 37C with 5% CO2. G1E-ER4 cells were induced to mature by the addition of 100nM estradiol to culture media.
For experiments examining the Slc25a37 enhancer region (Supplementary Figure 5), control and 4 enhancer deletion G1E-ER4 cell lines created previously were kindly provided by the Jian Xu lab (Huang et al. 2016). Cells were differentiated for 24 hours using estradiol and transcription was measured by RNA FISH or ChIP-qPCR.
Method Details
Cell culture drug treatments and infection
For differentiation experiments (Figures 2 and 3), cells were treated with estradiol for 4 or 13 hours as noted in the figure. For flavopiridol experiments (Figure 1D), the noted concentration of flavopiridol (either 10nM, 100nM, or 1uM) was added for 60 minutes to cells differentiated for 24 hours. For triptolide experiments (Figure 1E, Supplementary Figure 1D), the noted concentration of flavopiridol (either 10nM, 100nM, 300nM, or 1uM) was added for 60 minutes to cells differentiated for 24 hours. For BET inhibition experiments (Figures 4 and 5), 250nM JQ1(Filippakopoulos et al. 2010) was added for 60 minutes to cells differentiated for 24 hours. For forced looping experiments (Figure 1F), cells were infected with the MIGR-1 retrovirus(Pear et al. 1998) expressing only GFP or expressing mZF-SA followed by an IRES element and GFP (Deng et al. 2012). Cells were infected, expanded for two days and sorted using a BD FacsAria to purify GFP+ infected cells from control and mZF-SA samples, estradiol was added for 9 hours and transcription was measured by RNA FISH or ChIP-qPCR. For DRB transcriptional blocking to measure nascent transcript RNA FISH half-life (Supplementary Figure 1B), 75uM DRB was added for 0, 10 or 60 minutes to cells differentiated for 24 hours. For experiments to measure the Pol II elongation rate (Supplementary Figure 5A), 75uM DRB was added to cells differentiated 21 hours. After 3 hours (24 hours differentiation), DRB was removed by washing and cells were fixed at 10-minute intervals after DRB removal.
Chromatin Immunoprecipitation
We performed ChIP as previously described (Letting et al. 2004), using the N-20 Pol II antibody (Santa Cruz sc899) (Note that as of October 2018, this antibody is no longer available; a suitable substitute may be Cell Signaling #14958.) G1E-ER4 cells (10 million per sample) were fixed in 1% formaldehyde in PBS at room temperature with agitation for 10 min, then quenched with 1M glycine for 5 min. Fixed cells were resuspended in 1mL Cell Lysis Buffer (10mM Tris pH 8, 10mM NaCl, 0.2% NP-40/Igepal) prepared fresh with protease inhibitors (Sigma P8340) and 1mM phenylmethylsulfonyl fluoride (PMSF) and incubated on ice for 10 min. Nuclei were pelleted and resuspended in 1mL Nuclear Lysis Buffer (50mM Tris pH 8, 10mM EDTA, 1% SDS, pre- pared fresh with protease inhibitors and PMSF), and incubated on ice for 20 min. Samples were then diluted with 0.6mL IP Dilution Buffer (20mM Tris pH 8, 2mM EDTA, 150mM NaCl, 1% Triton X-100, 0.01% SDS, prepared fresh with protease inhibitors and PMSF), and sonicated at 4C for 45 min. After sonication, samples were spun at 20,000xg for 5 min at 4C to remove debris and added to preclearing reactions containing 4.2mL IP Dilution Buffer, protein A/G agarose beads (agarose beads slurry was prepared by mixing Protein A (ThermoFisher 15918014) and Protein G (ThermoFisher 15920010) agarose beads at 1:1 ratio) and 50ug of isotope-matched IgG. Samples were precleared for 24 hr. Prior to setting up immunoprecipitation (“IP”) reactions, 200ul of precleared chromatin was removed as “Input.” To set up IP reactions, precleared chromatin was added to protein A/G beads pre-bound with antibody and rotated overnight at 4C. Beads were washed once with IP Wash 1 (20mM Tris pH 8, 2mM EDTA, 50 mM NaCl, 1% Triton X-100, 0.1% SDS), twice with High Salt Buffer (20 mM Tris pH 8, 2mM EDTA, 500 mM NaCl, 1% Triton X-100, 0.01% SDS), once with IP Wash Buffer 2 (10 mM Tris pH 8, 1mM EDTA, 0.25 M LiCl, 1% NP-40/Igepal, 1% sodium deoxycholate), and twice with TE (10mM Tris pH 8, 1mM EDTA pH 8). All washes were performed on ice. Following the final wash, beads were moved to room temperature and eluted twice with 100ul of Elution Buffer (100mM NaHCO3, 1%SDS, prepared fresh) for a final eluate volume of 200ul. The following were added to each IP and input sample: 12ul of 5M NaCl, 2ul RNaseA (10mg/ml, 10109169001 BMB) and samples were incubated at 65C for R 1 hr. 3ul of proteinase K (20mg/ml, 3115879 BMB) was added and samples were incubated at 65C overnight. Following overnight incubation, 10ul of 3M sodium acetate pH 5.2 was added to each sample and DNA was purified using the QIAquick PCR Purification kit (QIAGEN 28106) per the manufacturer’s instructions.
For ChIP-sequencing, library construction was performed using Illumina’s TruSeq ChIP sample preparation kit (Illumina, catalog no. IP-202-1012) according to manufacturer’s specifications with the addition of a size selection using SPRIselect beads (Beckman Coulter, catalog no. B23318) prior to PCR amplification. Library size was determined (average ~340 bp) using the Agilent Bioanalyzer 2100, followed by quantitation using real-time PCR using the KAPA Library Quant Kit for Illumina (KAPA Biosystems catalog no. KK4835). Libraries were then pooled and sequenced on the Illumina NextSeq 500 using Illumina sequencing reagents according to manufacturer’s instructions.
Single-molecule RNA FISH imaging
We performed single-molecule RNA FISH as described previously (Raj et al. 2006; Femino et al. 1998). All probes used were complementary to introns of gene of interest (except the exontargeted probe measures of mRNA shown in Supplementary Figures 1A and 5C). All intron probes were approximately evenly spaced along length of RNA (except the transcriptional elongation rate measurements in Supplementary Figure 5A, in which probes were placed at 5’ or 3’ end of Zfpm1). Sequences of all probes used are listed in Supplementary Table 1. Briefly, we fixed cells in 1.85% formaldehyde for 10min at room temperature, and stored them in 70% ethanol at 4 degrees C until imaging. We hybridized pools of FISH probes to samples, followed by DAPI staining and wash steps performed in suspension. Samples were cytospun onto slides for imaging on a Nikon Ti-E inverted fluorescence microscope using a 100x Plan-Apo objective (numerical aperture of 1.43), a cooled CCD camera (Pixis 1024B from Princeton Instruments), and filter sets SP102v1 (Chroma), SP104v2 (Chroma), and 31000v2 (Chroma) for Cy3, Cy5, and DAPI, respectively. Custom filter (Omega) was used for Alexa594. We took 45 optical z-sections at intervals of 0.35 microns, spanning the vertical extent of cells, with 1s exposure time for Cy3, Cy5, and Alexa594, and 35ms for DAPI.
Quantification and Statistical Analysis
ChIP-sequencing analysis
All Pol II ChIP-seq data was generated for this study, except the 0 and 13h G1E-ER4 differentiation (Figures 2 and 3), which was from (Hsiung et al. 2016). We used bcl2fastq2 to convert and demultiplex the reads. We also applied fastQC to get read stats, Bowtie (0.12.8)(Langmead & Salzberg 2012) to map reads to the mm9 genome (multiple and unique mappings), Samtools(Li et al. 2009) to convert SAM to BAM and get stats, MACS (1.3.7.1) (Feng et al. 2012) to make wiggle files, and used wigToBigWig to convert wiggle files to bigWig files.
We then performed bigWigAverageOverBed (Quinlan & Hall 2010) to find Pol II binding signal at transcription start site (TSS) region (750 bp upstream of transcription start site to 750 bp downstream), and transcription end site (TES) region (transcription end site to 1500 bp downstream of transcription end site), and calculated the Pol II traveling ratio for TES/TSS Pol II signal. (In Supplementary Figure 1F, we instead calculated the Pol II traveling ratio by (gene body)/TSS, where gene body included 750 bp downstream of TSS to 1500 bp downstream of TSS.) We displayed data from only the genes with detectable Pol II binding in all regions in all experimental conditions, so that we could avoid examining genes that aren’t transcribed in one condition, by setting arbitrary cutoff values on the bigWigAverageOverBed results, and results were robust to changes in cutoff. To display Pol II ChIP-seq tracks in figures (e.g. Figure 1D), we displayed tracks normalized by number of aligned reads per sample.
For analysis of promoter DNAse hypersensitivity (Supplementary Figure 4D), data was taken from (Hsiung et al. 2015). DNAse promoter sensitivity was determined using bigWigAverageOverBed in the TSS region (750 bp upstream to 750 bp downstream of TSS).
For analysis of promoter H3K27ac density (Supplementary Figure 5B), data was taken from (Hsiung et al. 2016). DNAse promoter sensitivity was determined using bigWigAverageOverBed in the TSS region (750 bp upstream to 750 bp downstream of TSS). This same dataset was used for the H3K27ac track displayed in Supplementary Figure 5C.
For perturbations in which only one gene was expected to change, forced enhancer-promoter looping (Figure 1F) and Slc25a37 enhancer deletion (Supplementary Figure 5E), ChIP-qPCR was used to measure traveling ratio changes rather than ChIP-sequencing. ChIP-qPCR was performed using Power SYBR Green master mix (Thermo Fisher #4367660 ). Primers were placed at the beginning and end of Hbb-b1 and Slc25a37 respectively, and the ratio of TES-proximal to TSS-proximal promoter signal were used as traveling ratio, after normalizing to ChIP input. Primer sequences are listed in Supplementary Table 2.
Image Analysis
We manually segmented boundaries of cells from bright field images and localized RNA spots using custom software written in MATLAB (Raj et al. 2010), with subsequent analyses performed in R. Transcription sites were identified by bright nuclear intron spots. Fluorescence intensities of transcription sites were determined by 2D Gaussian fitting on processed image data.
Mathematical modeling
Mathematical models were constructed and simulations were performed in Matlab using Gillespie’s stochastic simulation algorithm (Gillespie 1976). For the "polymerase recruitment only occurs during bursts" model, genes could be in three states (closed, open, polymerase bound). A gene in the closed (off, non-burst initiated) state transitions to the open (bursting) state at the burst initiation rate, while a gene in the open state can have polymerase bind the promoter with the polymerase recruitment rate. Once a polymerase is bound, that polymerase can be released to elongation with the rate of polymerase release from pausing, and the promoter thus returns to the open and unbound state. Only one polymerase was permitted to be in the promoter-proximal region of a gene copy at one time (Shao & Zeitlinger 2017; Gressel et al. 2017). From either the open unbound or open polymerase bound state, the gene can transition to the off state with the rate of burst termination. We varied each of these rates through a 1000 fold range of values (as shown in Supplementary Figure 3E). Other model variations ("polymerase pause release only occurs during bursts", telegraph, ‘recruitment-release’, ‘polymerase recruitment only occurs during bursts with refractory period’, and ‘polymerase recruitment only occurs during bursts with possibility of termination from pause release site’) had different transition possibilities dictated by the frameworks displayed in Supplementary Figures 2 and 3.
For every set of rates in a given model, we simulated 1000 gene copies, which were allowed to proceed through 2000 changes in state. We recorded the state of each gene copy at 1500 time intervals. The simulation equilibrated away from the initial condition (every gene copy started in the ‘off’ state) for every property within this time window, typically after ~100-200 time steps, and the value at which it converged was used for the following analyses. Each time a gene underwent the pause release (or RNA production) step, we allowed that polymerase to produce 1 RNA and elongate along the gene body for a short, fixed amount of time, and then for the polymerase to fall off the gene body and the nascent RNA to no longer be detected by RNA FISH. We then used the above information to calculate: transcription sites per cell (proportion of gene copies with at least 1 polymerase elongating in the gene body at a given time); transcription site intensity (average number of elongating polymerases on one gene for gene copies with at least 1 polymerase elongating in the gene body at a given time), polymerase recruitment signal at promoter (proportion of gene copies in the pol2 bound state), polymerase recruitment signal at gene body (average number of Pol molecules in the gene body). We calculated Pol II traveling ratio as gene body polymerase signal divided by promoter polymerase signal. (Note that none of these measures rely on identifying the beginning and end of a ‘burst’: if bursts are frequent enough, they will run together, leading to all gene copies being transcribed (maximum of 2 gene copies per cell) and leading to increased transcription site intensity).
Figure generation, plotting and graphics
We used R packages dplyr and ggplot2(Wickham 2016) to produce nearly all figures, followed by cosmetic adjustments in Adobe Illustrator. All code to perform modeling, data analysis and figure generation is available in Dropbox (https://www.dropbox.com/sh/ti5lfcn0e71p45i/AAD64o4EM6v3_1Gw3_88XuBza?dl=0).
Data and Software Availability
Nascent transcript RNA FISH data was analyzed using a custom pipeline available at https://bitbucket.org/arjunrajlaboratory/rajlabimagetools/wiki. Quantification of nascent transcript RNA FISH data is available at (https://www.dropbox.com/sh/ti5lfcn0e71p45i/AAD64o4EM6v3_1Gw3_88XuBza?dl=0).
Simulations to predict changes in Pol II ChIP-seq and nascent transcript RNA FISH given a set of regulated steps of transcription (as in Figure 1A-B, Supplementary Figure 3) are available at https://www.dropbox.com/sh/eik9abis3abfmx9/AADJRhC-3cy-Ym2_sff1cmtXa?dl=0.
Pol II ChIP-seq data generated for this publication are available at GSE121706. Pol II ChIP-seq data and H3K27ac ChIP-seq data generated in (Hsiung et al. 2016) are available at GSE83293. DNAse-seq data generated in (Hsiung et al. 2015) are available at GSE83293.
Supplementary Material
Supplementary Table 1. RNA FISH probes, related to STAR methods. Sequences of all RNA FISH probes used in paper.
Supplementary Table 2. ChIP-qPCR primers, related to STAR methods. Sequences of ChIP-qPCR primers used in paper, in Figure 1F and Supplementary Figure 5E.
| REAGENT or RESOURCE | SOURCE | IDENTIFIER |
|---|---|---|
| Antibodies | ||
| Pol II ChIP antibody | Santa Cruz | sc899 |
| Bacterial and Virus Strains | ||
| Migr-1 | Lab of Dr. Warren Pear, available from Addgene | Pear et al. 1998 |
| Chemicals, Peptides, and Recombinant Proteins | ||
| estradiol | sigma | Sigma E2758-250MG |
| JQ1 BET inhibitor | Laboratory of James E. Bradner | Filippakopoulos et al. Nature. 2010 Dec 23. 468(7327):1067-73. |
| Triptolide | Selleckchem | s3604 |
| Flavopiridol | Sigma | F3055 |
| DRB | Sigma | D1916 |
| Protein A agarose beads | Thermo Fisher | #15918014 |
| Protein G agarose beads | Thermo Fisher | #15920010 |
| Protease Inhibitor | Sigma | P8340 |
| Rnase A | BMB | 10109169001 |
| Proteinase K | BMB | 3115879 |
| SPRIselect beads | Beckman Coulter | B23318 |
| Critical Commercial Assays | ||
| Power SYBR Green PCR Master Mix | Thermo Fisher | 4367660 |
| TruSeq ChIP Sample Prep Kit | Illumina | IP-202-1012 |
| Kapa quantification | KAPA Biosystems | KK4835 |
| Deposited Data | ||
| ChIP-seq data | this paper | GSE121706 |
| ChIP-seq data | Hsiung et al. 2016 | GSE83293 |
| ChIP-seq data | Hsiung et al. 2015 | GSE61885 |
| Experimental Models: Cell Lines | ||
| G1E-ER4 cells | laboratory of Mitchell J. Weiss | Weiss et al. 1997 |
| Slc25a37-enhancer mutated G1E-ER4 cells | laboratory of Jian Xu | Huang et al. 2016 |
| Oligonucleotides | ||
| RNA FISH probes | this paper | Supplementary Table 1 |
| ChIP-qpcr primers | this paper | Supplementary Table 2 |
| Recombinant DNA | ||
| ZF-SA Hbb-b1 forced enhancer-promoter looping factor | laboratory of Gerd A. Blobel | Deng et al. 2012 |
| Software and Algorithms | ||
| Bowtie | Langmead and Salzberg 2012 | http://bowtie-bio.sourceforge.net/bowtie2/index.shtml |
| MAC2 | Zhang et al 2012 | https://github.com/taoliu/MACS |
| BEDTools | Quinlan and Hall 2010 | https://github.com/arq5x/bedtools2 |
| MATLAB | Mathworks | https://www.mathworks.com/products/matlab.html |
| R | R core team | https://www.R-project.org/ |
| Rajlabimagetools | Laboratory of Arjun Raj | https://bitbucket.org/arjunrajlaboratory/rajlabimagetools/wiki/Home |
| ggplot2 | Hadley Wickham | Wickham 2016 |
| dplyr | Hadley Wickham | https://CRAN.R-project.org/package=dplyr |
| Fastqc | Babraham Bioinformatics | https://www.bioinformatics.babraham.ac.uk/projects/fastqc/ |
| Samtools | http://www.htslib.org/ | Li et al. 2009 |
| Models to predict changes in Pol II ChIP-seq and nascent transcript RNA FISH | this paper | https://www.dropbox.com/sh/ti5lfcn0e71p45i/AAD64o4EM6v3_1Gw3_88XuBza?dl=0 |
Highlights.
Burst initiation is required before polymerase recruitment can occur
Biological stimuli changed only burst initiation and polymerase pause release rates
No biological stimuli tested altered polymerase recruitment rate
Acknowledgements
The authors thank members of the Blobel and Raj labs for careful reading and suggestions, especially Sara Rouhanifard, Connie Jiang, Ian Dardani, and Vivek Behera, and the Jian Xu lab for providing the Slc25a37 enhancer mutant cell lines. This work was supported by an NSF GRFP fellowship to C.R.B., NIH Center for Photogenomics (RM1 HG007743) to A.R., 1RO1 HL119479 to G.A.B., NIH NIDDK R01 DK054937 to G.A.B., NIH NIDDK R24 DK106766 to G.A.B. and R.C.H., and UO1 129998 to A.R. and G.A.B.
Footnotes
Declaration of Interests
AR receives royalties from LGC/Biosearch Technologies related to Stellaris RNA FISH probes.
Publisher's Disclaimer: This is a PDF file of an unedited manuscript that has been accepted for publication. As a service to our customers we are providing this early version of the manuscript. The manuscript will undergo copyediting, typesetting, and review of the resulting proof before it is published in its final citable form. Please note that during the production process errors may be discovered which could affect the content, and all legal disclaimers that apply to the journal pertain.
References
- Adelman K & Lis JT, 2012. Promoter-proximal pausing of RNA polymerase II: emerging roles in metazoans. Nature reviews. Genetics, 13(10), pp.720–731. [DOI] [PMC free article] [PubMed] [Google Scholar]
- Bahar Halpern K et al. , 2015. Bursty gene expression in the intact mammalian liver. Molecular cell, 58(1), pp.147–156. [DOI] [PMC free article] [PubMed] [Google Scholar]
- Bartholomeeusen K et al. , 2012. Bromodomain and extra-terminal (BET) bromodomain inhibition activate transcription via transient release of positive transcription elongation factor b (P-TEFb) from …. ASBMB. Available at: http://www.jbc.org/content/287/43/36609.short. [DOI] [PMC free article] [PubMed] [Google Scholar]
- Bartman CR et al. , 2016. Enhancer Regulation of Transcriptional Bursting Parameters Revealed by Forced Chromatin Looping. Molecular cell, 62(2), pp.237–247. [DOI] [PMC free article] [PubMed] [Google Scholar]
- Belkina AC & Denis GV, 2012. BET domain co-regulators in obesity, inflammation and cancer. Nature reviews. Cancer, 12(7), pp.465–477. [DOI] [PMC free article] [PubMed] [Google Scholar]
- Bensaude - Transcription, O. & 2011, 2011. Inhibiting eukaryotic transcription. Which compound to choose? How to evaluate its activity? Which compound to choose? How to evaluate its activity? Taylor & Francis. Available at: http://www.tandfonline.com/doi/abs/10.4161/trns.2.3.16172. [DOI] [PMC free article] [PubMed]
- Chen H et al. , 2018. Dynamic interplay between enhancer-promoter topology and gene activity. Nature genetics, 50(9), pp.1296–1303. [DOI] [PMC free article] [PubMed] [Google Scholar]
- Cho W-K et al. , 2018. Mediator and RNA polymerase II clusters associate in transcription-dependent condensates. Science, 361(6400), pp.412–415. [DOI] [PMC free article] [PubMed] [Google Scholar]
- Cho W-K et al. , 2016. RNA Polymerase II cluster dynamics predict mRNA output in living cells. eLife, 5 Available at: 10.7554/eLife.13617. [DOI] [PMC free article] [PubMed] [Google Scholar]
- Chubb JR et al. , 2006. Transcriptional pulsing of a developmental gene. Current biology: CB, 16(10), pp.1018–1025. [DOI] [PMC free article] [PubMed] [Google Scholar]
- Churchman LS & Weissman JS, 2011. Nascent transcript sequencing visualizes transcription at nucleotide resolution. Nature, 469(7330), pp.368–373. [DOI] [PMC free article] [PubMed] [Google Scholar]
- Cisse II et al. , 2013. Real-time dynamics of RNA polymerase II clustering in live human cells. Science, 341(6146), pp.664–667. [DOI] [PubMed] [Google Scholar]
- Coleman RA et al. , 2015. Imaging Transcription: Past, Present, and Future. Cold Spring Harbor symposia on quantitative biology, 80, pp.1–8. [DOI] [PMC free article] [PubMed] [Google Scholar]
- Core LJ & Lis JT, 2008. Transcription regulation through promoter-proximal pausing of RNA polymerase II. Science, 319(5871), pp.1791–1792. [DOI] [PMC free article] [PubMed] [Google Scholar]
- Core LJ, Waterfall JJ & Lis JT, 2008. Nascent RNA sequencing reveals widespread pausing and divergent initiation at human promoters. Science, 322(5909), pp.1845–1848. [DOI] [PMC free article] [PubMed] [Google Scholar]
- Coulon A et al. , 2013. Eukaryotic transcriptional dynamics: from single molecules to cell populations. Nature reviews. Genetics, 14(8), pp.572–584. [DOI] [PMC free article] [PubMed] [Google Scholar]
- Danko CG et al. , 2013. Signaling pathways differentially affect RNA polymerase II initiation, pausing, and elongation rate in cells. Molecular cell, 50(2), pp.212–222. [DOI] [PMC free article] [PubMed] [Google Scholar]
- Dar RD et al. , 2012. Transcriptional burst frequency and burst size are equally modulated across the human genome. Proceedings of the National Academy of Sciences of the United States of America, 109(43), pp.17454–17459. [DOI] [PMC free article] [PubMed] [Google Scholar]
- Deng W et al. , 2012. Controlling long-range genomic interactions at a native locus by targeted tethering of a looping factor. Cell, 149(6), pp.1233–1244. [DOI] [PMC free article] [PubMed] [Google Scholar]
- Femino AM et al. , 1998. Visualization of single RNA transcripts in situ. Science, 280(5363), pp.585–590. [DOI] [PubMed] [Google Scholar]
- Feng J et al. , 2012. Identifying ChIP-seq enrichment using MACS. Nature protocols, 7(9), pp.1728–1740. [DOI] [PMC free article] [PubMed] [Google Scholar]
- Filippakopoulos P et al. , 2010. Selective inhibition of BET bromodomains. Nature, 468(7327), pp.1067–1073. [DOI] [PMC free article] [PubMed] [Google Scholar]
- Fremeau RT Jr et al. , 1986. Regulation of pro-opiomelanocortin gene transcription in individual cell nuclei. Science, 234(4781), pp.1265–1269. [DOI] [PubMed] [Google Scholar]
- Fukaya T, Lim B & Levine M, 2016. Enhancer Control of Transcriptional Bursting. Cell, 166(2), pp.358–368. [DOI] [PMC free article] [PubMed] [Google Scholar]
- Gillespie DT, 1976. A general method for numerically simulating the stochastic time evolution of coupled chemical reactions. Journal of computational physics, 22(4), pp.403–434. [Google Scholar]
- Golding I et al. , 2005. Real-time kinetics of gene activity in individual bacteria. Cell, 123(6), pp.1025–1036. [DOI] [PubMed] [Google Scholar]
- Goodrich JA & Tjian R, 2010. Unexpected roles for core promoter recognition factors in cell-type-specific transcription and gene regulation. Nature reviews. Genetics, 11(8), pp.549–558. [DOI] [PMC free article] [PubMed] [Google Scholar]
- Gressel S et al. , 2017. CDK9-dependent RNA polymerase II pausing controls transcription initiation. eLife, 6. Available at: 10.7554/eLife.29736. [DOI] [PMC free article] [PubMed] [Google Scholar]
- Guenther MG et al. , 2007. A chromatin landmark and transcription initiation at most promoters in human cells. Cell, 130(1), pp.77–88. [DOI] [PMC free article] [PubMed] [Google Scholar]
- Hager GL, McNally JG & Misteli T, 2009. Transcription dynamics. Molecular cell, 35(6), pp.741–753. [DOI] [PMC free article] [PubMed] [Google Scholar]
- Henriques T et al. , 2013. Stable pausing by RNA polymerase II provides an opportunity to target and integrate regulatory signals. Molecular cell, 52(4), pp.517–528. [DOI] [PMC free article] [PubMed] [Google Scholar]
- Hnisz D et al. , 2017. A Phase Separation Model for Transcriptional Control. Cell, 169(1), pp.13–23. [DOI] [PMC free article] [PubMed] [Google Scholar]
- Hsiung CC-S et al. , 2016. A hyperactive transcriptional state marks genome reactivation at the mitosis-G1 transition. Genes & development, 30(12), pp.1423–1439. [DOI] [PMC free article] [PubMed] [Google Scholar]
- Hsiung CC-S et al. , 2015. Genome accessibility is widely preserved and locally modulated during mitosis. Genome research, 25(2), pp.213–225. [DOI] [PMC free article] [PubMed] [Google Scholar]
- Huang J et al. , 2016. Dynamic Control of Enhancer Repertoires Drives Lineage and Stage-Specific Transcription during Hematopoiesis. Developmental cell, 36(1), pp.9–23. [DOI] [PMC free article] [PubMed] [Google Scholar]
- Jang MK et al. , 2005. The Bromodomain Protein Brd4 Is a Positive Regulatory Component of P-TEFb and Stimulates RNA Polymerase II-Dependent Transcription. Molecular cell, 19(4), pp.523–534. [DOI] [PubMed] [Google Scholar]
- Jonkers I, Kwak H & Lis JT, 2014. Genome-wide dynamics of Pol II elongation and its interplay with promoter proximal pausing, chromatin, and exons. eLife, 3, p.e02407. [DOI] [PMC free article] [PubMed] [Google Scholar]
- Jonkers I & Lis JT, 2015. Getting up to speed with transcription elongation by RNA polymerase II. Nature reviews. Molecular cell biology, 16(3), pp.167–177. [DOI] [PMC free article] [PubMed] [Google Scholar]
- Juven-Gershon T et al. , 2008. The RNA polymerase II core promoter - the gateway to transcription. Current opinion in cell biology, 20(3), pp.253–259. [DOI] [PMC free article] [PubMed] [Google Scholar]
- Kalo A et al. , 2015. Cellular Levels of Signaling Factors Are Sensed by β-actin Alleles to Modulate Transcriptional Pulse Intensity. Cell reports, 13(6), pp.1284–1285. [DOI] [PubMed] [Google Scholar]
- Kanno T et al. , 2014. BRD4 assists elongation of both coding and enhancer RNAs by interacting with acetylated histones. Nature structural & molecular biology, 21(12), pp.1047–1057. [DOI] [PMC free article] [PubMed] [Google Scholar]
- Kwak H et al. , 2013. Precise maps of RNA polymerase reveal how promoters direct initiation and pausing. Science, 339(6122), pp.950–953. [DOI] [PMC free article] [PubMed] [Google Scholar]
- Langmead B & Salzberg SL, 2012. Fast gapped-read alignment with Bowtie 2. Nature methods, 9(4), pp.357–359. [DOI] [PMC free article] [PubMed] [Google Scholar]
- Larson DR et al. , 2013. Direct observation of frequency modulated transcription in single cells using light activation. eLife, 2, p.e00750. [DOI] [PMC free article] [PubMed] [Google Scholar]
- Letting DL et al. , 2004. Context-dependent regulation of GATA-1 by friend of GATA-1. Proceedings of the National Academy of Sciences of the United States of America, 101(2), pp.476–481. [DOI] [PMC free article] [PubMed] [Google Scholar]
- Levine M, Cattoglio C & Tjian R, 2014. Looping back to leap forward: transcription enters a new era. Cell, 157(1), pp.13–25. [DOI] [PMC free article] [PubMed] [Google Scholar]
- Li H et al. , 2009. The Sequence Alignment/Map format and SAMtools. Bioinformatics , 25(16), pp.2078–2079. [DOI] [PMC free article] [PubMed] [Google Scholar]
- Lionnet T et al. , 2011. A transgenic mouse for in vivo detection of endogenous labeled mRNA. Nature methods, 8(2), pp.165–170. [DOI] [PMC free article] [PubMed] [Google Scholar]
- Mateos-Langerak J et al. , 2016. A single-molecule view of transcription reveals convoys of RNA polymerases and multi-scale bursting. nature.com. Available at: https://www.nature.com/ncomms/2016/160727/ncomms12248/full/ncomms12248.html. [DOI] [PMC free article] [PubMed] [Google Scholar]
- Muse GW et al. , 2007. RNA polymerase is poised for activation across the genome. Nature genetics, 39(12), pp.1507–1511. [DOI] [PMC free article] [PubMed] [Google Scholar]
- Octavio LM, Gedeon K & Maheshri N, 2009. Epigenetic and conventional regulation is distributed among activators of FLO11 allowing tuning of population-level heterogeneity in its expression. PLoS genetics, 5(10), p.e1000673. [DOI] [PMC free article] [PubMed] [Google Scholar]
- Pear WS et al. , 1998. Efficient and rapid induction of a chronic myelogenous leukemia-like myeloproliferative disease in mice receiving P210 bcr/abl-transduced bone marrow. Blood, 92(10), pp.3780–3792. [PubMed] [Google Scholar]
- Peccoud J & Ycart B, 1995. Markovian Modeling of Gene-Product Synthesis. Theoretical population biology, 48(2), pp.222–234. [Google Scholar]
- Quinlan AR & Hall IM, 2010. BEDTools: a flexible suite of utilities for comparing genomic features. Bioinformatics , 26(6), pp.841–842. [DOI] [PMC free article] [PubMed] [Google Scholar]
- Rahl PB et al. , 2010. c-Myc regulates transcriptional pause release. Cell, 141(3), pp.432–445. [DOI] [PMC free article] [PubMed] [Google Scholar]
- Raj A et al. , 2006. Stochastic mRNA synthesis in mammalian cells. PLoS biology, 4(10), p.e309. [DOI] [PMC free article] [PubMed] [Google Scholar]
- Raj A et al. , 2010. Variability in gene expression underlies incomplete penetrance. Nature, 463(7283), pp.913–918. [DOI] [PMC free article] [PubMed] [Google Scholar]
- Senecal A et al. , 2014. Transcription factors modulate c-Fos transcriptional bursts. Cell reports, 8(1), pp.75–83. [DOI] [PMC free article] [PubMed] [Google Scholar]
- Shao W & Zeitlinger J, 2017. Paused RNA polymerase II inhibits new transcriptional initiation. Nature genetics, 49(7), pp.1045–1051. [DOI] [PubMed] [Google Scholar]
- Shi J & Vakoc CR, 2014. The mechanisms behind the therapeutic activity of BET bromodomain inhibition. Molecular cell, 54(5), pp.728–736. [DOI] [PMC free article] [PubMed] [Google Scholar]
- Singh J & Padgett RA, 2009. Rates of in situ transcription and splicing in large human genes. Nature structural & molecular biology, 16(11), pp.1128–1133. [DOI] [PMC free article] [PubMed] [Google Scholar]
- Stonestrom AJ et al. , 2016. Erythropoiesis provides a BRD’s eye view of BET protein function. Drug discovery today. Technologies, 19, pp.23–28. [DOI] [PMC free article] [PubMed] [Google Scholar]
- Suter DM et al. , 2011. Mammalian genes are transcribed with widely different bursting kinetics. Science, 332(6028), pp.472–474. [DOI] [PubMed] [Google Scholar]
- Tantale K et al. , 2016. A single-molecule view of transcription reveals convoys of RNA polymerases and multi-scale bursting. Nature communications, 7, p. 12248. [DOI] [PMC free article] [PubMed] [Google Scholar]
- Titov DV et al. , 2011. XPB, a subunit of TFIIH, is a target of the natural product triptolide. Nature chemical biology, 7(3), pp.182–188. [DOI] [PMC free article] [PubMed] [Google Scholar]
- Vispé S et al. , 2009. Triptolide is an inhibitor of RNA polymerase I and II--dependent transcription leading predominantly to down-regulation of short-lived mRNA. Molecular cancer therapeutics, 8(10), pp.2780–2790. [DOI] [PubMed] [Google Scholar]
- Wagschal A et al. , 2012. Microprocessor, Setx, Xrn2, and Rrp6 co-operate to induce premature termination of transcription by RNAPII. Cell, 150(6), pp.1147–1157. [DOI] [PMC free article] [PubMed] [Google Scholar]
- Weiss MJ, Yu C & Orkin SH, 1997. Erythroid-cell-specific properties of transcription factor GATA-1 revealed by phenotypic rescue of a gene-targeted cell line. Molecular and cellular biology, 17(3), pp.1642–1651. [DOI] [PMC free article] [PubMed] [Google Scholar]
- Wickham H, 2016. Introduction In Wickham H, ed. ggplot2: Elegant Graphics for Data Analysis. Cham: Springer International Publishing, pp. 3–10. [Google Scholar]
- Winter GE et al. , 2017. BET Bromodomain Proteins Function as Master Transcription Elongation Factors Independent of CDK9 Recruitment. Molecular cell, 67(1), pp.5–18.e19. [DOI] [PMC free article] [PubMed] [Google Scholar]
- Yang Z et al. , 2005. Recruitment of P-TEFb for stimulation of transcriptional elongation by the bromodomain protein Brd4. Molecular cell, 19(4), pp.535–545. [DOI] [PubMed] [Google Scholar]
- Zenklusen D, Larson DR & Singer RH, 2008. Single-RNA counting reveals alternative modes of gene expression in yeast. Nature structural & molecular biology, 15(12), pp.1263–1271. [DOI] [PMC free article] [PubMed] [Google Scholar]
- Zhou Q, Li T & Price DH, 2012. RNA polymerase II elongation control. Annual review of biochemistry, 81, pp.119–143. [DOI] [PMC free article] [PubMed] [Google Scholar]
- Zhou Q, Li T & Price DH, 2012. RNA polymerase II elongation control. Annual review of biochemistry, 81, pp.119–143. [DOI] [PMC free article] [PubMed] [Google Scholar]
Associated Data
This section collects any data citations, data availability statements, or supplementary materials included in this article.
Supplementary Materials
Supplementary Table 1. RNA FISH probes, related to STAR methods. Sequences of all RNA FISH probes used in paper.
Supplementary Table 2. ChIP-qPCR primers, related to STAR methods. Sequences of ChIP-qPCR primers used in paper, in Figure 1F and Supplementary Figure 5E.
Data Availability Statement
Nascent transcript RNA FISH data was analyzed using a custom pipeline available at https://bitbucket.org/arjunrajlaboratory/rajlabimagetools/wiki. Quantification of nascent transcript RNA FISH data is available at (https://www.dropbox.com/sh/ti5lfcn0e71p45i/AAD64o4EM6v3_1Gw3_88XuBza?dl=0).
Simulations to predict changes in Pol II ChIP-seq and nascent transcript RNA FISH given a set of regulated steps of transcription (as in Figure 1A-B, Supplementary Figure 3) are available at https://www.dropbox.com/sh/eik9abis3abfmx9/AADJRhC-3cy-Ym2_sff1cmtXa?dl=0.
Pol II ChIP-seq data generated for this publication are available at GSE121706. Pol II ChIP-seq data and H3K27ac ChIP-seq data generated in (Hsiung et al. 2016) are available at GSE83293. DNAse-seq data generated in (Hsiung et al. 2015) are available at GSE83293.