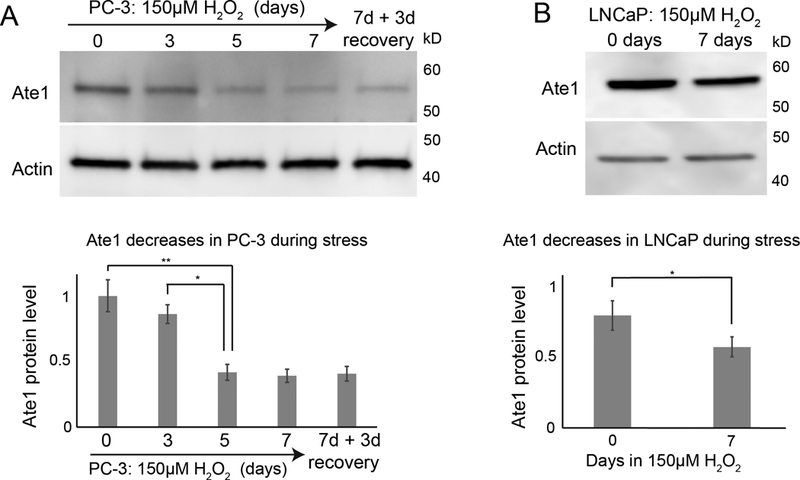
Figure 2: Ate1 is downregulated following chronic stress.

(A) Top panel is a representative Western blot showing the level of Ate1 for PC-3 cells treated with culture media supplemented with 150 μM H2O2 for 7 days then allowed to recover for 3 days in normal media. For matching time points, the “0”-treatment group was treated with H2O through the time course. Actin was used as loading control. Bottom graph shows quantification from three independent repeats. (B) LNCaP cells were treated with 150 μM H2O2 or H2O control for 7 days and Ate1 levels were measured by Western blot. Actin was used as loading control. Bottom graph shows quantification from three independent repeats. Error bars represent Standard Error of Mean (SEM). Statistical significance based on p value from the Student’s t-test: * = p<0.05, ** = p<0.01.
