

Abstract
Due to their immune-therapeutic value, adipose tissue-derived mesenchymal stromal cells (AT-MSCs) require a better characterization of their interplay with natural killer (NK) cells known to contribute to the graft-versus-leukemia effects. When cultivated together, AT-MSCs showed cellular cytotoxicity and were therefore killed by NK cells in an activating-cytokine dependent manner. In the presence of AT-MSCs, both ligands and receptors known to drive NK cell interactions were significantly altered. During this co-culture, the proliferation of NK cells was slightly reduced, while their IFN-γ and TNF-α secretion was significantly increased. NK cells displayed sustained degranulation accompanied by increased discharge of their cytolytic granules (perforin, granzymes A and B). On the other hand, activated NK cells reduced the expression of serpins C1 and B9 in AT-MSCs. Collectively, reciprocal immuno-biological alterations occur during the co-culture of NK cells and AT-MSCs. Understanding these changes will increase the safety and efficacy of cell-based immuno-oncotherapy.
Keywords: AT-MSCs, NK cells, Immunomodulation, Cell crosstalk
Introduction
Adipose tissue-derived mesenchymal stromal cells (AT-MSCs) can be easily harvested in large amounts from fat tissue with minimal invasive procedures. Being multipotent, AT-MSCs have also been shown to be immunoprivileged and genetically stable in long-term cultures, and may thus represent a promising alternative to classical MSCs as a tool for immune regenerative medicine (Ciuffi et al. 2017). Of importance, MSCs are increasingly being used as biological immunosuppressants during haematopoietic stem cell transplantation (HSCT) (Najar et al. 2017). Indeed, AT-MSCs have been shown to be attractive for treating graft-versus-host disease (GVHD), a major complication following HSCT (Blanc et al. 2004; Fang et al. 2007). In the early reconstitution phase following HSCT, activation of natural killer (NK) cells is likely to contribute to graft-versus-leukaemia (GVL) effects that are necessary to avoid minimal residual disease and leukaemic relapse (Verneris 2013). Thus, there is a clear crosstalk between MSCs and immune response during disease pathogenesis and therapy that need to be well-understood (Qi et al. 2017). The functional activities of NK cells and therefore their interplay with target cells are regulated by a fine balance of several activating and inhibitory receptors as well as by a series of pro-inflammatory cytokines (Watzl et al. 2014). As the etiology of GVHD involves an allogeneic cytotoxic reaction of donor lymphocytes, the preventive or therapeutic strategy for this issue should rely on tolerance induction by MSCs without eliminating the GVL effect (Amorin et al. 2014). Surprisingly, bone marrow-derived MSCs rather than adipose tissue-derived ones had this capacity to attenuate GVHD while preserving GVL following experimental allogeneic bone marrow transplantation (Auletta et al. 2015).
Given these findings, we used an in vitro model of AT-MSC and activated NK cell co-culture to understand better their cellular interplay and particularly investigate how they would affect their respective immuno-biological features. Despite the significant immune-regulatory role exerted by AT-MSCs, clear conclusions could not be drawn regarding stem/progenitor cell and NK cell interactions (Sotiropoulou et al. 2006; Spaggiari et al. 2006; Tseng et al. 2010; Najar et al. 2013; Lupatov et al. 2017). In this study, we demonstrated that several important features such as the viability of AT-MSCs and functionality of NK cells were critically affected following their co-culture and may therefore explain the adverse effects regarding GVL. Thus, by improving our knowledge of the relationship between these two populations, we will enhance the therapeutic value of AT-MSCs, particularly for keeping an appropriate balance between GVHD suppression and GVL maintenance both of which will likely influence the issue of the clinical setting after HSCT.
Materials and methods
Tissue samples
Fresh adipose tissue was obtained from 7 donors (all females, 45 ± 6 years) undergoing a liposuction procedure in the context of aesthetic surgery and were processed within a few hours for MSC isolation.
AT-MSC isolation, culture and expansion and characterization
The isolation, culture and expansion of MSCs are based on their high capacity to adhere, migrate and self-renewing as previously described (Busser et al. 2014). Briefly, fat tissue was washed extensively with an equal volume of Dulbecco’s Phosphate-Buffered Saline (DPBS) (Lonza, Belgium), and the extracellular matrix was digested with 0.075% collagenase A (Roche Applied Science, Vilvoorde, Belgium) for 30 min at 37 °C. The samples were centrifuged at 1200×g for 10 min in complete culture medium consisting of low-glucose Dulbecco’s Modified Eagle Medium (DMEM-LG) (Lonza, Belgium) supplemented with 10% (v/v) heat-inactivated (30 min at 56 °C with mixing) Fetal Bovine Serum (FBS), 2 mM l-glutamine, and 0.5% (v/v) antibiotic (penicillin and streptomycin)/antimycotic (Amphotericin B) solution (all from Life Technologies). After discarding the supernatants containing oil, primary adipocytes and collagenase solution, the stromal-vascular fraction (SVF) pellet was then cultured at a cell density of 2 × 10⁴ cells/cm2 in complete culture medium as previously described. After 5 days of culture at 37 °C in a 5% CO2 humidified atmosphere, floating adipose tissue from the SVF were eliminated through gentle washing with culture medium. Cultures were pursued until 80–90% of confluency, changing the medium twice a week to remove non-adherent cells. When sub-confluence was reached, adherent cells were harvested after detachment with TrypLE Select solution (Lonza, Belgium) for 10 min at 37 °C and then washed in DPBS by being centrifuged at 1200×g for 10 min. The resulting cell pellet was recovered and the number of viable cells was counted by using the Trypan Blue dye exclusion staining (Thermo Fisher Scientific, Belgium). Subsequently, conducting prolonged in vitro expansion by performing several cell passaging is a necessary step to obtain a high and sufficient number of cells. Thus, cells were expanded until passage 3 (P3) by replating at low density (200 cells/cm2) using the complete culture medium as well as the same conditions of incubation (at 37 °C in a 5% CO2 humidified atmosphere).
AT-MSC characterization
The characterization of AT-MSCs was defined according to the joint statement of the International Federation for Adipose Therapeutics and Science (IFATS) and the International Society for Cellular Therapy (ISCT) (Bourin et al. 2013). First, the plastic-adherent fibroblast-like morphology of the cultured cells was assessed by phase contrast microscopy (100×) using a fluorescence inverted microscope (Leica, Diegem, Belgium). Second, the phenotype of the cells has to be determined by flow cytometry using the following monoclonal antibodies: anti-CD45-FITC and anti-HLA-DR-PE (Exalpha Biologicals, Maynard, MA), anti-CD34-PE and anti-CD73-PE (BD Biosciences Pharmingen, San Diego, CA, USA), anti-CD14-PE, anti-CD19-PE, anti-CD105-FITC and anti-CD90-PE (R&D systems, Minneapolis, MN, USA). Third, their multilineage potential into osteogenic, adipogenic and chondrogenic lineages was confirmed by appropriate culture induction and staining. For the osteogenic differentiation: 5000 cells/well were seeded in a 24 well plate with the complete culture medium as previously defined. After 5 days, the medium was totally removed and replaced by the osteogenic medium (StemMACS OsteoDiff Media) (Miltenyi Biotec, Germany). The cells were fed weekly with fresh osteogenic medium. After 21 days, the mineralization of the extracellular matrix was assessed after Alizarin Red staining. First, the cells were washed in DPBS and fixed for 5 min in 70% ethanol at room temperature (RT) followed by several washes in H2O. Then, the cells were stained in 40 mM Alizarin red with pH = 4.2 (Sigma-Aldrich) for 15 min at RT, rinsed in H2O, and then air-dried. The red staining was examined by light microscopy. For the adipogenic differentiation: 5000 cells/well were plated in a 24 well plate with the complete culture medium as previously defined. After 5 days, the medium was completely discarded and replaced with the adipogenic medium (StemMACS AdipoDiff Media) (Miltenyi Biotec, Germany). The cells were fed weekly with fresh adipogenic medium. At day 7, the cells were stained with Oil Red O solution (Sigma) after fixing (8% formaldehyde). The formation of lipid vacuoles were then checked by light microscopy. For the chondrogenic differentiation: 150,000 cells were cultured in the tip of a 15 mL conical tube (Greiner) containing the chondrogenic medium (StemMACS ChondroDiff Media) (Miltenyi Biotec, Germany) to enable micromass cell culture. The cells were re-suspended carefully and cultured at 37 °C in a 5% CO2 humidified atmosphere with the cap slightly screwed. Half of the chondrogenic medium was replaced weekly. At day 21, aggregates were stained with Alcian blue (Sigma) after formaldehyde fixation to verify cartilage proteoglycans synthesis.
Blood samples
Buffy coat suspensions derived from fresh whole peripheral blood of healthy donors (n = 10) were provided by the “service francophone du sang de la Croix rouge de Belgique”.
Immune cell isolation, culture and activation
Peripheral blood mononuclear cells (PBMCs) were isolated by density-gradient centrifugation (LinfoSep, Biomedics, Madrid, Spain) and washed in Hanks’ Balanced Salt Solution (HBSS) (Lonza Europe, Verviers, Belgium). The number of viable PBMCs was counted by using the Trypan Blue dye exclusion staining (Thermo Fisher Scientific).
Following the manufacturer’s instructions, the magnetic-activated cell sorting (MACS) system technology (Miltenyi Biotec GmbH, Bergisch, Germany) was used as a method for the separation of different immune cell populations depending on their surface antigens (CD molecules). The NK Cell Isolation Kit (Miltenyi Biotec GmbH, Bergisch, Germany) was used for the untouched highly pure isolation of CD56+ NK cells from PBMCs by depletion. CD3+ T-cells and CD14+ monocyte were purified from PBMCs by positive selection, using the CD3 and CD14 microbeads respectively (Miltenyi Biotec, Germany). The purity of the selected cells was determined by flow cytometry using the following monoclonal antibodies: anti-CD3-PE, anti-CD14-PE, and anti-CD56-PC5 (all from Miltenyi Biotec).
CD56+ NK cells were activated with either IL-2 (10 ng/mL; R&D Systems), IL-15 (20 ng/mL; R&D Systems), IL-12 (20 ng/mL; R&D Systems) or IL-21 (30 ng/mL; eBioscience) before being added to AT-MSC culture. PBMCs were activated with the mitogen phytohemagglutinin-P (PHA-P) (5 µg/mL; Sigma) in the presence of IL-2 (10 ng/mL; R&D Systems).
Co-culture model of AT-MSCs and immune cells
AT-MSCs, obtained after two passages (P2), were plated at 5 × 10⁴ cells/cm2 in a flat-bottomed 24-well plate for overnight adherence in complete culture medium as previously defined. After this period, the medium was removed and 25 × 104 of either PBMCs, CD56+ NK cells, CD3+ T cells or CD14+ monocytes were added to the plated MSCs (cell ratio of 5:1). This co-culture has been run for 5 days in Roswell Park Memorial Institute (RPMI) 1640 medium (Lonza) supplemented with 10% FBS and 0.5% (v/v) antibiotic (penicillin and streptomycin)/antimycotic (Amphotericin B) solution (all from Life Technologies) at 37 °C in a 5% CO2 humidified atmosphere.
Cell viability assessment
The viability was assessed using the trypan blue exclusion (Lonza, Belgium) and the 7 amino-actinomycin (7-AAD) staining (BD Biosciences). After the co-culture, the supernatant was removed, the cell layer washed with DPBS (Lonza, Belgium), and the adherent cells were harvested after detachment with TrypLE Select solution (Lonza, Belgum) for 10 min at 37 °C and then washed in DPBS by being centrifuged at 1200×g for 10 min. The cell pellet was re-suspended in complete medium and stained with 0.4% trypan blue solution (Lonza, Belgium) according to the manufacturer’s protocol. The percentage of viable cells was calculated by the formula = [1.00 − (Number of blue cells ÷ Number of total cells)] × 100. The viability was confirmed by using the BD Via-Probe™ viability staining solution (7-AAD) as recommended by the manufacturer. In this case, after centrifugation, the cells were first stained with an anti-CD45-VioBlue (Miltenyi Biotec, Germany)-labelled monoclonal antibody to exclude immune cells and then stained with the 7-AAD solution. Absolute volumetric cell counting was performed with the MACSQUANT® flow cytometer.
Lactate dehydrogenase assay for NK cell cytotoxic activity
The CytoTox 96 Non-Radioactive Cytotoxicity Assay kit (Promega Benelux) quantitatively measures the release of lactate dehydrogenase (LDH), a stable cytosolic enzyme, upon cell lysis. A co-culture (5:1 cell ratio) of CD56+ NK cells as effector (E) cells and AT-MSCs as target (T) cells was performed during 4 h at 37 °C in a 5% CO2 humidified atmosphere. After this incubation, supernatants were collected and incubated with the substrate mix for 30 min. The reaction was then stopped by adding 1 M acetic acid. Triplicates of each E:T condition were analyzed to measure the LDH release. Spontaneous LDH release from effector cells was measured by incubating the effector cells in the absence of target cells. Spontaneous LDH release from target cells was measured by incubating the target cells in the absence of effector cells. The maximum LDH release from target cells was determined by adding lysis solution (0.9% (v/v) Triton X-100). The amount of LDH release was measured in a plate reader, and the percent of cytotoxicity was calculated for each E:T condition according to the following formula: cytotoxicity (%) = 100% × [(Experimental − Effector Spontaneous − Target Spontaneous)/(Target Maximum − Target Spontaneous)].
Immuno-phenotyping of NK cells and AT-MSCs
The expression of the NK ligands by AT-MSCs was assessed by flow cytometry using the following human monoclonal antibodies: CD112-PE and CD155 (BioLegend Europe, San Diego, CA, USA), and ULBP-3-PE (R&D Systems Europe, Abington, United Kingdom).
The pattern of killer cell immunoglobulin-like receptors (KIRs) presented by CD56+ NK cells was determined by flow cytometry using the following human monoclonal antibodies: CD226 (DNAM-1)-APC (Miltenyi Biotec, Germany), CD314 (NKG2D)-APC, CD335 (NKp46)-PE, CD336 (NKp44)-PC5 and CD337 (NKp30)-PE (Beckman Coulter, Marseille Cedex, France), and HLA-ABC-PE-Cy5 (eBioscience, San Diego, CA, USA).
The expression of leukocyte-associated Ig-like receptor (LAIR) by NK cells was determined by flow cytometry using the following human monoclonal antibodies: CD305 (LAIR-1)-PerCP/Cy5.5 (BioLegend, Europe) and CD306 (LAIR-2) -FITC (Sino Biological, Inc., Beijing, China).
The expression profile of serpin by AT-MSCs was determined by flow cytometry using the following human monoclonal antibodies (Abcam): serpin A1 (anti-alpha 1 antitrypsin)-FITC, serpin C1 (anti-antithrombin III) and serpin B9 (proteinase inhibitor 9). PE-conjugated goat anti-mouse F(ab′)2 was used as a secondary antibody (Dako, Belgium).
NK cell proliferation analysis by CFSE labelling
The carboxyfluorescein diacetate-succinimidyl ester (CFDA-SE) labelling assay (CellTraceTM CFSE Cell Proliferation Kit) (Life Technologies, Merelbeke, Belgium) was used to determine the proliferation of CD56+ NK cells according to the manufacturer’s instructions. Briefly, activated NK cells were labelled with 10 μM CFDA-SE dye (10 min at 37 °C) before co-incubation with AT-MSCs according the model of co-culture. After 5 days, NK cells were recovered and their proliferation determined by flow cytometry analysis of their CFSE fluorescence. The inhibitory potential (IP) of AT-MSCs for each NK cell activation condition was therefore calculated.
ELISA quantification of IFN-γ, TNFα, perforin and granzymes
The levels of IFN-γ (R&D Systems; Minneapolis, USA; the minimum detectable concentration is less than 8.0 pg/mL), TNFα (R&D Systems; Minneapolis, USA; 1.6 pg/mL sensitivity), perforin (Abcam; France; 40 pg/mL), and granzymes A and B (Biovendor; Germany; 0.4 pg/mL and 0.2 pg/mL, respectively) were measured in the different cell culture supernatants issued from the co-culture models using the ELISA techniques according to the manufacturer’s guidelines.
NK cell degranulation assay
The BD FastImmune CD107a APC (BD Biosciences, San Jose, CA, USA) reagent is designed for the detection of cytolytic activity of immune cells by measuring degranulation, a prerequisite for cytolysis. Degranulating cells are identified by their surface expression of CD107a, which is a lysosomal associated membrane protein (LAMP-1) residing in cytolytic granule membranes located within the cytoplasm. CD107a is considered as a sensitive and functional marker for the identification of NK cell degranulation activity. Briefly, after co-culture with AT-MSCs, NK cells were recovered and incubated for 4 h at 37 °C in the presence of CD107a APC-labelled monoclonal antibody and then it expression analyzed by flow cytometry according to the manufacturer’s instructions.
Measurement of ROS
The generation of reactive oxygen species (ROS) within AT-MSCs is measured based on the use of 2′,7′-dichlorodihydrofluorescein diacetate (DCF-DA) probe (Sigma). Briefly, after co-culture with CD56+ NK cells, AT-MSCs were recovered and stained with 15 μM DCF-DA probe for 15 min at 37 °C according to the manufacturer’s guidelines. The cells were then washed with DPBS (Lonza, Belgium) and DCF fluorescence intensity analyzed by flow cytometry.
Flow cytometry analysis
After cell labelling, data were acquired and analyzed on a MacsQuant analyser (Miltenyi Biotec, Germany).
Statistical analysis
Data are presented as mean ± SEM of at least seven independent experiments and analyzed, based on Kolmogorov–Smirnov and Shapiro–Wilk Normality tests, using paired one way ANOVA followed by Bonferroni post-test for pairwise comparisons for experiments including more than two conditions or Student’s t test for experiments including two conditions. p values < 0.05 (*), < 0.01 (**), < 0.001 (***) were considered significant.
Results
Characterization of AT-MSCs
After expansion, adherent cells from adipose-derived stromal vascular fraction (SVF) culture showed a typical fibroblast-like shape (Fig. 1a). Flow cytometry analysis (Fig. 1b) demonstrated that these cells were positive (> 95%) for CD73, CD90 and CD105 but negative (< 5%) for CD14, CD19, CD34, CD45 and HLA-DR. Moreover, these MSCs exhibited multilineage potential, as they were able to generate adipocytes, osteoblasts and chondrocytes (Fig. 1c). After 21 days of osteogenic differentiation (A), a matrix mineralization following calcium deposits was observed by Alizarin red staining. After 10 days of adipogenic differentiation (B), several lipid vacuoles were revealed by Oil Red O staining. After 21 days of chondrogenic differentiation (C), the production of a proteoglycans-based extracellular matrix was shown by Alcian blue staining.
Fig. 1.
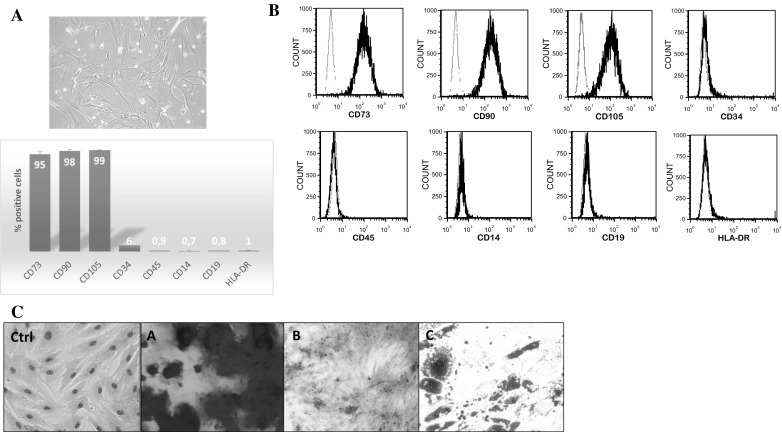
Characterization of AT-MSCs. a Morphology of the AT-MSC was observed by phase contrast microscopy (100×) using a fluorescence inverted microscope. b Flow cytometry analysis was performed to characterize the phenotype of MSCs (gray line: isotype fluorescence; black line: antibody-specific fluorescence). c Representative images showing the multilineage potential of AT-MSCs
Death of AT-MSCs is induced by activated PBMC-derived NK cells
In the presence of activated PBMCs rather than un-activated ones, the co-culture became almost free of AT-MSCs (Fig. 2a). In this model, activated PBMCs substantially reduced the percentage of viable AT-MSCs by more than half (decrease from 100% to 36 ± 8.5% viable cells) (Fig. 2b). Following magnetic separation by MACS technology, CD3+ T-lymphocytes, CD14+ monocytes and CD56+ NK cells derived from PBMCs demonstrated high purity as shown by CD3 (99%), CD14 (97%) and CD56 (96%) positivity (Fig. 2c). Neither CD3+ T cells nor CD14+ monocytes altered the viability of AT-MSCs whilst CD56+ NK cells induced a drastic decrease in the percentage of viable AT-MSCs (from 100% to 18.6 ± 1.9%) (Fig. 2d).
Fig. 2.
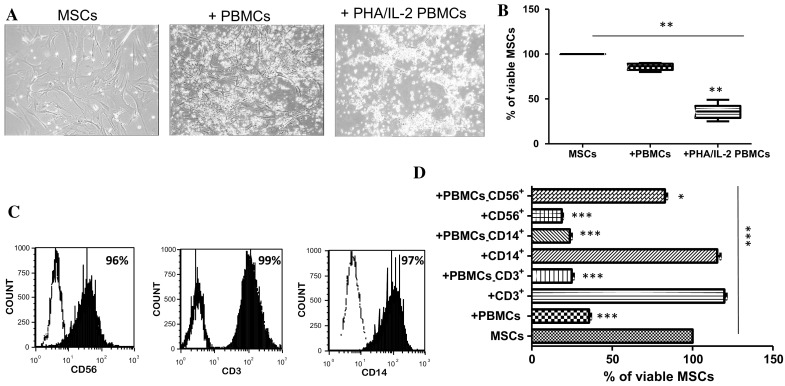
Role of PBMCs in AT-MSC death. AT-MSCs were cultivated, for 5 days, alone or in the presence of un-activated or PHA/IL-2-activated PBMCs or activated purified immune cells. a The morphology of AT-MSCs during the co-culture with PBMCs (100× objective). b The cell viability of AT-MSCs measured by trypan blue exclusion assay after the co-culture with PBMCs. c The purity of T-lymphocytes, monocytes and NK cells derived from PBMCs as determined by flow cytometry. d AT-MSCs were cultivated, for 5 days, either alone or in the presence of AT-MSCs after co-culture with PHA/IL-2-activated PBMCs, PHA/IL-2-activated PBMCs lacking CD3, CD14 or CD56 populations, or IL-2 activated purified CD3+, CD14+ or NK cells was measured by trypan blue exclusion assay. Data represent mean percentage ± SEM of viable MSCs from seven independent experiments, each performed in triplicate. *p < 0.05; ***p < 0.001 versus MSCs; paired one way ANOVA followed by Bonferroni post-test
Cytotoxicity and cell death of AT-MSCs induced by cytokine-activated NK cells
In the presence of IL-2-, IL-12-, IL-15- and IL-21-activated CD56+ NK cells, the co-culture model showed important loss of AT-MSCs (Fig. 3a). In contrast to un-activated CD56+ NK cells, those activated with IL-2 and IL-15 have significantly decreased the percentage of viable AT-MSCs (from 100% to 47.8 ± 5.5% and 50.1 ± 4.4%, respectively) (Fig. 3b). Consistently, AT-MSCs demonstrated high 7-AAD staining following their co-culture with IL-2- or IL-15-activated CD56+ NK cells (increase to 64.3 ± 2.3% or 54 ± 1.5%, respectively) (Fig. 3c). Regardless of their activating cytokine, CD56+ NK cells induced considerable cellular cytotoxicity in AT-MSCs (Fig. 3d).
Fig. 3.

Effects of cytokine activated NK cells on AT-MSCs. AT-MSCs were cultivated, for 5 days, either alone or in the presence of un-activated or IL-2-, IL-12-, IL-15- or IL-21-activated NK cells. a Morphology of AT-MSCs (100× objective). b AT-MSC viability measured by trypan blue exclusion assay. c AT-MSC mortality as determined by 7 amino-actinomycin (7-AAD) staining assay. d Lactate dehydrogenase (LDH) assay for measuring cellular toxicity. The percent of cytotoxicity was calculated as described in “Materials and methods” section. Data represent mean percentage ± SEM of seven independent experiments, each performed in triplicate. **p < 0.01; ***p < 0.001 versus MSCs; paired one way ANOVA followed by Bonferroni post-test
Decreased CD112 and CD155 expression in AT-MSCs co-cultured with NK cells
Exceptionally, ULBP3 was not expressed in AT-MSCs (< 3% positive cells), with no significant changes upon co-culture with activated NK cells (Fig. 4a). AT-MSCs showed high constitutive expression of CD112 (92.7 ± 2.5%) and CD155 (83.3 ± 2.1%) which were found to be significantly decreased following co-culture with activated CD56+ NK cells in a cytokine-dependent manner (Fig. 4b, c). IL-12- and IL-21-activated NK cells had no significant impact on CD112 and CD155 expression. Following co-culture with IL-2- or IL-15-activated CD56+ NK cells, a more striking down-regulation of CD112 (63.7 ± 4.1% and 29 ± 1%, respectively) and CD155 (45.3 ± 3.1% and 46.3 ± 1.5%, respectively) expression was observed in AT-MSCs.
Fig. 4.
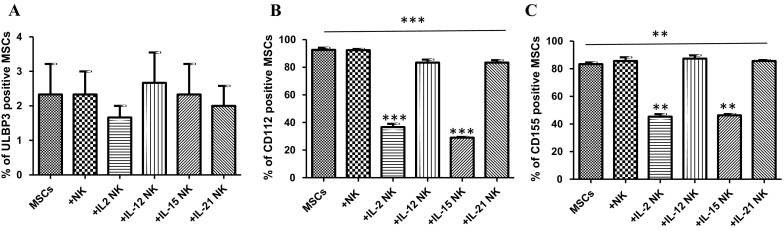
AT-MSC expression profile of different NK ligands. AT-MSCs were cultivated, for 5 days, alone or in the presence of un-activated or IL-2-, IL-12-, IL-15- or IL-21-activated NK cells. The expression of CD112, CD155 and ULBP3 antigens on AT-MSCs was investigated by flow cytometry using the monoclonal antibodies indicated in the “Materials and methods” section.The data are presented as the mean ± SEM of the percentage of MSCs that expressed a given marker from seven independent experiments, each performed in triplicate. **p < 0.01; ***p < 0.001 versus MSCs; paired one way ANOVA followed by Bonferroni post-test
Impairment of pattern of killer cell immunoglobulin-like receptors (KIRs) expression on NK cells co-cultured with AT-MSCs
After cytokine activation, the expression of KIRs by CD56+ NK cells was highly increased. During the co-culture with AT-MSCs, the expression profiles of CD226, CD314, CD336 and CD337 varied considerably depending on the cytokine (IL-2, IL-12, IL-15 or IL-21) used to activate the CD56+ NK cells (Table 1). No significant changes in the expression of CD335 was observed in our model of co-culture.
Table 1.
Effect of AT-MSCs on KIR expression
| NK cells | Un-activated | +IL-2 | +IL-12 | +IL-15 | +IL-21 |
|---|---|---|---|---|---|
| CD226 | |||||
| No MSCs | 48.4 ± 2.4 | 82 ± 2.5 | 72.2 ± 3.2 | 69.8 ± 3.4 | 79.8 ± 2.5 |
| +MSCs | 54.6 ± 7.1 | 30 ± 4.3** | 39.3 ± 2.1** | 61.6 ± 3.5 | 39.3 ± 4.5** |
| CD314 | |||||
| No MSCs | 27.4 ± 2.1 | 55.2 ± 3.5 | 35 ± 4 | 51.4 ± 2.7 | 49.4 ± 2.1 |
| +MSCs | 26.3 ± 4.5 | 17.3 ± 3.1*** | 23.7 ± 3.2 | 15 ± 3** | 32 ± 1* |
| CD335 | |||||
| No MSCs | 29.6 ± 1.1 | 60.2 ± 2.5 | 47.2 ± 2.9 | 53.4 ± 3.6 | 51.6 ± 2.4 |
| +MSCs | 30.6 ± 2.1 | 65.3 ± 3.5 | 54.7 ± 1.2 | 51.3 ± 5.12 | 52.3 ± 3.2 |
| CD336 | |||||
| No MSCs | 41 ± 1.6 | 66 ± 3.2 | 56 ± 4.4 | 71.6 ± 2.4 | 58.2 ± 2.6 |
| +MSCs | 42.3 ± 3.1 | 40.3 ± 1.5** | 44.3 ± 4.5* | 36.3 ± 3.5** | 41 ± 6* |
| CD337 | |||||
| No MSCs | 25.2 ± 3.2 | 62.8 ± 3.7 | 35 ± 3.8 | 69.6 ± 2.3 | 35 ± 3.4 |
| +MSCs | 16 ± 2.5 | 44 ± 2.1** | 18.3 ± 2.5* | 20.7 ± 3.1** | 32 ± 3.6 |
Un-activated or IL-2-, IL-12-, IL-15- or IL-21-activated NK cells were cultivated, for 5 days, in the absence or presence of AT-MSCs. The expression of CD226, CD314, CD335, CD336 and CD337 antigens on NK cells was investigated by flow cytometry using the monoclonal antibodies indicated in the “Materials and methods” section. The data are presented as the mean ± SEM of the percentage of NK cells that expressed a given marker from seven independent experiments each performed in triplicate
*p < 0.05; **p < 0.01; ***p < 0.001 versus NK, NK IL-2/NK IL-12/NK IL-15/NK IL-21 activated cells; paired student’s t-test
The percentage of IL-2-, IL-12- and IL-21-activated CD56+ NK cells expressing CD226 (82 ± 2.5%, 72.2 ± 3.2% and 79.8 ± 2.5%, respectively) has been significantly decreased after co-culture with AT-MSCs to reach only 30 ± 4.3%, 39.3 ± 2.1% and 39.3 ± 4.5%, respectively.
The percentage of IL-2-, IL-15- and IL-21-activated CD56+ NK cells expressing CD314 (55.2 ± 3.5%, 51.4 ± 2.7% and 49.4 ± 2.1%, respectively) has been substantially reduced after co-culture with AT-MSCs to achieve 17.3 ± 3.1%, 15 ± 3% and 32 ± 1%, respectively.
The percentage of IL-2-, IL-12-, IL15- and IL-21-activated CD56+ NK cells expressing CD336 (66 ± 3.2%, 56 ± 4.4%, 71.6 ± 2.4% and 58.2 ± 2.6%, respectively) has been markedly diminished following co-culture with AT-MSCs to gain 40.3 ± 1.5, 44.3 ± 4.5%, 36.3 ± 3.5% and 41 ± 1.6%, respectively.
The percentage of IL-2- IL-12- and IL-15- activated CD56+ NK cells expressing CD337 (62.8 ± 3.7%, 35 ± 3.8% and 69.6 ± 2.3%, respectively) has been strongly lowered upon co-culture with AT-MSCs to attain 44 ± 2.1%, 18.3 ± 2.5% and 20.7 ± 3.1%, respectively.
Unchanged LAIR expression on NK cells co-cultured with AT-MSCs
Un-activated CD56+ NK cells displayed constitutively higher CD305 expression (98.9 ± 1.6%) than CD306 (67.2 ± 8.3%) which was specifically increased after IL-2 activation (95.1 ± 3.5%). In the co-culture model, AT-MSCs had no influence on such expression profiles (Fig. 5).
Fig. 5.

Effect of AT-MSCs on LAIR expression. The expression of CD305 and CD306, on un-activated NK cells as well as on IL-2 activated NK cells being cultivated in the absence or presence of AT-MSCs, for 5 days, was evaluated by flow cytometry using the monoclonal antibodies indicated in the “Materials and methods” section. Data represent mean ± SEM of the percentage of NK cells that expressed a given marker from seven independent experiments, each performed in triplicate. **p < 0.01 versus NK cells; paired student’s t-test
Reduced proliferation of NK cells co-cultured with AT-MSCs
Following their co-culture with AT-MSCs, a slight decrease in the proliferation of IL-2- (from 61.7 ± 0.9% to 49.2 ± 1.5%, meaning an IP of 20%), IL-12- (from 85.6 ± 0.6% to 66 ± 2.9%, indicating an IP of 23%), IL-15- (from 77.1 ± 1.4% to 51.8 ± 1%, representing an IP of 33%) and IL-21- (from 82.7 ± 0.8% to 67.6 ± 1.4%, illustrating an IP of 18%) activated CD56+ NK cells was observed (Fig. 6).
Fig. 6.

Effect of AT-MSCs on NK cell proliferation. IL-2-, IL-12-, IL-15- or IL-21-activated NK cells were cultivated, for 5 days, in the absence or presence of AT-MSCs. NK cells were previously labelled with CFSE and then analyzed by flow cytometry. Data represent mean ± SEM of the percentage of NK cell proliferation from seven independent experiments, each performed in triplicate. *p < 0.05 versus NK IL-2/NK IL-12/NK IL-15/NK IL-21 activated cells; paired student’s t-test
Increased IFN-γ and TNFα secretion from NK cells co-cultured with AT-MSCs
IL-2-activated CD56+ NK cells constitutively secreted more IFN-γ (183.3 ± 1.3 pg/mL) than TNFα (59.5 ± 4.5 pg/mL). Upon co-culture with AT-MSCs, the level of IFN-γ was substantially increased to 1274.4 ± 88.1 pg/mL (7-fold) whereas the level of TNFα slightly raised to 80.6 ± 6.2 pg/mL (Fig. 7).
Fig. 7.

Effect of AT-MSCs on NK cell cytokine secretion. IL-2-activated NK cells were cultivated, for 5 days, in the absence or presence of AT-MSCs. Cell-free supernatants were collected and assayed by ELISA for their content of IFN-γ and TNFα. Data represent mean ± SEM of the cytokine concentration from seven independent experiments, each performed in triplicate. **p < 0.01; ***p < 0.001 versus NK IL-2 activated cells; paired student’s t-test
High degranulation activity of NK cells co-cultured with AT-MSCs
The percentage of degranulation by IL-2-activated CD56+ NK cells constantly increased to a maximum of 37.4 ± 1.4% at day 5 (Fig. 8). The presence of AT-MSCs significantly enhanced such degranulation in a consistent and time-dependent fashion. The percentage of degranulation increased from 13.2 ± 1.5% to 22.3 ± 1.7% at day 1, from 22.1 ± 1.4% to 33.1 ± 1.5% at day 2, from 29 ± 1.56% to 41.4 ± 1.53% at day 3, from 31.5 ± 1.4% to 44.2 ± 2.3% at day 4 and finally from 37.4 ± 1.4% to 53.9 ± 2.7% at day 5.
Fig. 8.

Effect of AT-MSCs on NK cell degranulation. IL-2-activated NK cells were cultivated in the presence of AT-MSCs for 5 days. NK cell degranulation assay was performed and the results were assessed by flow cytometry. Data correspond to the percentages of NK cells that have externalized CD107a during the 4 h incubation period. Data represent mean ± SEM of CD107a expression by NK cells from seven independent experiments, each performed in triplicate. **p < 0.01; ***p < 0.001 versus IL-2 NK activated cells; paired student’s t-test
Enhanced perforin and granzymes release from NK cells co-cultured with AT-MSCs
IL-2-activated CD56+ NK cells constitutively secreted significant amount of perforin (3604.1 ± 241.5 ng/mL) that was 2-fold increased (7330.1 ± 498.3 ng/mL) in the presence of AT-MSCs (Fig. 9a). The basal CD56+ NK cell secretion of granzyme A (2250 ± 177.6 ng/mL) was higher than that of granzyme B (315.7 ± 66.6) and increased to 6489.8 ± 442.7 ng/mL and 2138.3 ± 316.9 ng/mL, respectively upon co-culture with AT-MSCs (Fig. 9b, c).
Fig. 9.

Effect of AT-MSCs on NK cell-derived perforin and granzymes. IL-2-activated NK cells were cultivated, for 5 days, in the absence or presence of AT-MSCs. Cell-free supernatants were collected and assayed by ELISA for their content of Perforin (a), Granzyme A (b) and Granzyme B (c). Data represent mean ± SEM of the concentration from seven independent experiments, each performed in triplicate. *p < 0.05; ***p < 0.001 versus NK IL-2 activated cells; paired student’s t-test
Generation of reactive oxygen species in AT-MSCs co-cultured with NK cells
During their co-culture with IL-2-activated CD56+ NK cells, AT-MSCs demonstrated a slight increase in ROS generation (1.4 ± 0.06-fold).
Altered serpin expression in AT-MSCs co-cultured with NK cells
AT-MSCs expressed constitutively (Fig. 10) low serpin A1 (4.8 ± 0.5% positive cells), moderate serpin C1 (40.1 ± 5% positive cells) and high serpin B9 (70.1 ± 5.2% positive cells) amounts. In the presence of IL-2-activated CD56+ NK cells, the percentage of AT-MSCs positive for serpin C1 and serpin B9 significantly decreased to 22.3 ± 4.3% and 46.9 ± 4.4%, respectively.
Fig. 10.

Effect of NK cells on AT-MSCs expression of serpins. AT-MSCs were cultivated, for 5 days, in the absence or presence of IL-2-activated NK cells. Serpin A1, Serpin C1 and Serpin B9 expression levels were evaluated by flow cytometry using the monoclonal antibodies indicated in the “Materials and methods” section. Data represent mean ± SEM of three independent experiments, each performed in triplicate. Data represent mean ± SEM of the serpin positive MSCs from seven independent experiments, each performed in triplicate. *p < 0.05; **p < 0.01 versus MSCs; paired student’s t-test
Discussion
Immunotherapeutic strategies preserving NK cells activity but reducing T cells responses would ensure a favorable balance between GVHD and GVL following HSCT. Despite that AT-MSCs showed superior immunoregulatory effects (Menard et al. 2013), BM- but not AT-MSCs succeeded in attenuating GVHD while preserving GVL (Auletta et al. 2015). As known, GVHD is initiated by donor T lymphocyte activation, proliferation, and differentiation upon transfer to preconditioned recipients of alloHCT. With this regards, we have previously demonstrated that AT-MSCs, particularly promoted the migration of lymphocytes into their surrounding environment via upregulation of IL-8 and CCL5 production. Following their migration, T-cells interact with MSCs, which can impair lymphocyte proliferation and activation. Inflammatory T-cells appeared to be progressively suppressed, which may lead to a population of lymphocytes with a regulatory phenotype. Thus, the different steps of the lymphocyte response are modulated in way to reduce GVHD (Najar et al. 2013). Regarding NK cells and MSCs, we have previously, reported that BM-MSCs (Najar et al. 2018a), WJ-MSCs (Najar et al. 2018c) and FSK-MSCs (Najar et al. 2018b) are differentially affected by NK cells and that distinct reciprocal alterations are noted. In this study, we investigated the immunological features of NK cells and AT-MSCs following their in vitro co-culture.
Although few studies have reported an inhibitory effect of AT-MSCs on NK cells function and proliferation (DelaRosa et al. 2012; Ribeiro et al. 2013; Blanco et al. 2016), here, we showed that AT-MSCs could enhance NK cells regulatory and cytotoxic role. It is noteworthy that in vitro and in vivo studies have shown many discrepancies regarding the outcome of NK cell and MSC crosstalk that are likely depending on the experimental conditions (Thomas et al. 2014). Similarly to T cells (Najar et al. 2009), the immunosuppressive effects of MSCs on NK cell biology occur at high MSC:NK cell ratios, while at lower ratios the suppressive effect is low or undetectable and a possible stimulating effect could be exerted (Poggi and Zocchi 2014). In the present study, AT-MSCs reinforced the ability of NK cells to secrete IFN-γ and TNF-α (Ikeda et al. 2002; Waters et al. 2013) which are essential for tumor eradication via stimulation of other NK cells, thus accounting for GVL (Wang et al. 2012). Besides its ability to promote GVL, IFN-γ could also inhibit GVHD (Yang et al. 2005; Lu and Waller 2009). Consistently, we observed that AT-MSCs enhanced the cytolytic capacity of NK cells as monitored by the increased CD107 expression, perforin release and granzymes A and B discharge. However, the limited capacity of AT-MSCs to inhibit NK cell proliferation could be paralleled by the reduced viability of AT-MSCs as well as the partial down-regulation of the expression of specific KIRs on NK cells during the co-culture. The rapid disappearance of MSCs after their infusion is likely associated with the susceptibility to lysis by NK cells (Hoogduijn et al. 2011). The reduced number and viability of AT-MSCs as well as their cytotoxic state, based on the release of LDH and ROS production, are all indicators of NK cell cytotoxicity. This is consistent with previous data showing that, AT-MSCs are lysis-sensitive targets for activated NK cells, whereas non-activated NK cells have no effects (Hoogduijn et al. 2011). Consistently, other immune cells such as activated T cells (Valencic et al. 2014) or polarized macrophages (Freytes et al. 2013) can modulate MSCs function and viability. For instance, Valencic et al. (2014) showed that the growth and survival of bone marrow MSCs can be inhibited upon the addition of pre-activated lymphocytes or their conditioned medium suggesting an inhibitory role of T-cell derived soluble mediators. Altogether, these observations corroborate the view that immune activation status of the recipient before and after allograft transplantation is relevant to the survival and functions of implanted allo-MSCs (Crop et al. 2011). In this context, several strategies for rescuing MSCs from NK cell cytotoxic activity have been described (Jewett et al. 2010; Noone et al. 2013; Giuliani et al. 2014). Intriguingly, AT-MSCs-mediated expression of different serpins, a family of protease inhibitors that control the activity of granzymes (Kaiserman and Bird 2010) was altered with serpins C1 and B9 levels being decreased after co-culture with activated NK cells. Indeed, this reduced expression of serpins may lead to exacerbated effects of granzymes, thus reducing the ability of MSCs to escape NK cell-mediated lysis. For clinical applications, reduced viability of MSCs may alter their therapeutic efficiency. Thus, a major prospect for overcoming this challenge is the potentiation of MSC defense strategies by, for example, enhancing the expression of serpins (Chuang et al. 2013; Bose 2015).
Conclusion
Our results show that AT-MSCs could enhance NK cells regulatory and cytotoxic activity. From a clinical point of view, our observations suggest that administration of AT-MSCs following allogenic-HSCT should enhance GVL while reducing GVHD, therefore representing an important immunological issue for the treatment of hematologic malignancies.
Acknowledgements
We thank Karlien Pieters for her technical assistance.
Abbreviations
- AT
Adipose tissue
- TNF
Tumor necrosis factor
- GVL
Graft-versus-leukemia
- GVH
Graft-versus-host
- IFN
Interferon
- MSCs
Mesenchymal stromal cells
- NK
Natural killer
- PBMCs
Peripheral blood mononuclear cells
- ROS
Reactive oxygen species
Funding
This project was supported by “Le Fonds National de la Recherche Scientifique, F.R.S.-FNRS” and the “Télévie”.
Conflicts of interest
The authors declare that there is no conflict of interest regarding the publication of this article.
Ethical approval
All procedures performed in studies involving human participants were in accordance with the ethical standards of the ethics committee of the “Institut Jules Bordet” (Belgium) and with the 1964 Helsinki declaration and its later amendments.
Informed consent
Informed consent was obtained from all individual participants included in the study.
Footnotes
Publisher's Note
Springer Nature remains neutral with regard to jurisdictional claims in published maps and institutional affiliations.
Mehdi Najar and Mohammad Fayyad-Kazan are co-first authors with equal contribution.
Hussein Fayyad-Kazan and Laurence Lagneaux are senior co-authors.
Contributor Information
Mehdi Najar, Email: mnajar@ulb.ac.be.
Mohammad Fayyad-Kazan, Phone: 0032-474070772, Email: mfayyadk@ulb.ac.be, Email: mfayyadk@gmail.com.
Makram Merimi, Email: makram.merimi@gmail.com.
Nathalie Meuleman, Email: nathalie.meuleman@bordet.be.
Dominique Bron, Email: Dominique.Bron@ulb.ac.be.
Hussein Fayyad-Kazan, Email: hfayyadk@gmail.com.
Laurence Lagneaux, Email: laurence.lagneaux@bordet.be.
References
- Amorin B, Alegretti AP, Valim V, Pezzi A, Laureano AM, da Silva MAL, et al (2014) Mesenchymal stem cell therapy and acute graft-versus-host disease: a review. Hum Cell 27:137–150. http://www.ncbi.nlm.nih.gov/pubmed/24903975. Accessed 8 Jan 2018 [DOI] [PMC free article] [PubMed]
- Auletta JJ, Eid SK, Wuttisarnwattana P, Silva I, Metheny L, Keller MD, et al. Human mesenchymal stromal cells attenuate graft-versus-host disease and maintain graft-versus-leukemia activity following experimental allogeneic bone marrow transplantation. Stem Cells. 2015;33:601–614. doi: 10.1002/stem.1867. [DOI] [PMC free article] [PubMed] [Google Scholar]
- Blanc KL, Rasmusson I, Sundberg B, Götherström C, Hassan M, Uzunel M, Ringdén O. Treatment of severe acute graft-versus-host disease with third party haploidentical mesenchymal stem cells. Lancet (London, England) 2004;363:1439–1441. doi: 10.1016/S0140-6736(04)16104-7. [DOI] [PubMed] [Google Scholar]
- Blanco B, Herrero-Sánchez MC, Rodríguez-Serrano C, García-Martínez ML, Blanco JF, Muntión S, et al. Immunomodulatory effects of bone marrow versus adipose tissue derived mesenchymal stromal cells on NK cells: implications in the transplantation setting. Eur J Haematol. 2016;97:528–537. doi: 10.1111/ejh.12765. [DOI] [PubMed] [Google Scholar]
- Bose K (2015) Proteases in apoptosis: pathways, protocols and translational advances, 1st edn. Springer
- Bourin P, Bunnell BA, Casteilla L, Dominici M, Katz AJ, March KL et al (2013) Stromal cells from the adipose tissue-derived stromal vascular fraction and culture expanded adipose tissue-derived stromal/stem cells: a joint statement of the International Federation for Adipose Therapeutics and Science (IFATS) and the International Society for Cellular Therapy (ISCT). Cytotherapy 15:641–648. http://www.ncbi.nlm.nih.gov/pubmed/23570660. Accessed 8 Jan 2018 [DOI] [PMC free article] [PubMed]
- Busser H, Bruyn C De, Urbain F, Najar M, Pieters K, Raicevic G, et al. Isolation of adipose-derived stromal cells without enzymatic treatment: expansion, phenotypical, and functional characterization. Stem Cells Dev. 2014;23:2390–2400. doi: 10.1089/scd.2014.0071. [DOI] [PMC free article] [PubMed] [Google Scholar]
- Chuang S-Y, Yang C-H, Chou C-C, Chiang Y-P, Chuang T-H, Hsu L-C. TLR-induced PAI-2 expression suppresses IL-1β processing via increasing autophagy and NLRP3 degradation. Proc Natl Acad Sci USA. 2013;110:16079–16084. doi: 10.1073/pnas.1306556110. [DOI] [PMC free article] [PubMed] [Google Scholar]
- Ciuffi S, Zonefrati R, Brandi ML (2017) Adipose stem cells for bone tissue repair. Clin Cases Miner Bone Metab 14:217. http://www.ncbi.nlm.nih.gov/pubmed/29263737. Accessed 8 Jan 2018 [DOI] [PMC free article] [PubMed]
- Crop MJ, Korevaar SS, de Kuiper R, Ijzermans JNM, van Besouw NM, Baan CC, et al. Human mesenchymal stem cells are susceptible to lysis by CD8(+) T cells and NK cells. Cell Transplant. 2011;20:1547–1559. doi: 10.3727/096368910X564076. [DOI] [PubMed] [Google Scholar]
- DelaRosa O, Sánchez-Correa B, Morgado S, Ramírez C, del Río B, Menta R, et al. Human adipose-derived stem cells impair natural killer cell function and exhibit low susceptibility to natural killer-mediated lysis. Stem Cells Dev. 2012;21:1333–1343. doi: 10.1089/scd.2011.0139. [DOI] [PMC free article] [PubMed] [Google Scholar]
- Fang B, Song Y, Zhao RC, Han Q, Lin Q. Using human adipose tissue-derived mesenchymal stem cells as salvage therapy for hepatic graft-versus-host disease resembling acute hepatitis. Transplant Proc. 2007;39:1710–1713. doi: 10.1016/j.transproceed.2007.02.091. [DOI] [PubMed] [Google Scholar]
- Freytes DO, Kang JW, Marcos-Campos I, Vunjak-Novakovic G. Macrophages modulate the viability and growth of human mesenchymal stem cells. J Cell Biochem. 2013;114:220–229. doi: 10.1002/jcb.24357. [DOI] [PubMed] [Google Scholar]
- Giuliani M, Bennaceur-Griscelli A, Nanbakhsh A, Oudrhiri N, Chouaib S, Azzarone B, et al. TLR ligands stimulation protects MSC from NK killing. Stem Cells. 2014;32:290–300. doi: 10.1002/stem.1563. [DOI] [PubMed] [Google Scholar]
- Hoogduijn MJ, Roemeling-van Rhijn M, Korevaar SS, Engela AU, Weimar W, Baan CC. Immunological aspects of allogeneic and autologous mesenchymal stem cell therapies. Hum Gene Ther. 2011;22:1587–1591. doi: 10.1089/hum.2011.039. [DOI] [PubMed] [Google Scholar]
- Ikeda H, Old LJ, Schreiber RD (2002) The roles of IFN gamma in protection against tumor development and cancer immunoediting. Cytokine Growth Factor Rev 13:95–109. http://www.ncbi.nlm.nih.gov/pubmed/11900986. Accessed 24 Jan 2018 [DOI] [PubMed]
- Jewett A, Arasteh A, Tseng HC, Behel A, Arasteh H, Yang W, et al. Strategies to rescue Mesenchymal Stem Cells (MSCs) and Dental Pulp Stem Cells (DPSCs) from NK cell mediated cytotoxicity. PLoS ONE. 2010;5:1–14. doi: 10.1371/journal.pone.0009874. [DOI] [PMC free article] [PubMed] [Google Scholar]
- Kaiserman D, Bird PI. Control of granzymes by serpins. Cell Death Differ. 2010;17:586–595. doi: 10.1038/cdd.2009.169. [DOI] [PubMed] [Google Scholar]
- Lu Y, Waller EK (2009) Dichotomous role of interferon-γ in allogeneic bone marrow transplant. Biol Blood Marrow Transplant 15:1347–1353. http://www.ncbi.nlm.nih.gov/pubmed/19822293. Accessed 24 Jan 2018 [DOI] [PMC free article] [PubMed]
- Lupatov AY, Kim YS, Bystrykh OA, Vakhrushev IV, Pavlovich SV, Yarygin KN, Sukhikh GT. Effect of fibroblast-like cells of mesenchymal origin of cytotoxic activity of lymphocytes against NK-sensitive target cells. Bull Exp Biol Med. 2017;162:552–557. doi: 10.1007/s10517-017-3658-5. [DOI] [PubMed] [Google Scholar]
- Menard C, Pacelli L, Bassi G, Dulong J, Bifari F, Bezier I et al (2013) Clinical-grade mesenchymal stromal cells produced under various good manufacturing practice processes differ in their immunomodulatory properties: standardization of immune quality controls. Stem Cells Dev 22:1789–1801. http://www.ncbi.nlm.nih.gov/pubmed/23339531. Accessed 24 Jan 2018 [DOI] [PMC free article] [PubMed]
- Najar M, Rouas R, Raicevic G, Boufker HI, Lewalle P, Meuleman N, et al. Mesenchymal stromal cells promote or suppress the proliferation of T lymphocytes from cord blood and peripheral blood: the importance of low cell ratio and role of interleukin-6. Cytotherapy. 2009;11:570–583. doi: 10.1080/14653240903079377. [DOI] [PubMed] [Google Scholar]
- Najar M, Raicevic G, Fayyad-Kazan H, Bruyn C De, Bron D, Toungouz M, Lagneaux L. Impact of different mesenchymal stromal cell types on T-cell activation, proliferation and migration. Int Immunopharmacol. 2013;15:693–702. doi: 10.1016/j.intimp.2013.02.020. [DOI] [PubMed] [Google Scholar]
- Najar M, Krayem M, Meuleman N, Bron D, Hélène B, Lagneaux L (2017) Immunohematology mesenchymal stromal cell-based therapy. Appl Immunohistochem Mol Morphol 1. http://www.ncbi.nlm.nih.gov/pubmed/29271793. Accessed 8 Jan 2018 [DOI] [PubMed]
- Najar M, Fayyad-Kazan M, Meuleman N, Bron D, Fayyad-Kazan H, Lagneaux L. Mesenchymal stromal cells of the bone marrow and natural killer cells: cell interactions and cross modulation. J Cell Commun Signal. 2018;12:673–688. doi: 10.1007/s12079-018-0448-4. [DOI] [PMC free article] [PubMed] [Google Scholar]
- Najar M, Fayyad-Kazan M, Meuleman N, Bron D, Fayyad-Kazan H, Lagneaux L. Immunomodulatory effects of foreskin mesenchymal stromal cells on natural killer cells. J Cell Physiol. 2018;233:5243–5254. doi: 10.1002/jcp.26305. [DOI] [PubMed] [Google Scholar]
- Najar M, Fayyad-Kazan M, Meuleman N, Bron D, Fayyad-Kazan H, Lagneaux L (2018c) Immunological impact of Wharton’s Jelly mesenchymal stromal cells and natural killer cell co-culture. Mol Cell Biochem. http://www.ncbi.nlm.nih.gov/pubmed/29380244. Accessed 19 Feb 2018 [DOI] [PubMed]
- Noone C, Kihm A, English K, O’Dea S, Mahon BP. IFN-γ stimulated human umbilical-tissue-derived cells potently suppress NK activation and resist NK-mediated cytotoxicity in vitro. Stem Cells Dev. 2013;22:3003–3014. doi: 10.1089/scd.2013.0028. [DOI] [PMC free article] [PubMed] [Google Scholar]
- Poggi A, Zocchi MR. NK cell autoreactivity and autoimmune diseases. Front Immunol. 2014;5:27. doi: 10.3389/fimmu.2014.00027. [DOI] [PMC free article] [PubMed] [Google Scholar]
- Qi K, Li N, Zhang Z, Melino G (2017) Tissue regeneration: the crosstalk between mesenchymal stem cells and immune response. Cell Immunol. http://linkinghub.elsevier.com/retrieve/pii/S0008874917302198. Accessed 8 Jan 2018 [DOI] [PubMed]
- Ribeiro A, Laranjeira P, Mendes S, Velada I, Leite C, Andrade P, et al. Mesenchymal stem cells from umbilical cord matrix, adipose tissue and bone marrow exhibit different capability to suppress peripheral blood B, natural killer and T cells. Stem Cell Res Ther. 2013;4:125–141. doi: 10.1186/scrt336. [DOI] [PMC free article] [PubMed] [Google Scholar]
- Sotiropoulou PA, Perez SA, Gritzapis AD, Baxevanis CN, Papamichail M. Interactions between human mesenchymal stem cells and natural killer cells. Stem Cells. 2006;24:74–85. doi: 10.1634/stemcells.2004-0359. [DOI] [PubMed] [Google Scholar]
- Spaggiari GM, Capobianco A, Becchetti S, Mingari MC, Moretta L. Mesenchymal stem cell–natural killer cell interactions: evidence that activated NK cells are capable of killing MSCs, whereas MSCs can inhibit IL-2-induced NK-cell proliferation. Blood. 2006;107:1484–1490. doi: 10.1182/blood-2005-07-2775. [DOI] [PubMed] [Google Scholar]
- Thomas H, Jäger M, Mauel K, Brandau S, Lask S, Flohé SB (2014) Interaction with mesenchymal stem cells provokes natural killer cells for enhanced IL-12/IL-18-induced interferon-gamma secretion. Mediators Inflamm 2014:1–11. http://www.ncbi.nlm.nih.gov/pubmed/24876666. Accessed 15 Jan 2018 [DOI] [PMC free article] [PubMed]
- Tseng H-C, Arasteh A, Paranjpe A, Teruel A, Yang W, Behel A, et al. Increased lysis of stem cells but not their differentiated cells by natural killer cells; de-differentiation or reprogramming activates NK cells. PLoS ONE. 2010;5:e11590. doi: 10.1371/journal.pone.0011590. [DOI] [PMC free article] [PubMed] [Google Scholar]
- Valencic E, Loganes C, Cesana S, Piscianz E, Gaipa G, Biagi E, Tommasini A. Inhibition of mesenchymal stromal cells by pre-activated lymphocytes and their culture media. Stem Cell Res Ther. 2014;5:3. doi: 10.1186/scrt392. [DOI] [PMC free article] [PubMed] [Google Scholar]
- Verneris MR (2013) Natural killer cells and regulatory T cells: how to manipulate a graft for optimal GVL. Hematol Am Soc Hematol Educ Progr 2013:335–341. http://www.ncbi.nlm.nih.gov/pubmed/24319201. Accessed 3 Aug 2017 [DOI] [PMC free article] [PubMed]
- Wang R, Jaw JJ, Stutzman NC, Zou Z, Sun PD (2012) Natural killer cell-produced IFN-γ and TNF-α induce target cell cytolysis through up-regulation of ICAM-1. J Leukoc Biol 91:299–309. http://www.ncbi.nlm.nih.gov/pubmed/22045868. Accessed 24 January 2018 [DOI] [PMC free article] [PubMed]
- Waters JP, Pober JS, Bradley JR (2013) Tumour necrosis factor and cancer. J Pathol 230:241–248. http://www.ncbi.nlm.nih.gov/pubmed/23460481. Accessed 24 Jan 2018 [DOI] [PubMed]
- Watzl C, Urlaub D, Fasbender F, Claus M (2014) Natural killer cell regulation—beyond the receptors. F1000Prime Rep 6: 87. http://www.ncbi.nlm.nih.gov/pubmed/25374665. Accessed 8 Jan 2018 [DOI] [PMC free article] [PubMed]
- Yang Y-G, Wang H, Asavaroengchai W, Dey BR (2005) Role of interferon-gamma in GVHD and GVL. Cell Mol Immunol 2:323–329. http://www.ncbi.nlm.nih.gov/pubmed/16368058. Accessed 24 Jan 2018 [PubMed]