Abstract
Tea tree oil (TTO) is an essential oil obtained by steam distillation from the leaves of Melaleuca alternifolia (Myrtaceae). This oil has traditionally been used for the treatment of various skin infections. The present study aimed to investigate the cytotoxic effects of TTO against two representative types of human skin cancer, namely malignant melanoma (A-375) and squamous cell carcinoma (HEp-2).To outline the basic molecular mechanism involved in apoptosis induction in A-375 and HEp-2 cell lines, Annexin V/PI staining for apoptosis detection, cell cycle analysis were monitored using flow cytometry and mRNA expression levels of the apoptosis-regulatory genes P53, BAX, and BCL-2 were determined by real-time PCR and western blot after treatment with TTO. Results showed that TTO exhibited a strong cytotoxicity towards A-375 and HEp-2 cell lines, with IC50 values of 0.038% (v/v) and 0.024% (v/v) respectively. This cytotoxicity resulted from TTO induced apoptosis in both A-375 and HEp-2 cell lines as evidenced by morphological features of apoptosis and Annexin V/PI staining results in addition to the activation of caspase-3/7 and -9, upregulation of pro-apoptotic genes (P53 and BAX) and downregulation of the anti-apoptotic gene BCL-2. Additionally, cell cycle analysis showed that TTO caused cell cycle arrest mainly at G2/M phase. Taken together, the results of this study reveal that TTO is an effective apoptosis inducer in A-375 and HEp-2 cancer cell lines, indicating that it could be a promising chemopreventive candidate to be used in topical formulations against melanoma and squamous cell cancers; however, further in vivo studies may be warranted.
Keywords: Tea tree oil, Malignant melanoma, Squamous cell carcinoma, Cell cycle analysis, Apoptosis, Chemoprevention
Introduction
The incidence and mortality of skin cancer have rapidly increased worldwide because of chemical carcinogens that generate reactive oxygen species, as well as increased UV radiation levels at the earth’s surface due to ozone depletion (Matsumura and Ananthaswamy 2004). There are many types of skin cancers, including malignant melanoma and squamous cell carcinoma (Gloster and Brodland 1996). Melanoma is the most serious type of skin cancer and develops in melanocytes. Melanoma can also form in the eyes and, rarely, in internal organs such as the intestines (Hussein 2008). Squamous cell carcinoma is a common form of skin cancer that develops in squamous cells. Untreated, squamous cell carcinoma can grow large or spread to other parts of the body, causing serious complications (Hawrot et al. 2003).
Both malignant melanoma and squamous cell carcinoma result from prolonged exposure to UV radiation, either from sunlight or from tanning beds or lamps (Gloster and Brodland 1996). Limiting exposure to UV radiation, in addition to using a chemopreventive agent, can help to significantly reduce the incidence of these types of skin cancer (Einspahr et al. 2002).
Over the past several decades, attention has been focused on understanding the molecular basis of carcinogenesis. Studies revealed that several factors and mechanisms are involved in the control of cancer; one of these mechanisms is apoptosis. Apoptosis or programmed cell death is a key regulator of physiological growth control and tissue homeostasis. Cell death, mostly by apoptosis, is crucially involved in the regulation of tumor formation and also determines treatment response (Fulda and Debatin 2006).
The apoptotic process is modulated by various tumor suppressor genes, including P53 and proto-oncogenes (Oren 1992). After DNA damage, some cellular responses are triggered by transcriptional activation of P53 and BCL-2 family proteins in order to maintain the integrity of healthy cells. The activation of P53 leads to either DNA repair and recovery or to apoptosis (Elmore 2007; Norbury and Zhivotovsky 2004). Moreover, the effect of P53 on apoptosis has been shown to occur through regulation of BCL-2 family genes (Reed 1995).
The BCL-2 family of proteins consists of both pro-apoptotic and anti-apoptotic members such as BAX and BCL-2. These are important mediators of the mitochondrial outer membrane permeabilization that is accompanied by apoptosis (Ola et al. 2011). They also have been reported to play a central role in regulating cytochrome c release from mitochondria (Martinou and Youle 2011).
The anti-apoptotic protein BCL-2 is located in the outer mitochondrial membrane and plays an essential role in promoting the survival of cells and inhibiting the effects of pro-apoptotic proteins (Youle and Strasser 2008). Overexpression of BCL-2 has been demonstrated to inhibit cell death induced by many stimuli, including growth factor deprivation, hypoxia, and oxidative stress (Yip and Reed 2008).
On the other hand, the pro-apoptotic protein BAX controls cell death through its participation in disruption of mitochondria, and its expression is regulated by the tumor suppressor gene P53 (Korsmeyer 1999). Upregulation of BAX enhances opening of the mitochondrial voltage-dependent anion channel, resulting in loss of membrane potential with subsequent release of cytochrome c (Gogvadze et al. 2006).
By apoptosis, unwanted or damaged cells are eliminated from the system. Thus, induction of tumor cell apoptosis would be considered a protective mechanism against the development and progression of cancer (Bursch et al. 1992). Compounds that suppress the proliferation of malignant cells by inducing apoptosis may represent a useful mechanistic approach to cancer chemoprevention (Sporn and Suh 2002). Chemoprevention is a pharmacological approach using natural, synthetic, or biological agents that can prevent, inhibit, and reverse carcinogenic progression. It has been regarded as a new, hopeful, safe, and efficient strategy for cancer treatment (Gullett et al. 2010; Mehta et al. 2010; Sporn and Suh 2002).
Plants have been, and continue to be, highly useful sources of bioactive molecules. Many of these molecules possess antioxidant, antimutagenic, anticarcinogenic, or carcinogen detoxification properties, which make them efficient chemopreventive candidates against many types of cancers (Cassady et al. 1990; Karikas 2010; Patil et al. 2009). Tea tree oil (TTO) is the essential oil steam distilled from Melaleuca alternifolia of the Myrtaceae family, a plant native to Australia. Traditionally, the oil was used for insect bites and for many skin infections (Bursch et al. 1992; Carson et al. 2006; Hammer et al. 1998; Tong et al. 1992). The main components of TTO are terpene hydrocarbons, primarily including monoterpenes, sesquiterpenes, and their associated alcohols (Altschul et al. 1978). The broad-spectrum antimicrobial activity of tea tree oil has stimulated considerable interest, and its incorporation into preparations, especially in cosmetics, is increasing at a rapid rate (Aburjai and Natsheh 2003).
The aim of the present study was to evaluate the influence of TTO on cell viability and proliferative activity in two representative types of skin cancer, human malignant melanoma (A-375) and human larynx squamous cell carcinoma (HEp-2). This study further assessed the effect of TTO on expression levels of apoptosis regulatory genes P53, BAX, and BCL-2 to unravel the molecular mechanisms of its action.
Materials and methods
Reagents and chemicals
Tea tree oil (TTO), tissue culture media, fetal bovine serum (FBS), trypsin, MTT, dimethyl sulfoxide (DMSO), and antibiotics were purchased from Sigma-Aldrich (St. Louis, MO, USA). The Annexin V Kit, Binding Buffer, and propidium iodide were purchased from Trevigen (Minneapolis, MN, U SA).
Cell culture
Human malignant melanoma (A-375) and human squamous cell carcinoma (HEp-2) cell lines were purchased frozen in liquid nitrogen from the American Type Culture Collection (ATCC) (Manassas, VA, USA). The A-375 cell line was cultured in Dulbecco’s modified Eagle’s medium (DMEM), whereas the HEp-2 cell line was cultured in Eagle’s Minimum Essential Medium (EMEM). Both culture media were supplemented with heat-inactivated 10% FBS (fetal bovine serum), 100 U/mL of penicillin, and 100 μg/mL of streptomycin. Cells were grown in a humidified incubator containing 5% CO2 at 37 °C. At 85% confluence, cells were dissociated using 0.25% trypsin and sub-cultured into 75 cm2 flasks and 96-well plates (TPP, Trasadingen, Switzerland) as appropriate for experimental assays.
Cell viability assay
The viability of A-375 and HEp-2 cell lines was assessed using the MTT assay as described by Mosmann (1983). Briefly, 1 × 10⁵ cells/well were seeded in 96-well plates and exposed to different concentrations of TTO. TTO was dissolved in DMSO and serially diluted with complete medium to get concentrations ranging from 0.004% to 2.0 to (v/v). The DMSO concentration was kept to less than 0.1% in all samples. Prepared dilutions were added to different wells and incubated for 24 h. The growth of cells was quantified by the ability of living cells to reduce the yellow dye 3-(4,5-dimethyl-2-thiazolyl)-2,5-diphenyl-2H-tetrazolium bromide (MTT) to a blue formazan product. After 24 h, the culture medium was decanted, plates were washed with phosphate-buffered saline (PBS), pH 7.2–7.4 ± 0.2, and cells were resuspended in 50 µL/well MTT solution. The plates were incubated at 37 °C for 4 h, until a purple-colored, intra-cytoplasmic formazan complex was developed. The resulting product was dissolved in 0.4% acidified isopropanol and its absorbance was measured at 570 nm using an ELX-800n ELISA reader (Biotek, Winooski, VT, USA). The experiments were performed in triplicate and the IC50 value of TTO was calculated using Multiplex-2010 software.
Apoptosis detection using flow cytometry
Apoptosis was determined by staining the cells with Annexin V and propidium iodide (PI) using the Annexin V Apoptosis Detection Kit (Trevigen, Gaithersburg, MD, USA). Briefly, A375 and HEp-2 cells were treated with the IC50 of TTO for 24 h. Untreated cells were washed with 500 μL cold PBS and collected by centrifugation. Annexin V (5 μL) and PI (10 μL) were added to 195 μL of the cell sus-pension (1 × 10⁶ cells/mL) and incubated for 20 min in the dark at room temperature. Samples were treated with 400 μL binding buffer and processed within one hour using a FACScan flow cytometer (Becton–Dickinson, San Jose, CA, USA). All tests were repeated in triplicate.
Cell cycle analysis
A-375 and HEp-2 cells pre-cultured in 25 cm2 cell culture flasks were treated for 24 h with of TTO dissolved in DMSO and diluted with complete medium to get the respective IC50 concentrations. For cell cycle analysis, the cells were harvested and fixed gently with 70% (v/v) ethanol in PBS, maintained at a temperature of 4 °C overnight, and then re-suspended in PBS containing 40 μg/mL propidium iodide, 0.1 mg/mL RNase A, and 0.1% Triton X-100 in a dark room. After 30 min at 37 °C, the cells were analyzed with a FACScan flow cytometer equipped with an argon ion laser at a wavelength of 488 nm. The cell cycle and sub-G1 groups were then determined and analyzed (Kuo et al. 2007).
Evaluation of P53, BAX, and BCL-2 gene expression in A-375 and HEp-2 cancer cells using real-time PCR
Both A-375 and HEp-2 cell lines were cultured in six-well plates and exposed to TTO at their respective IC50 for 24 h. At the end of the exposure, total RNA was extracted from treated cells using an RNeasy mini Kit (Qiagen, Valencia, CA, USA) according to the manufacturer’s instructions. Concentrations of extracted RNAs were determined using a Beckman Coulter DU-800 spectrophotometer (Beckman Coulter Inc., Brea, CA, USA).
Ten nanograms of total RNA from each sample was used for cDNA synthesis by reverse transcription with the High-Capacity cDNA Reverse Transcription kit (Applied Biosystems, Thermo Fisher Scientific, Waltham, MA, USA). The cDNA was subsequently amplified with the SYBR Green 1 PCR Master kit (Fermentas, Thermo Fisher Scientific) in a 48-well plate using a Step One thermocycler (Applied Biosystems, Thermo Fisher Scientific, Waltham, MA, USA). Program steps were: 10 min at 95 °C for enzyme activation followed by 40 cycles of 15 s at 95 °C, 20 s at 55 °C, and 30 s at 72 °C. One μL of each primer (10 pmol/μl) was used for each specific target gene, and each sample was amplified in triplicate. Melting curves were performed after real-time PCR to demonstrate the specific amplification of single products of interest. Amplification efficiencies of the primers used were determined by standard curve assay. Relative fold changes in the expression of target genes (P53, BAX, and BCL-2) were obtained using the comparative 2−ΔΔCt method (Livak and Schmittgen 2001) with the β-actin gene as an internal control for normalizing the level of target gene expression. The ΔΔCT is the difference between the mean ΔCTs of treatment and control groups, where each ΔCT is the difference between the mean CTs of the gene of interest and the internal control in each sample. Logarithmic transformation was performed on fold change values before statistical analysis. Primer sequences and sizes of PCR products are shown in Table 1.
Table 1.
Primers sequences used for amplification of P53, BAX, BCL-2, and the internal control β-actin
| Gene | Primer sequences | Size of PCR product (bp) |
|---|---|---|
| P53 | Forward: 5′-TCA GAT CCT AGC GTC GAG CCC-3′ | 438 |
| Reverse: 5′-GGG TGT GGA ATC AAC CCA CAG-3′ | ||
| BAX | Forward: 5′-ATG GAC GGG TCC GGG GAG CA-3′ | 322 |
| Reverse: 5′-CCC AGT TGA AGT TGC CGT CA-3′ | ||
| BCL-2 | Forward: 5′-GTG AAC TGG GGG AGG ATT GT-3′ | 216 |
| Reverse: 5′-GGA GAA ATC AAA CAG AGG CC-3′ | ||
| β-actin | Forward: 5′-CTG TCT GGC GGC ACC ACC AT-3′ | 253 |
| Reverse: 5′-GCA ACT AAG TCA TAG TCC GC-3′ |
Effect of TTO on p53, Bax and Bcl-2 proteins by western blot
A-375 and HEp-2 cells (1 × 10⁵ cells/cm2) were plated in 12-well plates for western blotting analysis. The cells were treated with TTO at their respective IC50 for 24 h. After treatment, cells were lysed in RIPA buffer, and the lysates were centrifuged at 10,000g at 4 °C for 15 min and supernatants collected. The protein concentration in the lysate was measured by the Lowry method (Lowry et al. 1951). The lysates (100 µg) were run on 10% sodium dodecyl sulphate–polyacrylamide gel electrophoresis (SDSPAGE) (Bio-Rad Laboratories, Hercules, CA, USA) and then electrophoretically transferred to polyvinylidene difluoride membrane (Bio-Rad Laboratories) at 380 mA for 1 h at 4 °C. Western blot analysis was carried out using specific primary antibodies for p53, Bax and Bcl-2 (Santa Cruz Biotechnology, CA, USA). To normalize band intensity, the membranes were probed with β-actin antibodies (Sigma Aldrich). The immune-reactive bands were detected using ECL plus chemiluminescence (ECL) kit according to the manufacturer’s instructions (Amersham Life Sciences, Chalfont, Buckinghamshire, UK).
Caspases activities
The measurement of Caspase-3/7 and -9 activities has been determined using the commercial Caspase-Glo-3/7 and -9 assay kits (Promega Company, Madison, USA). The assay of caspases was carried out according to the manufacturer’s protocol. In Brief, A-375 and HEp-2 cells were plated in white-walled 96-well plates and then treated with TTO at their respective IC50 (0.038 and 0.024 v/v respectively) for 24 h. After the incubation time, the TTO-treated cells were supplemented with caspase-Glo reagent (100 μL) and then incubated for 30 min at room temperature. The activity of caspase-3/7 and -9 activity was then examined using GloMax microplate luminescence reader (Promega Company).
Statistical analysis
SPSS 13.0 software was used for statistical analysis, and the data were evaluated using one-way analysis of variance (ANOVA). Data are represented as mean ± SD, and differences in expression were considered statistically significant at p < 0.05.
Results
Cytotoxicity of TTO on A-375 and HEp-2 cells
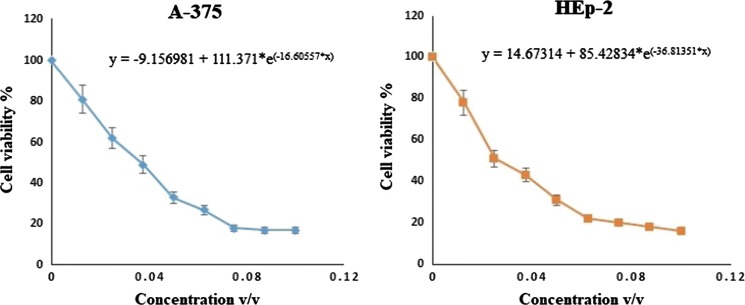
To determine cytotoxic effects on A-375 and HEp-2 cell lines, cells were subjected to TTO treatment for 24 h at concentrations ranging from 0.004 to 2.0% v/v. As shown in Fig. 1, treatment markedly reduced the viability of A-375 and HEp-2 cells in a concentration-dependent manner. After 24 h, the estimated IC50 values were 0.038 ± 0.011% (v/v) for A-375 cells and 0.024 ± 0.017% (v/v) for HEp-2 cells. Histological changes accompanying the cytotoxic effects suggested that TTO might induce apoptotic cell death in A-375 and HEp-2 cells; therefore, we attempted to elucidate possible molecular mechanisms via apoptosis detection, cell cycle pattern analysis, and quantification of selected apoptosis regulatory genes after treatment with TTO.
Fig. 1.
Cytotoxicity of TTO towards A-375 and HEp-2 tumor cells as determined by MTT assay. After 24 h, the estimated IC50 values were 0.038 ± 0.011% (v/v) for A-375 cells and 0.024 ± 0.017% (v/v) for HEp-2 cells using non-linear estimation method (GraphPad Prism 8 software, La Jolla, CA, USA, test version)
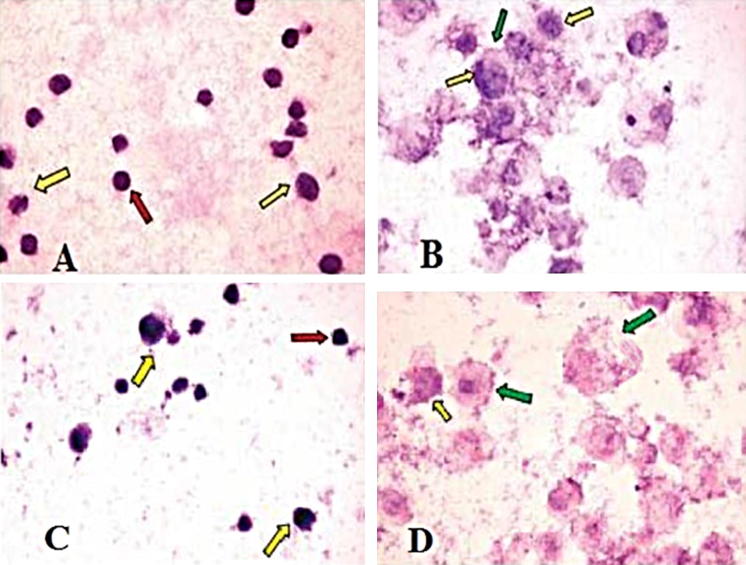
Histological changes in TTO-treated cells were examined visually by inverted microscope (Hund, Wetzlar, Germany). Untreated A-375 and HEp-2 cells showed regular, hyper-chromatic, and condensed nuclei. They were also characterized by regular cellular outlines with no evidence of folding in the cellular and nuclear membranes (Fig. 2a, c). In contrast, TTO-treated A-375 and HEp-2 cells showed the early apoptotic features of peripheral condensation of chromatin and nucleolar segregation (Fig. 2b, d).
Fig. 2.
Photomicrograph of A-375 and HEp-2 cells before and after treatment with TTO (IC50); control cells of A-375 (a) and HEp-2 (c) showing regular cells (red arrows) with cellular and nuclear pleomorphism (yellow arrows). After treatment, A-375 (b) and HEp-2 (d) lines both showed swollen cells, clumping of the heterochromatin admixed with euchromatin (yellow arrows); some cells had irregular cell membranes (green arrow). (Color figure online)
Apoptosis detection using flow cytometry
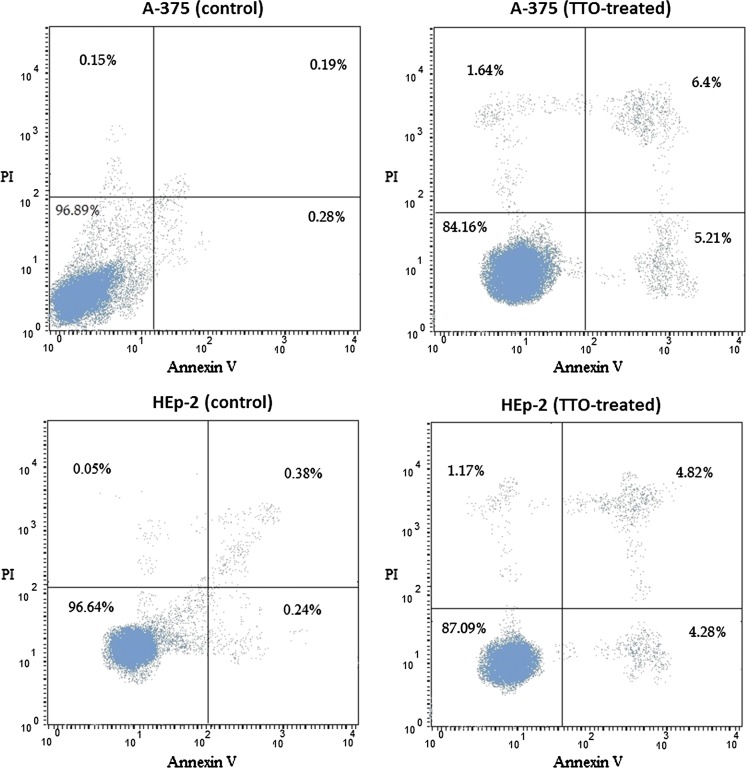
To further confirm the induction of apoptosis by TTO, we used Annexin-V and PI assays to determine the ratios of apoptotic cells in A-375 and HEp-2 (Fig. 3). In control samples, the majority of cells (> 96%) were viable and non-apoptotic (Annexin V−PI−). In contrast, the proportion of Annexin V−PI− cells was reduced by TTO treatment to 84.2% and 87.1% in A-375 and HEp-2 cells, respectively. The total number of apoptotic cells (Annexin V+PI−) increased from 0.28 to 5.2% in the A-375 cell line and from 0.24 to 4.3% in HEp-2 cells. These results suggest that TTO can induce apoptosis. An increase in the Annexin V+P+ population, indicating late apoptotic cells, was also observed in both A-375 and HEp-2 cells (6.4% and 4.8% respectively), shown in Fig. 3.
Fig. 3.
Flow cytometry results of Annexin V/PI assays. A-375 and HEp-2 cells were either untreated control) or treated with their TTO IC50 for 24 h. The lower left area contains cells negative for both Annexin V and PI (viable); cells in the lower right are positive for Annexin V but not PI (early apoptotic); cells in the upper left are Annexin V− and PI+ (late apoptotic); and cells in the upper right are both Annexin V+ and PI+ (necrotic)
Cell cycle analysis by flow cytometry
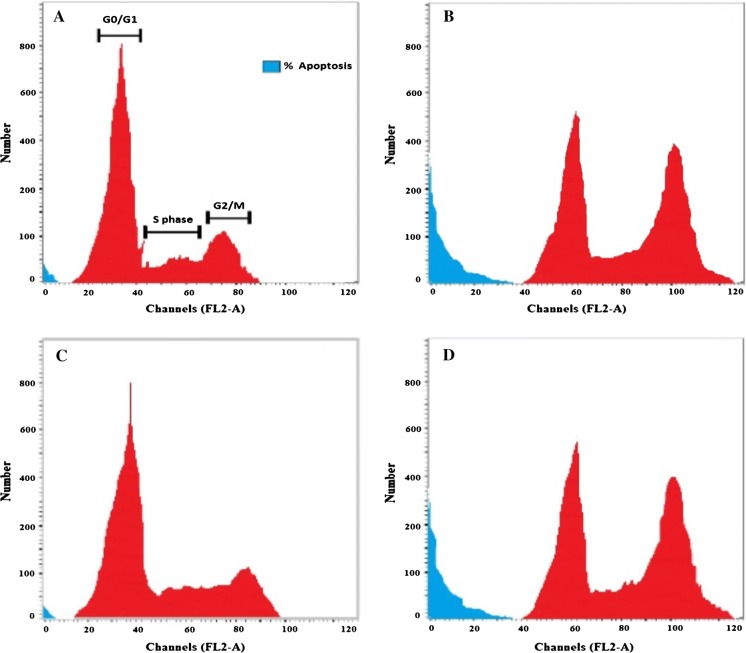
The cytotoxicity assay was followed by cell cycle analysis of both A-375 and HEp-2 cell lines. Both lines exhibited an increase in the percentage of apoptotic cells after TTO treatment, as indicated by their sub-G1 phase proportions (24.5% and 24.9%, respectively); there was also an accumulation of arrested cells in the G2/M phase when compared to controls. In the A-375 control, 69.6% of cells were in G0/G1 phase, 21.2% in S phase, and 6.1% in G2/M phase. In contrast, for A-375 cells treated with the IC50 of TTO, the proportions of cells in the G0/G1, S, and G2/M phases were 32.1%, 18.1%, and 25.3%, respectively. In the HEp-2 control, 66.7% of cells were in G0/G1 phase, 9.1% of cells in S phase, and 21.1% of cells in G2/M phase. After treatment with TTO, the proportions of HEp-2 cells in G0/G1, S, and G2/M phases were 18.3%, 16.4%, and 40.4%, respectively (Figs. 4, 5). In particular, S phase arrest was higher in HEp-2 cells. Overall, these findings suggest that TTO inhibited the growth of both A-375 and HEp-2 cells by blocking the cell cycle at G2/M phase.
Fig. 4.
Cell cycle pattern and apoptosis distribution of a A-375 control cells, b A-375 treated cells, c HEp-2 control cells, and d HEp-2 treated cells
Fig. 5.
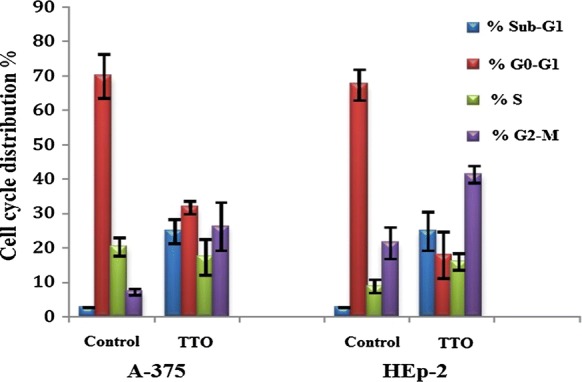
Effect of TTO on cell cycle progression in A-375 and HEp-2 cancer cells. Analysis was carried out in triplicate. Data are expressed as the mean percentage of cells in each phase ± SD
Effect of TTO on apoptosis regulatory gene expression (P53, BAX, and BCL-2) in A-375 and HEp-2 cells
To investigate the molecular mechanism underlying TTO-induced apoptosis in A-375 and HEp-2 cells, we determined the mRNA expression levels of P53, BAX, and BCL-2 genes. Following 24 h exposure to the determined IC50 concentrations of TTO, mRNA levels were measured by real-time PCR with gene-specific primers. Our data showed that expression of pro-apoptotic genes (P53 and BAX) was clearly upregulated (p < 0.00001), while the anti-apoptotic gene BCL-2 was downregulated (p < 0.00001) (Figs. 6, 7), indicating potential efficacy of TTO in directing cancer cells towards programmed death.
Fig. 6.
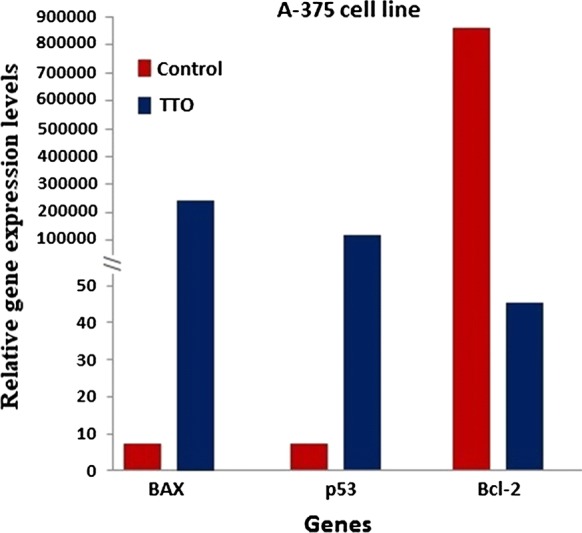
Evaluation of pro- and anti-apoptotic relative genes expression levels under the effect of TTO using real-time PCR in a malignant melanoma cancer cell line (A-375). β-actin was used as the reference gene. The relative expression levels were calculated by the 2−ΔΔCt method
Fig. 7.
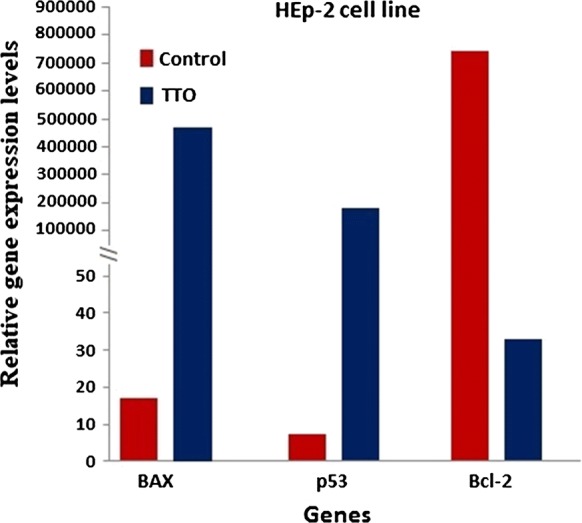
Evaluation of pro- and anti-apoptotic relative genes expression levels under the effect of TTO using real-time PCR in a squamous cell carcinoma cell line (HEp-2). β-actin was used as the reference gene. The relative expression levels were calculated by the 2−ΔΔCt method
Effect of TTO on p53, Bax and Bcl-2 proteins by western blot
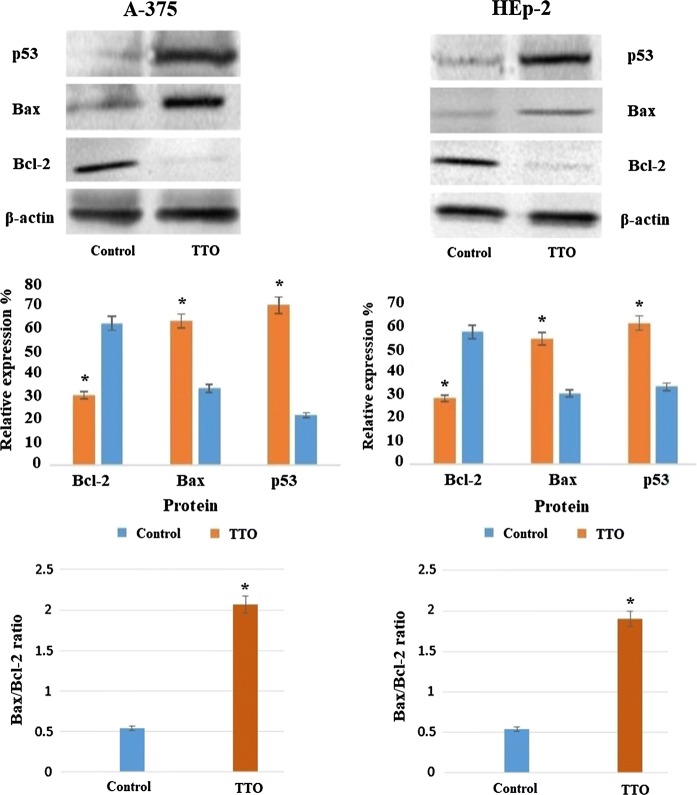
As shown in Fig. 8, the pro-apoptotic proteins p53 and Bax were significantly upregulated in A-375 and HEp-2 after TTO-treatment while expression of anti-apoptotic protein Bcl-2 was inhibited compared to untreated control cells. Accordingly, the Bax/Bcl-2 ratios significantly increased from 0.5397 to 2.0645 in A-375 and from 0.5344 to 1.8966 in HEp-2 cells post TTO treatment (p < 0.05).
Fig. 8.
Effect of TTO on protein expression of p53, Bax and Bcl-2 in A-375 and HEp-2 cells: cells were treated with TTO at their respective IC50 for 24 h. The protein levels were quantified by densitometric analysis of the three autoradiographs. *p < 0.05 was considered as statistically significant
Effect of TTO on caspase-3/7 and -9 activities in A-375 and HEp-2 cells
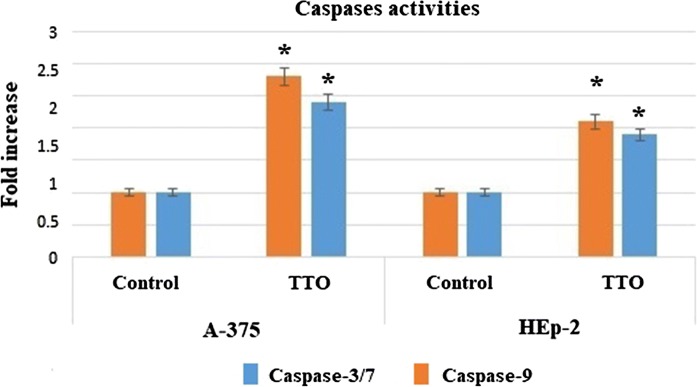
In this study, the results demonstrated that caspase-3/7and -9 activities showed a significant increase in A-375 and HEp-2 cells after treatment with TTO for 24 h (Fig. 9). The elevation of caspase-3/7 activity confirmed the induction of apoptosis in both A-375 and HEp-2 cells. Furthermore, the elevation of the expression level of caspase-9 activity in treated cells is considered as the intrinsic pathway contribution during the apoptotic process.
Fig. 9.
Evaluation of TTO effect on caspase-3/7 and -9 activations in A-375 and HEp-2 cells line after 24 h of treatment. The values represent mean ± SD. *p < 0.05
Discussion
Natural products from medicinal plants are still one of the best reservoirs for novel agents with medicinal activities (Pezzuto 1997). The search is ongoing to identify a natural compound that selectively has the ability not only to block or inhibit initiation of carcinogenesis but also to reverse promotional stages by inducing apoptosis and growth arrest in cancer cells without cytotoxic effects on normal cells (Gullett et al. 2010; Millimouno et al. 2014).
Recent studies indicate that most cancers are caused by dysfunction of many genes coding for anti-apoptotic proteins, growth factors, growth factor receptors, transcription factors and tumor suppressors; these genes constitute the targets for cancer treatment (Colotta et al. 2009; Igney and Krammer 2002).
The present study evaluated the ability of TTO to inhibit the proliferation of A-375 and HEp-2 cells in vitro as well as its effects on cell cycle profile. Furthermore, the study evaluated the potential of TTO to induce apoptosis through Annexin V/PI staining and measuring the expression levels of apoptosis regulatory genes P53, BAX, and BCL-2. Our results clearly revealed that TTO exerts major cytotoxic effects on malignant melanoma (A-375) and squamous cell carcinoma (HEp-2) cells. There are reports on the cytotoxicity of TTO towards many cancers including cervix carcinoma (HeLa), liver carcinoma (HepG2), leukemia cells, prostate carcinoma (PC-3), lung cancer (A549), and breast carcinoma cells (MCF-7) (Hayes et al. 1997; Liu et al. 2009). The results of the present study provide further support for TTO as a candidate chemopreventive and anticancer agent.
Apoptotic cells exhibit different changes during early and late stages of apoptosis including loss of phospholipid asymmetry, leading to the exposure of phosphatidylserine on the outer layer of the plasma membrane. Annexin V is classically used to identify apoptotic cells by flow cytometry because it binds to the negatively charged phosphatidylserine (Vermes et al. 2000). Combined staining with Annexin V and PI distinguishes between early (Annexin V+PI−) and late (Annexin V+PI+) apoptotic cells. The results in this study indicated that TTO induced both early and late apoptosis in A-375 and HEp-2 cells.
Cell cycle analysis further revealed that exposure to TTO caused G2/M phase arrest in both A-375 and HEp-2 cell lines (Figs. 4, 5). The increased number of cells in sub-G1 phase reflects the greater incidence of apoptotic cells post treatment (Xia et al. 2000). Also, the specific arrest of HEp-2 cells during S phase indicates an enhancement of cell death through DNA-damage and biochemical pathways that involve signaling cascades (Hwang and Muschel 1998).
Analysis of pro and anti-apoptotic genes expression levels by real-time PCR and western blot demonstrated that TTO caused an increase in expression of P53 and BAX and a decrease in expression of BCL-2 and resulted in a significant increase in the Bax/Bcl-2 ratio which is regarded as a driving force for apoptosis. These findings confirmed the involvement of the intrinsic pathway of cell death and indicate that TTO-elicited apoptosis could be P53-dependent, as BAX expression is upregulated during P53-dependent apoptosis (Miyashita et al. 1994). Melanomas usually retain wild type and functional P53, and the A-375 cell line is accordingly P53+ (Takahashi et al. 2014); thus the induction of P53-dependent apoptosis by TTO has good potential for treating this type of cancer. Conversely, the majority of squamous cell carcinomas have mutant/deleted P53 (Nylander et al. 1995), thus its induction might not be able to boost apoptosis in vivo unless it is confirmed by measuring the pro and anti-apoptotic proteins. Interestingly, western blot analysis showed a significant increase in p53 and Bax with a decrease in Bcl-2 protein levels in HEp-2 cells after TTO treatment, which indicates that TTO might be a good candidate for treating squamous cell carcinoma.
The action of P53 in apoptosis is to directly and indirectly regulate the activity of BCL-2 family proteins, as well as to arrest cell growth and activate apoptotic pathways that induce programmed cell death (Adams and Cory 1998; Kluck et al. 1997). It may also inhibit BCL-2 function through transactivation of cell division control protein 42 homolog (Cdc42), which initiates a signaling pathway resulting in BCL-2 phosphorylation and inactivation (Thomas et al. 2000).
Interestingly, BCL-2 overexpression has been linked to the acquired resistance of tumors to chemotherapy (Johnstone et al. 2002). Therefore, it has been proposed that either the functional blockade of anti-apoptotic BCL-2 family members or the overexpression of pro-apoptotic ones could possibly restore the apoptotic machinery in tumor cells and/or sensitize these tumors to chemo- and radiotherapies (Hassan et al. 2014; Kirkin et al. 2004).
BCL-2 is known to form heterodimers with the BAX protein in vivo, and the molar ratio of BAX/BCL-2 is an indicator of the intrinsic pathway of apoptosis and determines whether apoptosis is induced or inhibited in several tissues (Basu and Haldar 1998). Upregulation of BAX alters the BAX/BCL-2 ratio in the cellular microenvironment and causes the release of cytochrome c from mitochondria into the cytosol, thus activating the caspase cascade (Kroemer and Reed 2000). Caspase cascade events are an important factor for inducing apoptosis via extrinsic or intrinsic pathways. Activity of caspase enzymes such as caspase-3/7 and -9 in treated cells is closely related to the apoptosis signaling through the intrinsic and extrinsic pathways. Moreover, the activation of caspase-3/7 triggered by caspase-9 leads to caspase-8 activations which is the last stage leading the cell to apoptosis (Cohen 1997).
Changes in the expression of apoptosis-related genes can be used as indicators and symptoms of chemopreventive efficiency. In our experiment, TTO induced upregulation of P53 and increased the BAX/BCL-2 ratio 24 h post-treatment in both tested cell lines. These effects make TTO a good chemopreventive candidate against these types of skin cancers, potentially able to restore the apoptotic machinery and sensitize these tumors to chemo- and radiotherapies.
Conclusion
In conclusion, TTO illustrates the potential for discovering new plant-sourced drugs through the analysis of traditional ethnic medicines. The data from our study indicate that treatment with TTO induced cellular death by mitochondrial apoptosis through a P53-dependent pathway that involves target proteins of the BCL-2 family (i.e. BAX, BCL-2). The apoptosis induced by TTO in A-375 and HEp-2 cells was associated with the p53, Bax up-regulation and down-regulation of Bcl-2 levels and caspase activation.
Based on these findings, inclusion of TTO in topical pharmaceutical or cosmeceutical formulations could be of high value, as it may enhance skin defense mechanisms against melanoma and squamous cell carcinoma cancers. However, further work is needed to develop a suitable formulation for the topical delivery of TTO.
Compliance with ethical standards
Conflicts of interest
The authors declare that they have no conflicts of interest.
References
- Aburjai T, Natsheh FM. Plants used in cosmetics. Phytother Res. 2003;17:987–1000. doi: 10.1002/ptr.1363. [DOI] [PubMed] [Google Scholar]
- Adams JM, Cory S. The Bcl-2 protein family: arbiters of cell survival. Science. 1998;281:1322–1326. doi: 10.1126/science.281.5381.1322. [DOI] [PubMed] [Google Scholar]
- Altschul A, Heintze K, Obst-Gemueseverwert Z. Composition of Australian tea tree oil (Melaleuca alternifolia) J Agric Food Chem. 1978;26:735. [Google Scholar]
- Basu A, Haldar S. The relationship between Bcl-2, Bax and p53: consequences for cell cycle progression and cell death. Mol Hum Reprod. 1998;4:1099–1109. doi: 10.1093/molehr/4.12.1099. [DOI] [PubMed] [Google Scholar]
- Bursch W, Oberhammer F, Schulte-Hermann R. Cell death by apoptosis and its protective role against disease. Trends Pharmacol Sci. 1992;13:245–251. doi: 10.1016/0165-6147(92)90077-J. [DOI] [PubMed] [Google Scholar]
- Carson C, Hammer K, Riley T. Melaleuca alternifolia (tea tree) oil: a review of antimicrobial and other medicinal properties. Clin Microbiol Rev. 2006;19:50–62. doi: 10.1128/CMR.19.1.50-62.2006. [DOI] [PMC free article] [PubMed] [Google Scholar]
- Cassady JM, Baird WM, Chang C-J. Natural products as a source of potential cancer chemotherapeutic and chemopreventive agents. J Nat Prod. 1990;53:23–41. doi: 10.1021/np50067a003. [DOI] [PubMed] [Google Scholar]
- Cohen GM. Caspases: the executioners of apoptosis. Biochem J. 1997;326:1–16. doi: 10.1042/bj3260001. [DOI] [PMC free article] [PubMed] [Google Scholar]
- Colotta F, Allavena P, Sica A, Garlanda C, Mantovani A. Cancer-related inflammation, the seventh hallmark of cancer: links to genetic instability. Carcinogenesis. 2009;30:1073–1081. doi: 10.1093/carcin/bgp127. [DOI] [PubMed] [Google Scholar]
- Einspahr JG, Stratton SP, Bowden GT, Alberts DS. Chemoprevention of human skin cancer. Crit Rev Oncol Hematol. 2002;41:269–285. doi: 10.1016/S1040-8428(01)00185-8. [DOI] [PubMed] [Google Scholar]
- Elmore S. Apoptosis: a review of programmed cell death. Toxicol Pathol. 2007;35:495–516. doi: 10.1080/01926230701320337. [DOI] [PMC free article] [PubMed] [Google Scholar]
- Fulda S, Debatin K. Extrinsic versus intrinsic apoptosis pathways in anticancer chemotherapy. Oncogene. 2006;25:4798–4811. doi: 10.1038/sj.onc.1209608. [DOI] [PubMed] [Google Scholar]
- Gloster HM, Brodland DG. The epidemiology of skin cancer. Dermatol Surg. 1996;22:217–226. doi: 10.1111/j.1524-4725.1996.tb00312.x. [DOI] [PubMed] [Google Scholar]
- Gogvadze V, Orrenius S, Zhivotovsky B. Multiple pathways of cytochrome c release from mitochondria in apoptosis. Biochim Biophys Acta Bioenergy. 2006;1757:639–647. doi: 10.1016/j.bbabio.2006.03.016. [DOI] [PubMed] [Google Scholar]
- Gullett NP et al (2010) Cancer prevention with natural compounds. In: Seminars in oncology, vol 3. Elsevier, pp 258–281 [DOI] [PubMed]
- Hammer KA, Carson CF, Riley TV. In-vitro activity of essential oils, in particular Melaleuca alternifolia (tea tree) oil and tea tree oil products, against Candida spp. J Antimicrob Chemother. 1998;42:591–595. doi: 10.1093/jac/42.5.591. [DOI] [PubMed] [Google Scholar]
- Hassan M, Watari H, AbuAlmaaty A, Ohba Y, Sakuragi N. Apoptosis and molecular targeting therapy in cancer. Biomed Res Int. 2014;2014:150845. doi: 10.1155/2014/150845. [DOI] [PMC free article] [PubMed] [Google Scholar] [Retracted]
- Hawrot A, Alam M, Ratner D. Squamous cell carcinoma. Curr Probl Dermatol. 2003;15:91–133. doi: 10.1016/S1040-0486(03)00005-X. [DOI] [Google Scholar]
- Hayes AJ, Leach DN, Markham JL, Markovic B. In vitro cytotoxicity of Australian tea tree oil using human cell lines. J Essent Oil Res. 1997;9:575–582. doi: 10.1080/10412905.1997.9700780. [DOI] [Google Scholar]
- Hussein MR. Extracutaneous malignant melanomas. Cancer Invest. 2008;26:516–534. doi: 10.1080/07357900701781762. [DOI] [PubMed] [Google Scholar]
- Hwang A, Muschel RJ. Radiation and the G2 phase of the cell cycle. Radiat Res. 1998;150:S52–S59. doi: 10.2307/3579808. [DOI] [PubMed] [Google Scholar]
- Igney FH, Krammer PH. Death and anti-death: tumour resistance to apoptosis. Nat Rev Cancer. 2002;2:277–288. doi: 10.1038/nrc776. [DOI] [PubMed] [Google Scholar]
- Johnstone RW, Ruefli AA, Lowe SW. Apoptosis: a link between cancer genetics and chemotherapy. Cell. 2002;108:153–164. doi: 10.1016/S0092-8674(02)00625-6. [DOI] [PubMed] [Google Scholar]
- Karikas G. Anticancer and chemopreventing natural products: some biochemical and therapeutic aspects. J BUON. 2010;15:627–638. [PubMed] [Google Scholar]
- Kirkin V, Joos S, Zörnig M. The role of Bcl-2 family members in tumorigenesis. Biochim Biophys Acta Mol Cell Res. 2004;1644:229–249. doi: 10.1016/j.bbamcr.2003.08.009. [DOI] [PubMed] [Google Scholar]
- Kluck RM, Bossy-Wetzel E, Green DR, Newmeyer DD. The release of cytochrome c from mitochondria: a primary site for Bcl-2 regulation of apoptosis. Science. 1997;275:1132–1136. doi: 10.1126/science.275.5303.1132. [DOI] [PubMed] [Google Scholar]
- Korsmeyer SJ. BCL-2 gene family and the regulation of programmed cell death. Cancer Res. 1999;59:1693s–1700s. [PubMed] [Google Scholar]
- Kroemer G, Reed JC. Mitochondrial control of cell death. Nat Med. 2000;6:513. doi: 10.1038/74994. [DOI] [PubMed] [Google Scholar]
- Kuo H-M, Chang L-S, Lin Y-L, Lu H-F, Yang J-S, Lee J-H, Chung J-G. Morin inhibits the growth of human leukemia HL-60 cells via cell cycle arrest and induction of apoptosis through mitochondria dependent pathway. Anticancer Res. 2007;27:395–405. [PubMed] [Google Scholar]
- Liu X, Zu Y, Fu Y, Yao L, Gu C, Wang W, Efferth T. Antimicrobial activity and cytotoxicity towards cancer cells of Melaleuca alternifolia (tea tree) oil. Eur Food Res Technol. 2009;229:247. doi: 10.1007/s00217-009-1057-5. [DOI] [Google Scholar]
- Livak KJ, Schmittgen TD. Analysis of relative gene expression data using real-time quantitative PCR and the 2−ΔΔCT method. Methods. 2001;25:402–408. doi: 10.1006/meth.2001.1262. [DOI] [PubMed] [Google Scholar]
- Lowry OH, Rosebrough NJ, Farr AL, Randall RJ. Protein measurement with the Folin Phenol reagent. J Biol Chem. 1951;193:265–275. [PubMed] [Google Scholar]
- Martinou J-C, Youle RJ. Mitochondria in apoptosis: Bcl-2 family members and mitochondrial dynamics. Dev Cell. 2011;21:92–101. doi: 10.1016/j.devcel.2011.06.017. [DOI] [PMC free article] [PubMed] [Google Scholar]
- Matsumura Y, Ananthaswamy HN. Toxic effects of ultraviolet radiation on the skin. Toxicol Appl Pharmacol. 2004;195:298–308. doi: 10.1016/j.taap.2003.08.019. [DOI] [PubMed] [Google Scholar]
- Mehta RG, Murillo G, Naithani R, Peng X. Cancer chemoprevention by natural products: how far have we come? Pharm Res. 2010;27:950–961. doi: 10.1007/s11095-010-0085-y. [DOI] [PubMed] [Google Scholar]
- Millimouno FM, Dong J, Yang L, Li J, Li X. Targeting apoptosis pathways in cancer and perspectives with natural compounds from mother nature. Cancer Prev Res. 2014;7:1081–1107. doi: 10.1158/1940-6207.CAPR-14-0136. [DOI] [PubMed] [Google Scholar]
- Miyashita T, Harigai M, Hanada M, Reed JC. Identification of a p53-dependent negative response element in the bcl-2 gene. Cancer Res. 1994;54:3131–3135. [PubMed] [Google Scholar]
- Mosmann T. Rapid colorimetric assay for cellular growth and survival: application to proliferation and cytotoxicity assays. J Immunol Methods. 1983;65:55–63. doi: 10.1016/0022-1759(83)90303-4. [DOI] [PubMed] [Google Scholar]
- Norbury CJ, Zhivotovsky B. DNA damage-induced apoptosis. Oncogene. 2004;23:2797–2808. doi: 10.1038/sj.onc.1207532. [DOI] [PubMed] [Google Scholar]
- Nylander K, Nilsson P, Mehle C, Roos G. p53 mutations, protein expression and cell proliferation in squamous cell carcinomas of the head and neck. Br J Cancer. 1995;71:826. doi: 10.1038/bjc.1995.159. [DOI] [PMC free article] [PubMed] [Google Scholar]
- Ola MS, Nawaz M, Ahsan H. Role of Bcl-2 family proteins and caspases in the regulation of apoptosis. Mol Cell Biochem. 2011;351:41–58. doi: 10.1007/s11010-010-0709-x. [DOI] [PubMed] [Google Scholar]
- Oren M. The involvement of oncogenes and tumor suppressor genes in the control of apoptosis. Cancer Metastasis Rev. 1992;11:141–148. doi: 10.1007/BF00048060. [DOI] [PubMed] [Google Scholar]
- Patil BS, Jayaprakasha G, Chidambara Murthy K, Vikram A. Bioactive compounds: historical perspectives, opportunities, and challenges. J Agric Food Chem. 2009;57:8142–8160. doi: 10.1021/jf9000132. [DOI] [PubMed] [Google Scholar]
- Pezzuto JM. Plant-derived anticancer agents. Biochem Pharmacol. 1997;53:121–133. doi: 10.1016/S0006-2952(96)00654-5. [DOI] [PubMed] [Google Scholar]
- Reed JC. Regulation of apoptosis by bcl-2 family proteins and its role in cancer and chemoresistance. Curr Opin Oncol. 1995;7:541–546. doi: 10.1097/00001622-199511000-00012. [DOI] [PubMed] [Google Scholar]
- Sporn MB, Suh N. Chemoprevention: an essential approach to controlling cancer. Nat Rev Cancer. 2002;2:537–543. doi: 10.1038/nrc844. [DOI] [PubMed] [Google Scholar]
- Takahashi R, Markovic SN, Scrable HJ. Dominant effects of Δ40p53 on p53 function and melanoma cell fate. J Invest Dermatol. 2014;134:791–800. doi: 10.1038/jid.2013.391. [DOI] [PMC free article] [PubMed] [Google Scholar]
- Thomas A, Giesler T, White E. p53 mediates bcl-2 phosphorylation and apoptosis via activation of the Cdc42/JNK1 pathway. Oncogene. 2000;19:5259. doi: 10.1038/sj.onc.1203895. [DOI] [PubMed] [Google Scholar]
- Tong MM, Altman PM, Barnetson RS. Tea tree oil in the treatment of tinea pedis. Australas J Dermatol. 1992;33:145–149. doi: 10.1111/j.1440-0960.1992.tb00103.x. [DOI] [PubMed] [Google Scholar]
- Vermes I, Haanen C, Reutelingsperger C. Flow cytometry of apoptotic cell death. J Immunol Methods. 2000;243:167–190. doi: 10.1016/S0022-1759(00)00233-7. [DOI] [PubMed] [Google Scholar]
- Xia W, Spector S, Hardy L, Zhao S, Saluk A, Alemane L, Spector NL. Tumor selective G2/M cell cycle arrest and apoptosis of epithelial and hematological malignancies by BBL22, a benzazepine. Proc Natl Acad Sci USA. 2000;97:7494–7499. doi: 10.1073/pnas.97.13.7494. [DOI] [PMC free article] [PubMed] [Google Scholar]
- Yip K, Reed J. Bcl-2 family proteins and cancer. Oncogene. 2008;27:6398–6406. doi: 10.1038/onc.2008.307. [DOI] [PubMed] [Google Scholar]
- Youle RJ, Strasser A. The BCL-2 protein family: opposing activities that mediate cell death. Nat Rev Mol Cell Biol. 2008;9:47–59. doi: 10.1038/nrm2308. [DOI] [PubMed] [Google Scholar]


