

SUMMARY:
Cancer cells often express differentiation programs unrelated to their tissue of origin, although the contribution of these aberrant phenotypes to malignancy is poorly understood. An aggressive subgroup of medulloblastoma, a malignant pediatric brain tumor of the cerebellum, expresses a photoreceptor differentiation program normally expressed in the retina. We establish that two photoreceptor-specific transcription factors, NRL and CRX, are master regulators of this program and are required for tumor maintenance in this subgroup. Beyond photoreceptor lineage genes, we identify BCL-XL as a key transcriptional target of NRL and provide evidence substantiating anti-BCL therapy as a rational treatment opportunity for select MB patients. Our results highlight the utility of studying aberrant differentiation programs in cancer and their potential as selective therapeutic vulnerabilities.
Keywords: medulloblastoma, NRL, CRX, photoreceptor, apoptosis, BCL2, MAF
INTRODUCTION
Medulloblastoma (MB) is a highly malignant pediatric brain tumor that ranks among the most prevalent and deadly brain tumor entities diagnosed in children. Multimodal treatment involving surgical resection, cytotoxic chemotherapy, and craniospinal radiation (children 3 years and older) has improved five-year overall survival rates exceeding 75–80% for ‘standard-risk’ patients. However, this ‘cure’ rate fails to acknowledge the severe detrimental side-effects associated with current protocols. Moreover, clinically-defined ‘high-risk’ patients (i.e. patients that are metastatic at diagnosis, sub-totally resected, and/or younger than 3 years of age) tend to exhibit inferior treatment outcomes characterized by a high propensity for relapse and failure (Ramaswamy and Taylor, 2017).
Recent genomic studies have provided a wealth of new insight into the molecular basis of MB, including identification of biologically and clinically distinct subgroups: WNT, SHH, Group 3, and Group 4 (Northcott et al., 2012a; Taylor et al., 2011). MB subgroups exhibit distinct sets of driver gene alterations, epigenetic signatures, and transcriptional programs, as well as clinically relevant differences in patient demographics, histological features, presence of metastases, and survival. Group 3 and Group 4 MBs represent heterogeneous subgroups, both genetically and clinically, and do not appear to be driven by well-defined, constitutively activated signaling pathways (Cavalli et al., 2017; Northcott et al., 2017). Group 4 MB accounts for 35–40% of all MB patients and is of intermediate prognosis, whereas Group 3 MB accounts for 20–25% of patients and often exhibits an inferior outcome. A discriminatory feature of Group 3 MB owes to the elevated MYC expression observed in the majority of cases, 15–20% of which can be attributed to underlying high-level genomic amplifications (Northcott et al., 2012b, 2017) Additional transcription factors (TFs), including OTX2 (Adamson et al., 2010), and recently substantiated GFI1 and GFI1B (Northcott et al., 2014) exhibit oncogenic roles in both Group 3 and Group 4 MB, suggesting these subgroups may share similar, potentially overlapping molecular origins.
Transcriptional profiling has revealed that Group 3 MBs are characterized by elevated expression of a photoreceptor ‘program’ of unknown biological significance (Cho et al., 2010; Kool et al., 2008). This photoreceptor program has not been described in the normal cerebellum, but is well characterized in the retina. During retinal development, OTX2, which is expressed in different structures of the normal brain including the cerebellum, lies at the top of the photoreceptor hierarchy (Swaroop et al., 2010). OTX2 is highly expressed in non-SHH MB subgroups and the OTX2 locus is amplified in a subset of Group 3 and Group 4 tumors (Adamson et al., 2010; Boon et al., 2005). OTX2 has been shown to be required for MB growth and to control expression of visual perception genes (Bunt et al., 2012). During normal retinal development, OTX2 controls the expression of two essential TFs of the photoreceptor lineage, the lineage-restricted basic-region leucine zipper TF, NRL, and the homeobox TF, CRX (Swaroop et al., 2010). NRL and CRX are expressed exclusively in the retina and pineal gland, with no reported expression in the cerebellum throughout development. These TFs act in concert during photoreceptor differentiation and synergize to regulate the expression of photoreceptor genes (Hsiau et al., 2007). Consensus binding sites for NRL and CRX often coincide and are enriched in regulatory elements of photoreceptor genes (Hao et al., 2012; White et al., 2016). Knockout of either TF in mice induces strong defects in photoreceptor differentiation and mutations in humans are linked with retinopathies (Swaroop et al., 2010).
NRL belongs to the large MAF (“Musculo-Aponeurotic-Fibrosarcoma) family which includes the c-MAF, MAFB, and MAFA oncogenes (Eychene et al., 2008; Kataoka, 2007). With the exception of NRL, the oncogenic activity of these TFs has been extensively documented (Eychene et al., 2008; Kataoka, 2007; Nishizawa et al., 2003; Pouponnot et al., 2006; Rocques et al., 2007). In multiple myeloma, c-MAF, MAFB, and MAFA are targeted by recurrent translocations leading to their aberrant expression without altering their coding sequence (Eychene et al., 2008; Kataoka, 2007). In contrast, NRL has not been previously implicated in human cancer, and it is solely viewed as a terminal differentiation factor of rod photoreceptors (Eychene et al., 2008; Kataoka, 2007; Swaroop et al., 2010). In the present study, we investigated the role of NRL and CRX in the biology of Group 3 MB using a series of cell lines and patient-derived xenograft (PDX) models.
RESULTS
A photoreceptor program defines molecular heterogeneity in Group 3 MB
Analysis of Group 3 MB gene expression signatures in primary samples reaffirmed prior reports of retinal and phototransduction pathway gene sets that are consistently up-regulated in this patient subgroup (Figure 1A). This enrichment was recapitulated in re-analysis of enhancer-gene targets annotated in our recent report detailing the MB cis-regulatory landscape (Figure 1B) (Lin et al., 2016), leading us to propose that photoreceptor lineage TFs might be responsible for establishing Group 3 identity through the formation of subgroup-specific enhancers. Here, re-analysis of Group 3 TF/enhancer interaction networks using an expanded TF motif database (see supplemental methods) revealed the presence of the retinal TFs, NRL and CRX, among the top interconnected nodes in this transcriptional regulatory circuit (Figure 1C). Co-regulatory function has been previously ascribed to NRL and CRX (Figure 1D) (Mitton et al., 2000) and both TFs are required for photoreceptor development (Swaroop et al., 2010) and the specific transactivation of photoreceptor gene expression programs (Hsiau et al., 2007).
Figure 1: NRL and CRX are master regulators of the photoreceptor program in Group 3 MB.
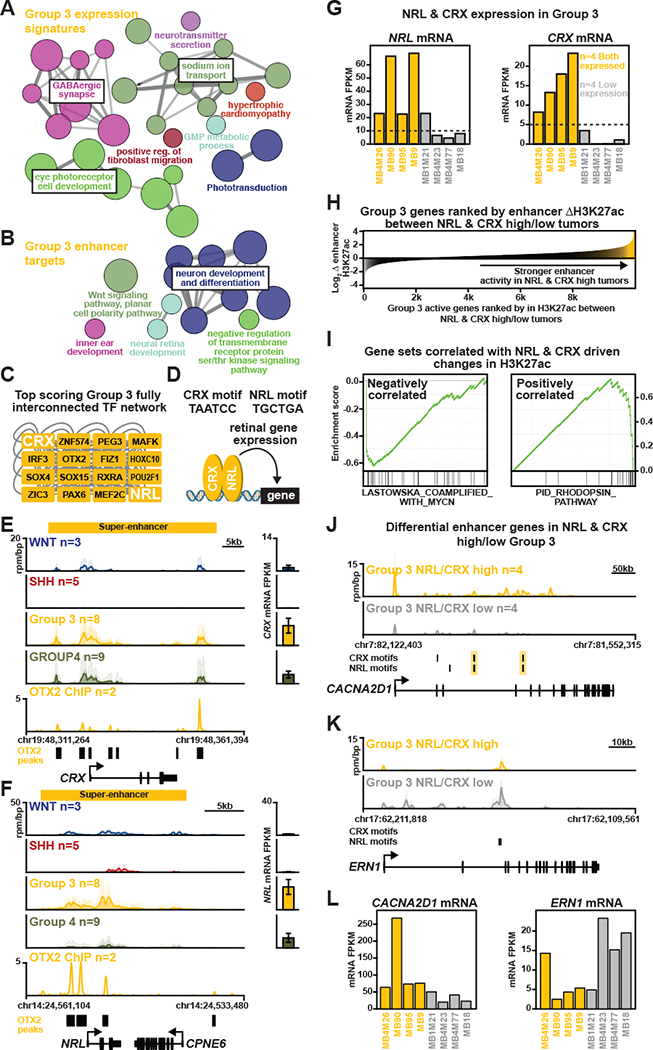
(A, B) Results of GO/Pathway analysis showing gene sets associated with either Group 3 gene expression signatures (A) or Group 3-specific enhancer-gene targets (B) (from Lin et al., 2016). Nodes represent enriched pathways and are sized according to significance; edge weight corresponds to the degree of shared genes between nodes. (C) TF interaction network showing the top fully interconnected network of SE-associated TFs as ranked by highest aggregate clique score for TFs within the network. (D) Schematic representation of NRL and CRX gene regulation and their respective binding motifs. (E, F) Left, Meta tracks of H3K27ac ChIP-seq signal (reads per million per base pair, rpm/bp) across MB subgroups at the NRL (E) and CRX (F) loci. Bottom, meta tracks of OTX2 ChIP-seq signals in the D425MED Group 3 MB cell line (Hovestadt et al., 2014). Right, Bar plots of NRL (E) and CRX (F) expression in corresponding samples. Error bars represent ± SEM. (G) Bar plots showing NRL and CRX mRNA levels (FPKM) across primary Group 3 MB samples included in the study (n=8). Dashed line represents the threshold used to identify NRL and CRX high expression samples. Yellow/gray shading designates the NRL/CRX high vs. low samples, respectively. (H) Waterfall plot showing Group 3 active genes (x-axis) ranked by the average log2 fold change in enhancer and promoter H3K27ac load (y-axis) between NRL/CRX high vs. low tumors (n=4 each). (I) Leading edge enrichment plots for the top gene sets (from MSigDB C2 curated) enriched in NRL/CRX low (left, negatively correlated) or NRL/CRX high (right, positively correlated) expression Group 3 samples as defined in (H). (J, K) Meta tracks of H3K27ac ChIP-seq signal (rpm/bp) for NRL/CRX high vs. low expression Group 3 MBs at the CACNA2D1 (J) and ERN1 (K) loci. (L) Bar plots showing CACNA2D1 (right) and ERN1(left) mRNA levels (FPKM) across NRL/CRX high vs. low expression samples. See also Figure S1 to S4 and Table S1 and S2.
In Group 3 MB, we observed large clustered enhancer elements (i.e. super-enhancers; SEs) proximal to both NRL and CRX coincident with their elevated expression in Group 3 compared to other subgroups (Figure 1E, F). NRL and CRX enhancer signal strongly correlated with their respective mRNA levels (Figure S1A to C). Re-analysis of published OTX2 ChIP-seq data generated from a Group 3 MB cell line (Hovestadt et al., 2014) revealed consistent OTX2 occupancy overlapping enhancers/SEs proximal to NRL and CRX loci (Figure 1E, F). Interestingly, OTX2 expression was positively correlated with both NRL and CRX expression, especially in Group 3 and Group 4 (Figure S1E). Accordingly, we confirmed that OTX2 directly regulated NRL expression by showing that OTX2 occupies the NRL promoter and that inhibition of OTX2 leads to a concordant decrease in NRL expression (Figure S2). We also observed an inverse correlation between DNA methylation levels at the NRL and CRX loci and their respective expression levels (Figure S1I).
As NRL and CRX are inferred to bind proximal to two thirds (2,614/3,741) of all SE-associated genes in Group 3, we sought to determine whether these TFs play a prominent role in shaping Group 3-specific SE-associated gene expression. We identified a set of 384 high confidence genes containing NRL and CRX motifs in close proximity (Table S1) and compared their expression across subgroups to a control set of 203 genes without any support for either NRL or CRX occupancy at their proximal enhancers (Table S2). NRL and CRX co-target genes were expressed at significantly higher levels in Group 3 tumors versus all other subgroups (Figure S1F). In contrast, genes without evidence of NRL or CRX binding showed minimal expression variation across subgroups (Figure S1F).
Within Group 3 MBs, we identified notable heterogeneity with respect to NRL and CRX expression and their associated enhancers, essentially dividing Group 3 into evenly distributed NRL/CRX-high vs. NRL/CRX-low sample categories (Figure 1G; Figure S1G,H). NRL and CRX proximal enhancer signals were highly correlated (ρ=0.63), consistent with their highly correlated expression (ρ=0.87) (Figure S1D). If NRL/CRX establish active enhancers in NRL/CRX-high Group 3 tumors, we would then expect an enrichment of NRL/CRX motifs at enhancers more highly acetylated (i.e. H3K27ac) in NRL/CRX-high tumors. We would also expect genes proximal to these differentially acetylated regions to be expressed and to play a role in photoreceptor identity. To test this hypothesis, we ranked all active genes in Group 3 tumors by the fold change in H3K27ac at their proximal cis-regulatory regions between NRL/CRX-high and NRL/CRX-low tumors. Leading edge analysis revealed a strong enrichment for NRL/CRX motifs at enhancers exhibiting increased H3K27ac in NRL/CRX-high tumors (Figure S1J, bottom). Additionally, increased H3K27ac levels at these genes correlated with increased gene expression (Figure S1J, middle). Gene set enrichment analysis (GSEA) of genes ranked by their change in H3K27ac between NRL/CRX-high and low tumors revealed a positive enrichment for rhodopsin pathway genes and a negative enrichment for genes associated with MYCN amplification (Figure 1H,I). Exemplary genes discriminating NRL/CRX-high vs. NRL/CRX-low tumors in Group 3 include CACNA2D1, a calcium channel subunit implicated in neuronal/retinal development (Geisler et al., 2015), with evidence of overlapping NRL and CRX co-motifs and high expression levels in NRL/CRX-high tumors (Figure 1J,L). In contrast, NRL/CRX-low tumors exhibit higher levels of ERN1, a serine/threonine kinase preferentially expressed in cortical, hippocampal, and olfactory neurons (Miyoshi et al., 2000) (Figure 1K,L).
Recent genomic studies have further defined molecular heterogeneity within consensus MB subgroups, reporting a varying degree of discrete ‘subtypes’ within subgroups (Cavalli et al., 2017; Northcott et al., 2017; Schwalbe et al., 2017). To determine whether the photoreceptor program defined by NRL and CRX is linked to particular subtypes, we analyzed NRL and CRX expression according to the Group 3/Group 4 substructure we recently reported for a large series of MBs profiled by DNA methylation array (Northcott et al., 2017). As depicted in Figure S3, both NRL and CRX are significantly elevated in subtypes III and IV, the latter of which are known to represent ‘pure’ Group 3 subtypes (Figure S3). Moderate NRL/CRX expression was also observed in other subtypes, especially NRL in subtypes I (‘mixed’ Group 3/Group 4 subtype) and II (‘pure’ Group 3 subtype) (Figure S3). These results confirm specificity of the photoreceptor program to Group 3 MB and contextualize this program according to newly defined MB subtypes. Moreover, the observed NRL expression in mixed Group 3/Group 4 subtypes (i.e. subtype I) provides a plausible explanation for the rare Group 4 MBs exhibiting evidence of an active photoreceptor program.
Collectively, these data suggest that increased NRL and CRX expression observed in Group 3 MB is attributable to a combination of epigenetic features (enhancer activity and DNA methylation status) and OTX2 regulatory function. Furthermore, the results above implicate NRL and CRX as highly active co-regulators responsible for the photoreceptor program observed in nearly half of all Group 3 MBs, with apparent specificity for recently described subtypes III and IV.
NRL and CRX are required for Group 3 MB growth in vivo
Based on our observations above linking NRL and CRX to the photoreceptor program underlying Group 3 MB identity, we next investigated the essentiality of this program for Group 3 MB viability. To this end, we identified two shRNAs for each TF that efficiently decreased their expression and studied the effects of shRNA-mediated NRL or CRX knockdown in the D458MED Group 3 MB cell line and a Group 3 PDX model, PDX1 (Figure 2). Knockdown of either CRX (Figure 2A to D) or NRL (Figure 2E to H) significantly increased the survival of mice upon orthotopic implantation, substantiating that both of these master TFs are required for the growth of the evaluated Group 3 models in vivo.
Figure 2: Inhibition of CRX or NRL decreases MB growth in vitro and reduces tumorigenicity in vivo.
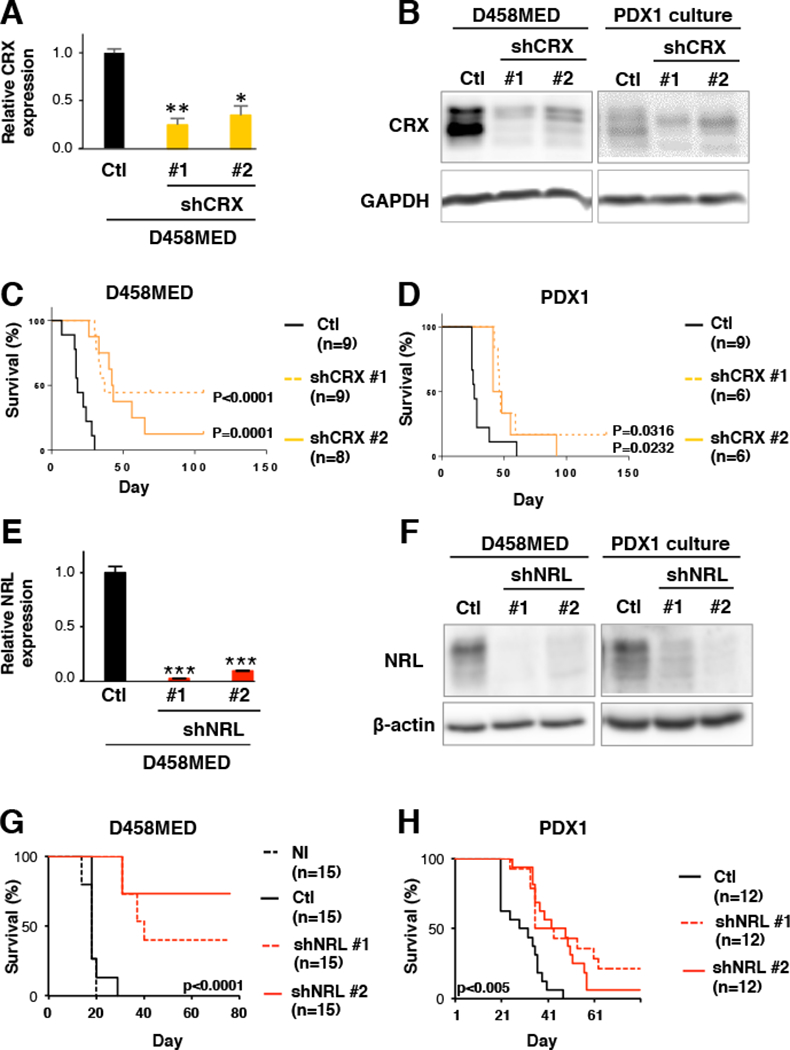
Effect of shRNA-mediated CRX (A-D) or NRL (E-H) knockdown in Group 3 MB models. Two independent shRNAs were identified that efficiently inhibited CRX (shCRX#1 and shCRX#2) or NRL (shNRL#1 and shNRL#2). (A and E) qRT-PCR performed on RNA extracted from D458MED cells transduced with lentivirus encoding control shRNA (Ctl, black bar) or shRNAs targeting CRX (A, yellow bars) or NRL (E, red bars). The p value was determined by unpaired t test. (B and F) Immunoblot analysis of CRX and NRL in control and knockdown cells as indicated. (C-D and G-H) Effect of shRNA-mediated CRX or NRL knockdown in D458MED cells and MB PDX1 in vivo. Control and CRX- or NRL-targeted D458MED cells were orthotopically engrafted into the cerebellum of nude mice and monitored for tumor development. NI: not infected (black dashes), Ctl: shRNA control (black line), (C-D) shCRX#1 and shCRX#2 (yellow dashes and line), (G-H) shNRL#1 and #2 (red dashes and lines). The number of mice per group is indicated. The p value for survival was determined by log-rank (Mantel-Cox) test. *p-value<0.01, **p-value<0.001, and ***p-value<0.0001. Bars represent the mean ± SD. See also Figure S5 and S6.
Given the results of the knockdown experiments and apparently redundant phenotypes observed subsequent to either NRL or CRX inhibition, we decided to more thoroughly investigate the role of one of these TFs, NRL, in Group 3 MB pathogenesis. We first verified that NRL is not expressed in the cerebellum during development (Figure S4). Next, we extended our in vivo dependency analysis to include an additional Group 3 cell line (Figure S5A to H) and an additional Group 3 MB PDX (PDX2, Figure S5I to P). Using these additional models, we observed a reduction of tumor growth and increased mouse survival upon NRL knockdown in vivo (Figure S5). We conversely performed gain of function experiments showing that ectopic expression of NRL increased the tumorigenic potential of MB cells not normally expressing the gene endogenously, both in vitro and in vivo (Figure S6). Taken together, these data further confirmed that NRL is required for Group 3 MB maintenance in vivo.
To gain a deeper understanding of the role of NRL in Group 3 MB maintenance, we performed a series of in vitro analyses evaluating the phenotypic effects of NRL perturbation in MB cell lines and PDX models (Figure 3 and 4). Cell viability was specifically decreased upon NRL knockdown in NRL-expressing D458MED and HDMB03 Group 3 MB cells but not in negative control (i.e. non-Group 3 MB) DAOY or ONS-76 cell lines lacking endogenous NRL expression (Figure 3A,B), demonstrating the subgroup specificity of the observed NRL dependency in Group 3. While no changes were observed in the cell cycle profiles of DAOY and ONS-76, a decrease in S-phase was observed in D458MED and HDMB03 upon NRL knockdown (Figure 3C), suggesting a block in cell cycle. MAF family TFs have been shown to modulate cell cycle progression by controlling CCND2 (Cyclin D2) expression in multiple myeloma (Eychene et al., 2008; Hurt et al., 2004). We showed that this regulation also takes place in MB. Indeed, NRL occupies the CCND2 promoter (Figure 3D) and NRL inhibition leads to a concordant decrease in CCND2 expression (Figure 3E,F). Cell cycle analysis also indicated a significant increase in sub-G1 content following NRL knockdown suggesting an induction of apoptosis (Figure 3C). To confirm these observations, the level of cleaved caspase 3 was measured by FACS analysis following NRL knockdown. In D458MED and HDMB03, there was a significant increase in apoptosis that was not observed in DAOY and ONS-76 cells (Figure 4A). We confirmed this decrease in cell viability coupled to pronounced apoptosis in Group 3 MB PDXs following NRL knockdown (Figure 4 B,C). Collectively, these data support a role for NRL in mediating cell cycle progression and protecting cells from apoptosis that appears to be Group 3-specific.
Figure 3: NRL affects cell cycle and controls CCND2 expression.
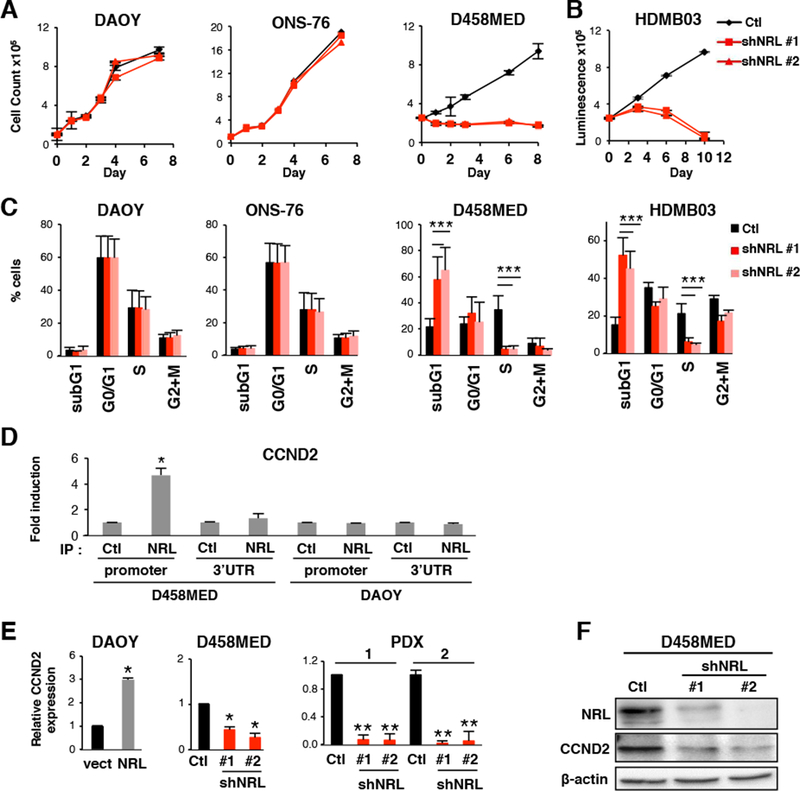
(A-C) Effect of shRNA-mediated NRL knockdown in NRL expressing cells (D458MED, HDMB03 or in non-expressing cells (DAOY and ONS-76). shRNA control (Ctl,black) and two shRNAs targeting NRL were used (shNRL#1 and shNRL#2, red) as indicated. (A) Growth curve analysis and (B) viability assay. (C) Cell cycle analysis by FACS. (D) ChIP analysis was performed by qPCR to analyze the binding of NRL to two different regions of the CCND2 locus, the MARE (Maf-Responsive-Element) containing region of the CCND2 promoter and the 3’ UTR (negative control). NRL antibody (IP NRL) or a control antibody (IP Ctl) were used in D458MED and DAOY cells. (E) Expression level of CCND2 by RT-qPCR in DAOY stably expressing NRL (NRL) relative to control DAOY transfected with the empty vector (vect), in D458MED or in PDX1 and 2 cultures following downregulation of NRL by shRNA (shNRL#1 and #2) relative to control shRNA (Ctl). The level of CCND2 mRNA was set at 1 for controls. (F) Expression level of CCND2 by immunoblot in D458MED expressing NRL-target shRNA (shNRL#1 and #2) and control shRNA (Ctl). Each experiment was performed in triplicate. Bars represent the mean ± SD. The p value was determined by unpaired t test. * p-value < 0.01, **p-value < 0.001, ***p-value<0.0001.
Figure 4: NRL protects Group 3 MB from apoptosis.
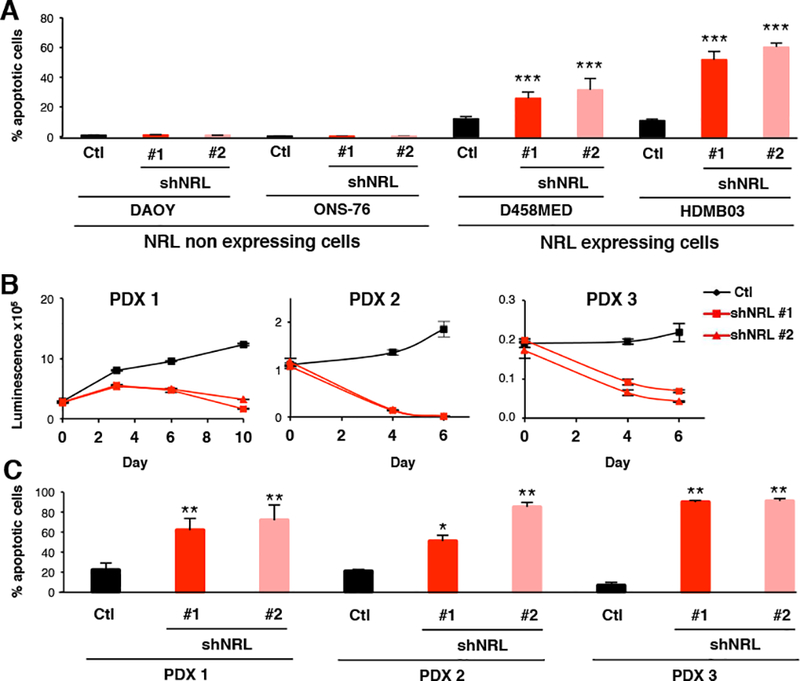
Effect of shRNA-mediated NRL knockdown in NRL expressing cells (D458MED, HDMB03 and three MB PDXs (PDX1–3)) or in non-expressing cells (DAOY and ONS-76). shRNA control (Ctl,black) and two shRNAs targeting NRL were used (shNRL#1 and shNRL#2, red) as indicated. (A, C) Apoptotic content measured by FACS analysis of cleaved caspase 3 and (B) viability assessed in PDX1–3 (Cell titer Glo Promega). Each experiment was performed in triplicate. Bars represent the mean ± SD. The p value was determined by unpaired t test. **p-value < 0.001, ***p-value<0.0001.
NRL is a master regulator TF responsible for the Group 3 photoreceptor program
Since our data above suggested NRL functions as a putative master TF in Group 3 MB, we next investigated how NRL loss impacts expression of the photoreceptor program and related Group 3-specific signature genes. To identify genes potentially regulated by NRL in Group 3, we expression profiled D458MED cells following shRNA-mediated NRL knockdown. Gene Ontology/Pathway analysis performed on differentially expressed genes demonstrated significant enrichment of gene sets related to the retina and visual perception (Figure 5A, see Table S3 for complete results). Accordingly, we found that expression of many photoreceptor genes (McEvoy et al., 2011) (Table S4) were significantly deregulated following NRL knockdown (41/193). Most photoreceptor genes were downregulated (36/41) compared to controls, suggesting that their expression is positively controlled by NRL (Figure 5B). We next looked for changes in expression of other known Group 3 signature genes (list of 197 genes in Table S5) (Kool et al., 2008). Among these 197 genes, 11 were significantly upregulated and 27 were significantly downregulated following NRL loss (Figure 5C). These results further support that NRL transcriptional activity is responsible, at least in part, for the photoreceptor program observed in Group 3 MB.
Figure 5: NRL is required for the photoreceptor program in Group 3 MB.
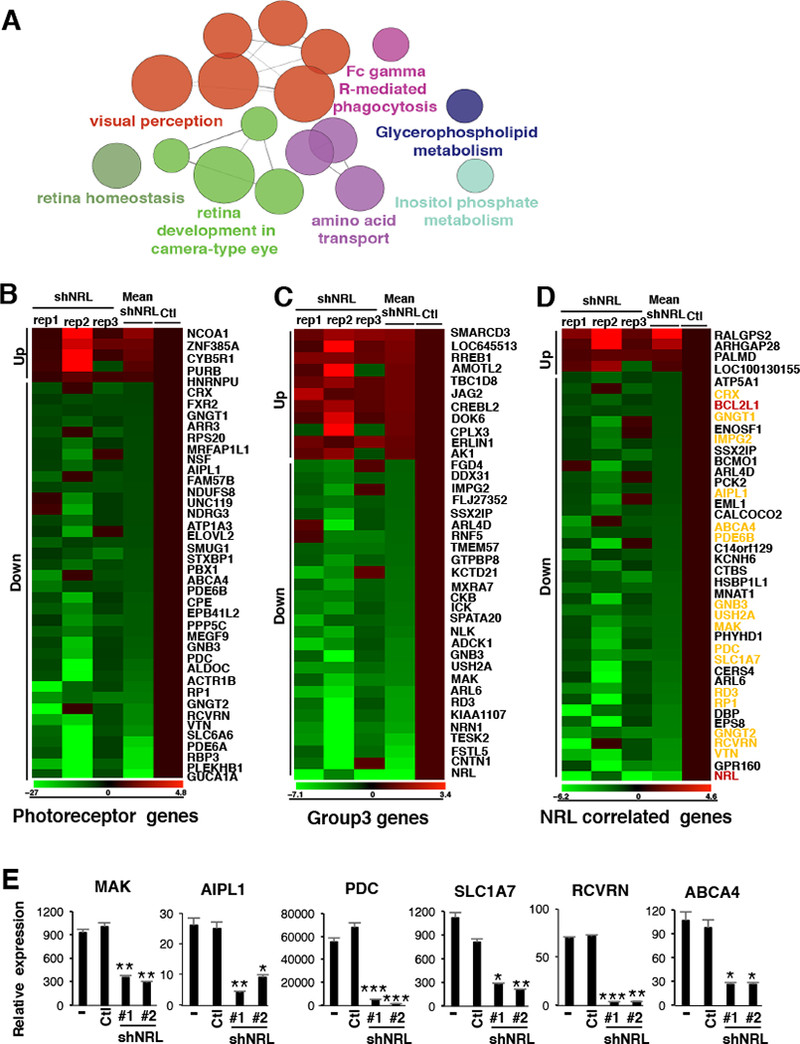
Transcriptional profiling was performed on D458MED cells following shRNA-mediated NRL knockdown. (A) KEGG pathways enriched in differentially expressed genes following NRL knockdown in D458MED. Nodes represent enriched gene sets and are sized proportional to significance. (B-D) Expression heatmap visualization of genes significantly altered in the context of NRL knockdown and representing known photoreceptor genes (B) (see the complete list in Table S4, (McEvoy et al., 2011)), Group 3 signature genes (C) (see the complete list in Table S5, (Kool et al., 2008)), or genes highly correlated (correlation score≥0.6) with NRL expression in human MB samples (D) (see the complete list in Table S6). In D, photoreceptor genes are highlighted in yellow and the candidate of interest, BCL2L1, in red. The relative expression obtained in the individual triplicate (shNRL rep1–3) knockdowns as well as the mean expression fold-change (mean shNRL knockdown relative to control cells (Ctl)) are shown (B-D). (E) RT-qPCR validation confirming the downregulation of a subset of photoreceptor genes following NRL knockdown (shNRL#1 and #2) in D458MED cells. Bars represent the mean ± SD. The p value was determined by unpaired t test. * p-value < 0.01, **p-value < 0.001, ***p-value<0.0001. See also Table S3 to S6.
We next sought to identify key genes involved in NRL-dependent MB maintenance and protection against apoptosis. To reduce the number of candidate genes and identify potentially relevant NRL targets in Group 3 MB, we first filtered our list to include those most highly correlated with NRL expression in human MB samples (correlation score≥0.6; n=140 genes; Table S6). Of highly correlated candidates, we investigated those whose expression was significantly altered in NRL knockdown cells (Figure 5D). This approach identified 41 NRL-correlated genes that were altered following NRL knockdown, 37 of which were downregulated, including several photoreceptor genes (labeled in yellow, Figure 5D). Using RT-qPCR, we validated the downregulation of a subset of these genes (including photoreceptor genes) after NRL knockdown (Figure 5E), confirming again the key role of NRL in regulation of the photoreceptor program in Group 3 MB.
In our filtered candidate list of NRL-regulated genes, we noted BCL2L1, an anti-apoptotic gene from the BCL2 family, also known as BCL-XL (labeled in red, Figure 5D). We then verified a positive correlation between BCL-XL and NRL expression in multiple human MB expression datasets (Figure 6A). A subset of tumors, including non-Group 3 subgroup MBs, exhibited high BCL-XL expression in the context of low NRL expression, suggesting that BCL-XL is likely regulated by other factors beyond NRL in some cases. Moreover, although variable BCL-XL expression was observed in other subgroups, its expression was consistently and significantly elevated in Group 3 across datasets (Figure 6B). We identified a potential MAF responsive element (MARE) in the human BCL-XL promoter matching the consensus sequence (Eychene et al., 2008; Kataoka, 2007) (Figure 6C) and sought to investigate whether BCL-XL is a direct target gene of NRL. To this end, we performed NRL ChIP in D458MED cells and, as a negative control, in NRL-negative DAOY cells (Figure 6D). NRL bound to the MARE-containing region of the BCL-XL promoter in D458MED cells but not to its 3’ UTR (Figure 6D). As expected, no NRL enrichment was found at the BCL-XL locus in the DAOY cell line. We next showed that BCL-XL expression is regulated by NRL in MB cells by stably expressing NRL in two non-NRL-expressing MB cell lines, DAOY and ONS-76 (Figure 6E,F). In contrast, BCL-XL expression was decreased when NRL expression was inhibited in D458MED cells and in two PDX lines (Figure 6E,F). These changes were observed both at the mRNA (Figure 6E) and protein levels (Figure 6F). Together, these data strongly support that BCL-XL is a direct NRL target gene in MB.
Figure 6: BCL-XL is a transcriptional target of NRL in Group 3 MB.
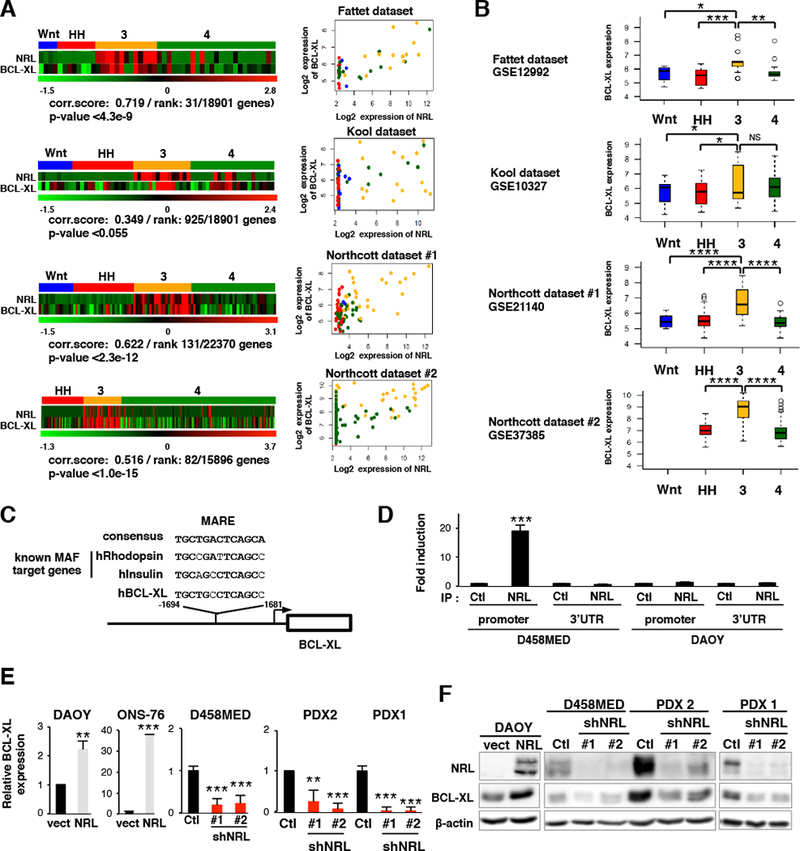
(A) Left, Heatmaps showing the expression of NRL and BCL-XL across MB subgroups in multiple published datasets: Fattet dataset, GSE12992 (Fattet et al., 2009), Kool dataset, GSE10327 (Kool et al., 2008), Northcott#1 dataset, GSE21140 (Northcott et al., 2011) and Northcott#2 dataset, GSE37385 (Northcott et al., 2012b). Pearson correlation scores (NRL expression versus BCL-XL expression) are indicated, as is the correlation rank of BCL-XL versus all other measured genes and the associated p-values. Right, Scatter plots summarizing the expression correlation between NRL and BCL-XL. MB subgroups are indicated by color: WNT (blue), SHH (red), Group 3 (yellow) and Group 4 (green). (B) Boxplots depicting the log2 expression of BCL-XL (BCL2L1) across MB subgroups for each of the published datasets summarized in (A). Boxplot center line shows data median, box limits indicate 25th and 75th percentiles, lower and upper whiskers represent 1.5x the interquartile ranges respectively. Outliers are represented by individual dots. (C) A potential MARE (Maf-Responsive-Element) in the human BCL-XL promoter is depicted. The sequence is compared to the MARE consensus sequence and to MAREs of established MAF target genes. (D) ChIP analysis of two different regions of the BCL-XL locus, the MARE-containing region of the promoter and the 3’ UTR (negative control). qPCR results for anti-NRL ChIP (IP NRL) or a control ChIP (IP Ctl) in D458MED and, as a negative control, in NRL non-expressing DAOY cells are shown. (E-F) Expression level of BCL-XL assessed by RT-qPCR (E) or immunoblot (F) in MB cell lines and PDX models in the context of exogenous NRL expression or NRL knockdown as indicated. The level of BCL-XL mRNA was set at 1 for controls. Bars represent the mean ± SD. The p value was determined by unpaired t test. *p-value <= 0.5, **p-value<0.05, ***p-value<0.005, ****p-value<0.0005.
To further substantiate the role of BCL-XL downstream of NRL in MB, we performed rescue experiments by ectopically expressing BCL-XL in order to compensate for its reduced expression upon NRL knockdown both in D458MED (Figure 7A,B and D) and in HDMB03 (Figure 7A,C and E). As observed above, NRL knockdown decreased cell viability (Figure 7B,C) and induced apoptosis (Figure 7D,E), whereas ectopic BCL-XL expression effectively rescued these phenotypes (Figure 7B to E). These data substantiate that NRL protects MB from apoptosis by directly regulating BCL-XL expression. To investigate BCL-XL as a potential vulnerability in Group 3 MB, we next performed shRNA-mediated knockdown of BCL-XL in Group 3 D458MED cells and a Group 3 PDX model. Consistent with our NRL knockdown results above, BCL-XL knockdown resulted in decreased cell viability and increased apoptosis in vitro (Figure 7F to H) and prolonged the survival of mice engrafted with BCL-XL-targeted Group 3 cell line or PDX in vivo (Figure 7I,J).
Figure 7: BCL-XL is a potential therapeutic target downstream of NRL.
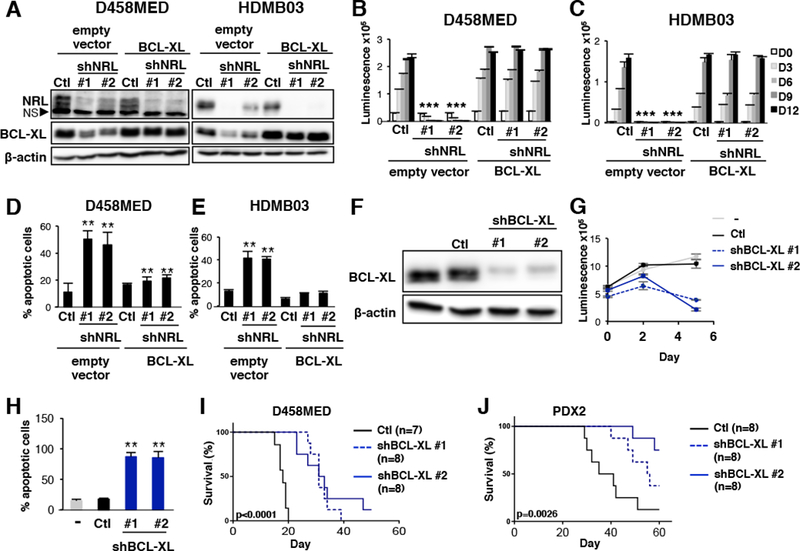
(A-E) Rescue experiments were performed in D458MED (A,B,D) and HDMB03 (A,C,E) MB cells. Cells were co-infected by lentivirus encoding control shRNA (Ctl), shRNA targeting NRL (shNRL#1 and #2) together with either a control vector (empty vector) or a BCL-XL-encoding retrovirus (BCL-XL). The level of the different proteins was analyzed by immunoblot (NS: non specific)(A). Cell viability (B-C) and the level of apoptosis quantified by measuring cleaved caspase 3 by FACS (D-E) were assessed. The p value was determined by unpaired t test. (F) Immunoblot conducted with the indicated antibodies on D458MED cells transduced with control shRNA (Ctl) or shRNAs targeting BCL-XL (shBCL-XL#1and #2). (G) Cell viability of D458MED cells transduced with lentivirus encoding control shRNA (Ctl, black line), or shRNA targeting BCL-XL (shBCL-XL#1 and shBCL-XL#2, in dark blue dashes and line). (H) The percentage of apoptosis was assessed in these different cultures by measuring cleaved caspase 3 levels by FACS. (I-J) Control and BCL-XL-targeted D458MED (I) or PDX2 (J) cells were orthotopically engrafted into the cerebellum of nude mice. Kaplan Meier survival curves for these mice are shown: Ctl: shRNA control (black line), shBCL-XL#1 and shBCL-XL#2 (dark blue dashes and line). The p value for survival was determined by log-rank (Mantel-Cox) test. **p-value<0.001. Bars represent the mean ± SD.
Pharmacological inhibition of BCL-XL in MB
Since BCL inhibitors represent attractive therapeutic targets in cancer (Juin et al., 2013), we next assessed sensitivity of MB cells to an inhibitor of the BCL2 family by treating MB cell lines and a Group 3 PDX line with ABT737 in vitro. While this treatment had no effect on non-cancerous cells (RPE-1), it profoundly decreased cell viability and induced apoptosis of D458MED and HDMB03 cells as well as that of PDX1 (Figure S7). Since ABT737 does not cross the blood-brain barrier (Crowther et al., 2013), we next investigated the effect of the pan-BCL inhibitor TW37. We first confirmed the in vitro observations obtained with ABT737 (Figure 8A,B). We then evaluated its efficacy in vivo (Figure 8C to K). Mice implanted with Group 3 D458MED cells or PDX2, both engineered to express luciferase, were treated with TW37 two days after transplantation (Figure 8C to H). A significant decrease in tumor formation was observed following TW37 treatment for both D458MED (Figure 8C,D) and PDX2 (Figure 8F,G). This resulted in significantly prolonged survival in both models (Figure 8E,H). We next tested whether TW37 could cause regression of pre-established MB tumors (Figure 8I to K). Mice were orthotopically implanted with D458MED cells and left untreated to allow for tumor formation. Upon detection of established tumors (day 9 post-implantation), mice were segregated into control and treatment groups (Figure 8I to K) and monitored for tumor growth. TW37 treatment not only diminished tumor progression but also decreased tumor mass (Figure 8I,J). This resulted in a significant increase in mouse survival (Figure 8K). Treated mice showed substantial decreases in tumor mass with near complete disappearance of luciferase signals observed for some animals (Figure 8I,J). Although treatment stopped after day 18, 4/11 mice remained alive after more than 90 days, strongly suggesting that they were cured by TW37 treatment.
Figure 8: The BCL inhibitor TW37 attenuates MB growth in vitro and in vivo.
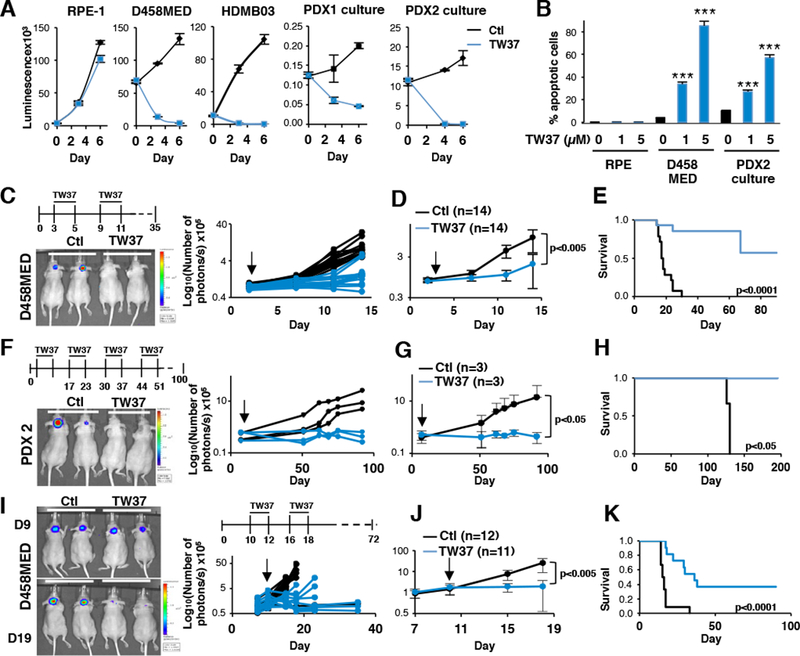
The effect of TW37 (shown in blue) was compared to vehicle (shown in black) on different models in vitro and in vivo. (A) Cell viability was measured in vitro by luminescence using Cell titer Glo assay in control or in TW37 treated cells as indicated (RPE-1: non-cancerous hTERT-immortalized cell line). Cells were treated every 2 days with 5μM of TW37. (B) Apoptosis was assessed by measuring cleaved caspase 3 levels by FACS 48hrs after seeding in control conditions or upon TW37 treatment (1 and 5μM). D458MED (n=14 for each group) (C-E) and PDX2 (n=3 for each group). The p value was determined by unpaired t test. (F-H) cells stably expressing luciferase were orthotopically engrafted into the cerebellum of nude mice. Intravenous injection of TW37 (30mg/kg) or vehicle was started 2 days later. Protocols of treatment are indicated (top of panels C and F). Tumor growth was assessed by bioluminescence using IVIS imaging. (C and F, left panels) An image of luciferase signal obtained from representative mice is shown. (C and F right panels) Quantification of the bioluminescence signal for each individual mouse and (D and G) its average for each group. p values were determined by the sum-of-squares F test. (E and H) Kaplan Meier survival curves. (I-K) The effect of TW37 treatment was assessed on established tumors upon orthotopic engrafting of luciferase expressing D458MED cells. Mice were left untreated for 9 days until tumor growth was established (luciferase signal of ~105 photons/s). Mice were treated twice during 3 days (n=12 for the vehicle (Ctl) vs n=11 for TW37 at 30mg/kg) as indicated (panel I top, treatment protocol is depicted). (I, right panel) Tumor growth was estimated by bioluminescence quantification for each individual mouse or (J) an average of the signal was calculated for each group. (I, left panel) Representative image of the bioluminescence signal observed at the start of treatment (day 9) and just after the last treatment (day 19). (K) Kaplan Meier survival curves for each group. The p value for survival was determined by log-rank (Mantel-Cox) test for each Kaplan Meier survival curves. ***p-value<0.0001. Bars represent the mean ± SD. See also Figure S7.
DISCUSSION
Group 3 MB, the most aggressive and incurable subgroup of the disease, is transcriptionally characterized by a photoreceptor differentiation program of unknown biological significance (Taylor et al., 2011). We investigated how this photoreceptor program relates to MB biology and identified two photoreceptor-specific TFs, NRL and CRX, as master regulators responsible for establishing this phenotype. Furthermore, we demonstrated that NRL and CRX are required for MB maintenance and persistence of the photoreceptor transcriptional program. At the mechanistic level, we focused our functional assays on the lineage-specific TF, NRL, and demonstrated that NRL mitigates cell cycle progression and evasion of apoptosis by directly inducing expression of CCND2 (CyclinD2) and BCL-XL, respectively. Finally, we established that the NRL target gene, BCL-XL, represents a candidate therapeutic vulnerability in Group 3 MBs exhibiting an active photoreceptor program.
Development and application of advanced computational pipelines to large MB ChIP-seq and RNA-seq datasets (Lin et al., 2016) showed that Group 3-specific enhancers/SEs are enriched in the regulatory elements of photoreceptor genes. Our results together with those observed in published gene expression datasets (Cho et al., 2010; Fattet et al., 2009; Kool et al., 2008; Northcott et al., 2011; Thompson et al., 2006) consistently demonstrated the specificity of the retinal/photoreceptor signature in Group 3 MB. Analysis of the regulatory circuitry governing the Group 3 enhancer landscape identified two photoreceptor-specific TFs, NRL and CRX, as master regulators defining Group 3 MBs that exhibit an active photoreceptor program. NRL and CRX expression is largely restricted to Group 3 MBs and, based on our observation confirming OTX2 occupancy at Group 3-specific enhancers proximal to the genes encoding these TFs, are likely regulated by OTX2. Accordingly, H3K27ac marks and OTX2 expression were positively correlated with NRL and CRX expression, whereas DNA methylation levels of NRL/CRX regulatory elements were inversely correlated with their expression. Collectively, our results suggest that the observed NRL and CRX expression in Group 3 MB is coordinated through a combination of subgroup-specific regulatory elements and OTX2 transactivation.
NRL and CRX are known master regulators of photoreceptor development and differentiation in the developing retina (Swaroop et al., 2010). Indeed, several photoreceptor genes are known to be regulated by NRL/CRX co-occupancy within their regulatory regions (Hao et al., 2012; White et al., 2016). Interestingly, a similar co-regulatory function of NRL/CRX appears to hold true in Group 3 MB. Specifically, our analyses demonstrated a high level of correlation between NRL and CRX expression and identified a network of computationally inferred co-target genes containing NRL and CRX binding sites in close proximity (co-motifs) within their associated enhancers/SEs. Importantly, the expression of these inferred target genes is significantly higher in Group 3 tumors than other subgroups, further supporting the specificity of the NRL/CRX axis as a signature feature of Group 3 MB. It is noteworthy that, while the NRL/CRX axis is mainly restricted to Group 3, rare Group 4 MBs also express these two TFs. This is in agreement with previous reports showing that ~10% of Group 3 and Group 4 MB samples exhibit transcriptional/epigenetic overlap, including the retinal/photoreceptor transcriptional program (Kool et al., 2008; Cho et al.,2011). This recognized overlap may explain why a small fraction of Group 4 MBs exhibit high levels of NRL/CRX. The recent demonstration of intragroup heterogeneity (Cavalli et al., 2017; Northcott et al., 2017; Schwalbe et al., 2017) further contextualizes these observations, as we noted high NRL/CRX expression mainly in pure Group 3 subtypes (namely subtypes II and III) and to a lesser extent in mixed subtypes (namely NRL in subtype I). shRNA-mediated perturbation of NRL and subsequent transcriptional analysis of targeted cells validated the computational inferences we derived from primary enhancer/transcriptome datasets, confirming that NRL controls the photoreceptor program and a subset of Group 3 signature genes. Surprisingly, although Group 3 MBs are often generalized as a subgroup defined by aberrant MYC expression across the subgroup (Roussel and Robinson, 2013), we observed an inverse correlation between the photoreceptor program defined by NRL/CRX activity and gene sets associated with MYC family amplification. This observation is consistent with the concept of intra-subgroup heterogeneity in MB (Cavalli et al., 2017; Northcott et al., 2017; Schwalbe et al., 2017) and thus, our data further support that Group 3 MBs are comprised of molecularly and phenotypically distinct subtypes. Importantly, we showed that NRL/CRX are not only responsible for regulating the photoreceptor program in Group 3, but are also required for maintenance of the malignant phenotype of these tumors. Indeed, NRL and CRX knockdown in Group 3 cell lines and PDX slowed MB cell growth both in vitro and in vivo.
As a paradigm, we performed a more granular analysis studying the role of NRL in MB biology using a combination of loss and gain of function approaches. We also established that NRL is involved in MB maintenance through at least two plausible mechanisms: enhancing cell cycle progression and protecting cells from apoptosis. As reported for other MAF family TFs (Eychene et al., 2008; Hurt et al., 2004), we showed that NRL can induce CyclinD2 expression. Likewise, we also identified BCL-XL as a key transcriptional target of NRL that protects MB cells from apoptosis. Under physiological conditions, NRL does not protect photoreceptors from apoptosis and BCL-XL has not been previously identified as an NRL or MAF family target gene (Mears et al., 2001; Yoshida et al., 2004). In MB, we established that BCL-XL is a downstream effector of NRL-mediated survival. Indeed, we demonstrated that BCL-XL is sufficient to rescue apoptosis and viability upon NRL inhibition. Interestingly, we also showed that shRNA-mediated ablation of BCL-XL strongly induced apoptosis, decreased cell viability in vitro and, increased mouse survival upon orthotopic grafting in vivo. These observations nominate BCL-XL as a promising candidate therapeutic target in Group 3 MB.
Therapeutically, we exploited our discovery of BCL-XL and its apparent protective role in Group 3 MB by treating MB cells and engrafted mice with multiple pharmacological inhibitors known to target BCL proteins, including ABT-737 and TW37. In vivo, TW37, a pan-BCL2 inhibitor, decreased tumor growth of orthotopically engrafted Group 3 MB cells and a PDX model. We showed that anti-BCL therapy not only decreased tumor growth but, more importantly, also caused a significant reduction in the growth of pre-existing tumors. Indeed, almost complete tumor regression was observed in some animals. These promising results should nevertheless be tempered since TW37 is a pan-BCL inhibitor that targets multiple BCL family proteins. Likewise, this pharmacological agent cannot be used in human therapy due to severe toxicities (Juin et al., 2013). Specific anti-BCL-XL inhibitors with better pharmacokinetics, reduced side effects, and ability to cross the blood-brain barrier are clearly warranted (Juin et al., 2013).
In conclusion, as observed in the most aggressive subgroup of MB, cancers can express aberrant differentiation programs of unknown significance that lack any obvious connection to their developmental origins. Here, we showed that such a program defined by a prominent photoreceptor signature is established through the activity of two photoreceptor-specific TFs, and substantiated the requirement of this TF-driven photoreceptor program for MB maintenance in a specific subgroup of patients. Our results establish the relevance of such understudied phenotypes that are often considered as a ‘side-effect’ of cancer cell plasticity and demonstrate how gaining a deeper understanding of these cellular programs can reveal therapeutic vulnerabilities in otherwise poorly understood cancers.
STAR METHODS
CONTACT FOR REAGENT AND RESOURCE SHARING
“Further information and requests for resources and reagents should be directed to and will be fulfilled by the Lead Contact, Celio Pouponnot (celio.pouponnot@curie.fr).”
EXPERIMENTAL MODEL AND SUBJECT DETAILS
In vivo animal studies:
Animal care and use for this study were performed in accordance with the recommendations of the European Community (2010/63/UE) for the care and use of laboratory animals. Experimental procedures were specifically approved by the ethics committee of the Institut Curie CEEA-IC #118 (Authorization 02383.02 given by National Authority) in compliance with the international guidelines.
Orthotopic transplantation and bioluminescence imaging of tumor growth
5-week old female Swiss Nude (CRL) mice were anesthetized with 2.5% isoflurane and locally with bupivacaine. The head was fixed in a stereotaxic frame (Kopf Instruments) using ear bars. A small incision was made into the skull 2 mm lateral and 2 mm anterior to the Lambda using a 25G needle. 105 cells expressing luciferase were injected into the right caudate/putamen to a depth of 3 mm through a Hamilton syringe at a rate of 1μl/min using a microinjection system. Mice were injected with buprenorphine and monitored for signs of paralysis and distress. Tumor growth was followed with luciferase activity of injected cells. Mice were given intraperitoneal injections of 50 mg/kg D-Luciferin (Caliper Life Sciences) and anesthetized with 2.5% isoflurane. 15 min after injection, animals were imaged using the Xenogen Ivis Spectrum imaging system (Perkin-Elmer) and Living image software. At the end of the experiment, mice were euthanized and brains were collected. Brains were immediately fixed in 4% formaldehyde and then embedded in paraffin using conventional systems. 5 μm sections were stained with hematoxylin-eosin (HE). Tumor areas were quantified using Image J software. For inhibitor treatment, 5-week old female Swiss Nude mice were injected orthotopically with luciferase expressing cells. Mice were randomly assigned to different experimental groups, were treated with 30mg/kg of TW37 (in vehicle: PBS/Tween 80/ethanol) as indicated in the figures. Tumor growth was followed by bioluminescence as described in the “Experimental Procedures” section. At the end of the experiment, mice were euthanized and brains were collected and fixed overnight in 4% formaldehyde/PBS.
Subcutaneous injections
10×106 tumor cells were injected in the right flank of 5-week female Swiss Nude mice (CRL). Tumor growth was measured every week.
Patient-derived xenografts and PDX cultures
MB patient-derived xenograft (PDX) models were developed from primary tumor samples of previously untreated patients, implanted into the neck fat pad of Nude mice. In all cases, primary human brain tumor specimens were obtained under written informed consent approved by the Internal Review Board of the Necker Sick Children’s Hospital, Paris, France. The protocol also complied with internationally established 3R principles, in accordance with the UKCCCR guidelines. Once established, PDX models were maintained by serial passages in Nude mice. PDX1, PDX2, PDX3 and PDX4 correspond to ICN-MB-PDX-3, ICN-MB-PDX-4, IC-MB-PDX-1 and ICN-MB-PDX-7 respectively. For in vitro cultures, tumors were dissociated in a buffer containing 1mg/ml DNaseI (Worthington Biochemicals), 2.5mg/ml Collagenase P (Roche), 2.5mg/ml Collagenase/dispase (Roche), B27 supplement (Invitrogen), N2 supplement (Invitrogen), Neurobasal medium (Gibco). Then, they were cultured in Neurobasal medium (Gibco) supplemented with B27 supplement (Invitrogen), N2 supplement (Invitrogen), 0.01% BSA solution (Invitrogen), 1% L-Glutamine (Invitrogen), 1% penicillin/streptomycin (Invitrogen) and 20ng/ml human bFGF/EGF (Peprotech), in low adhesion flasks (Sigma-Aldrich).
Cell Lines
Medulloblastoma cell lines (D458MED (obtained from Dr. Bigner) (He et al., 1991), DAOY (ATCC), HDMB03 (obtained from Dr. Milde) (Milde et al., 2012), ONS-76 (Health Science Research Resources Bank) were cultured in improved MEM, MEM and RPMI 1640 medium (GIBCO), respectively, supplemented with 10% fetal bovine serum (GIBCO), 100 units/mL penicillin, and 100 μg/mL streptomycin (Invitrogen), 1.25 μg/ml fungizone (Invitrogen). HDMB03 Medium was supplemented with 0.1mM non-essential amino acids. DAOY Medium was supplemented with 0.1mM non-essential amino acids and 1mM sodium pyruvate. Human retina pigmented epithelium cells immortalized with hTERT (hTERT-RPE-1, named RPE-1) were cultured in DMEM:F12 medium (Gibco) supplemented with 10% fetal bovine serum (GIBCO), 100 units/mL penicillin, and 100 μg/mL streptomycin (Invitrogen), 1.25μg/ml fungizone (Invitrogen). All cells were cultured at 37°C in a humidified atmosphere containing 5% CO2.
METHOD DETAILS
shRNA and lentiviral production and infection
Lentiviral pLKO vectors encoding shRNA targeting NRL (NM_006177, clones TRCN0000015372 for shNRL#1, TRCN0000015369 for shNRL#2), BCL-XL (NM_001191 TRCN0000033499 for shBCL-XL#1 and TRCN0000033500 for shBCL-XL#2), or CRX (TRCN0000013731 for shCRX#1 and TRCN0000013732 for shCRX#2) were obtained from Sigma-Aldrich. Lentiviruses were produced in 293T cells, by co-transfecting pLKO-derived vectors and the packaging plasmids pS-PAX2 and pMD2-VSVG, using lipofectamine 2000 (Invitrogen). Lentiviral particles were harvested 48–60–72 h post-transfection. 2×10⁶ D458Med, 5×10⁵ DAOY and ONS-76, 106 HDMB03 were infected and selected with puromycin (1μg/ml).
Bioinformatics analyses
Microarray analyses.
Human medulloblastoma expression profiles were previously described. They were generated on Affymetrix 133Plus2.0 (GSE10327 (Kool et al., 2008); GSE12992 (Fattet et al., 2009), Human Exon 1.0st GSE21140 (Northcott et al., 2011) and Human Gene1.1st GSE37385 (Northcott et al., 2012b). Gene expression data were normalized using gcRMA algorithm on custom BrainArray CDF (Dai et al., 2005). After elimination of background and invariant genes using RIQR, MB samples from Kool et al. (2008) and Fattet et al. (2009) were reclassified into the 4 molecular subgroups (Northcott et al., 2011) by average linkage hierarchical clustering using Pearson correlation distance. Heatmaps were performed after scaling expression data. Pearson’s correlation was estimated between NRL and BCL-XL expression for all datasets, and between NRL and other gene expression on Fattet et al. samples. RNAs from three independent cultures of D458MED infected with lentiviruses encoding shRNA control or targeting NRL were extracted five days postinfection. cDNA were prepared and hybridized to Affymetrix Human Gene 2.1st according to the manufacturer’s instructions on the Genomic platform of the Curie Institute. Gene expression data were normalized using gcRMA algorithm on custom BrainArray CDF (Dai et al., 2005). After background elimination, we compared and identified differentially expressed genes between shRNA targeting NRL and control replicates and means of replicates using Fold-Change (|FC|>1.4). No scaled heatmaps were performed on the FC values obtained between shRNA targeting NRL and control based on group 3 (Kool et al., 2008); photoreceptor (McEvoy et al., 2011) gene signatures and the most correlated genes with NRL in the Fattet’s dataset (Fattet et al., 2009) (correlation score ≥0.6). The microarray data has been deposited at the Geowebsite under the number GSE103902. All these analyses were performed with R software environment.
Genomic coordinates and gene annotation.
All coordinates in this study were based on human reference genome assembly hg19, GRCh37 (ncbi.nlm.nih.gov/assembly/2758/). Gene annotations were based on genecode annotation release 19 (gencodegenes.org/releases/19.html).
Data sources.
Primary medulloblastoma ChIP-seq and RNA-seq data were obtained from Lin et al., Nature 2016 which are deposited at the European Genome-Phenome Archive (EGA, http://www.ebi.ac.uk/ega/) hosted by the EBI, under accession number EGAS00001000215 (Lin et al., 2016). Whole genome bisulfite data was deposited under accession number EGAS00001000561 (Hovestadt et al., 2014).
Calculating read density.
We calculated the normalized read density of a ChIP-Seq dataset in any genomic region using the Bamliquidator (version 1.0) read density calculator (github.com/BradnerLab/pipeline/wiki/bamliquidator). Briefly, ChIP-Seq reads aligning to the region were extended by 200bp and the density of reads per base pair (bp) was calculated. The density of reads in each region was normalized to the total number of million mapped reads producing read density in units of reads per million mapped reads per bp (rpm/bp).
Plotting meta representations of ChIP-Seq signal.
To compactly display medulloblastoma H3K27ac ChIP-Seq signal at individual genomic loci and across subgroups, we developed a simple meta representation (Figure 1E, F, K, L and S1E, S1F). For all samples within a group, ChIP-Seq signal is Fsmoothed using a simple spline function and plotted as a translucent shape in units of rpm/bp. Darker regions indicate regions with signal in more samples. An opaque line is plotted and gives the average signal across all samples in a group.
Defining Group 3 super-enhancers, all enhancers and promoters.
Group 3 super-enhancers were defined as in Lin et al. (Lin et al., 2016) using H3K27ac peak definitions from that study. Briefly, we defined Group 3 super-enhancers as the union of all super-enhancer containing regions across 8 Group 3 primary medulloblastoma: MB-4M26, MB90, MB95, MB9, MB-4M23, MB-4M77, MB18, MB36. Super-enhancers were defined using the ROSE2 software (github.com/linlabbcm/rose2/) with a TSS exclusion parameter (-t) of 2500 and a stitching parameter (-s) of 12500. Regions were filtered for inclusion in the ENCODE blacklist: https://sites.google.com/site/anshulkundaje/projects/blacklists
All active enhancers and promoters were similarly defined as the union of all H3K27ac peaks within this cohort.
Defining top Group 3 interconnected TF network.
The interaction network of super-enhancer associated TFs in Group 3 was defined as in Lin et al. (Lin et al., 2016) with the exception that additional MAF motifs were assigned to NRL. A list of motifs used for each TF can be found in https://www.charleslinlab.org/garancher_2018. To determine the top interconnected network, we ranked all fully interconnected TF networks by their average clique score. For any TF, clique score is determined as the number of cliques containing a TF divided by the total number of cliques present in the network.
Correlating NRL & CRX enhancer activity to gene expression.
Across all medulloblastoma samples, we correlated the enhancer H3K27ac load (fold signal vs. median enhancer in that sample) to gene expression (FPKM). A Pearson correlation statistic was determined.
Plotting DNA methylation signal.
DNA methylation signal at the CRX and NRL loci was plotted from WGBS data (see data sources above) as a heat map shaded from 0–1 and representing fractional cytosine methylation in any given region.
Defining NRL & CRX co-target genes.
NRL and CRX co-target genes were defined as super-enhancer associated (within 50kb of a super-enhancer) active genes (>1FPKM in at least 1 Group 3 sample) containing at least 1 NRL and CRX motif within 100bp of one another. This produced 386 NRL & CRX co-target genes. Non-target genes were defined as active genes without any NRL or CRX motifs in their respective super-enhancer. This produced 203 non-target genes. The expression of each of these sets across medulloblastoma subgroups is shown in Figure 1G. The difference in the means of each set was tested for significance using a Welch’s two-tailed t-test (*** p<10−9,** p<10−6, * p<10−3, NS p>0.01.
Defining NRL & CRX high and low cohorts in Group 3 samples.
To define Group 3 medulloblastoma with high or low NRL & CRX levels, we first determined the gene expression for NRL & CRX across all 8 Group 3 tumors analyzed (Figure 1H). Visual inspection of expression levels revealed a natural division within these tumors that separated a NRL & CRX high vs. low cohort. A cutoff of 10 FPKM for NRL and 5 FPKM for CRX was used.
Ranking genes by change in H3K27ac between NRL & CRX high and low cohorts.
Each active gene in Group 3 medulloblastoma (>1 FPKM in at least 1 sample, n =10,498) was ranked by the log2 fold change in cumulative H3K27ac signal at proximal promoters and enhancers between the NRL & CRX high and low cohorts. Cumulative H3K27ac signal represents the total H3K27ac area under curve (AUC) signal represented in units of rpm for all H3K27ac peaks in Group 3 within 50kb of the gene TSS.
Performing leading edge analysis on Group 3 active genes ranked by NRL & CRX H3K27ac change.
Group 3 active genes as ranked above were analyzed for leading edge enriched gene sets by using GSEA (software.broadinstitute.org/gsea/) to interrogate the enrichment of either MSigDB C2 curated gene set (software.broadinstitute.org/gsea/msigdb) (Figure 1J) or a custom gene set of the 384 NRL & CRX super-enhancer associated co-target genes (Figure S1F). GSEA was performed using the following parameters: -collapse false -mode Max_probe -norm meandiv -nperm 1000 -permute gene_set -rnd_type no_balance -scoring_scheme weighted -metric log2_Ratio_of_Classes -sort real -order descending -include_only_symbols true -make_sets true -median false -num 100 -plot_top_x 50 -rnd_seed timestamp -save_rnd_lists false -set_max 500 -set_min 15. Input files and exact commands for GSEA can be found at https://www.charleslinlab.org/garancher_2018.
Correlating gene expression changes to changes in H3K27ac between NRL & CRX high and low cohorts.
We sought to determine whether genes ranked by change in cumulative H3K27ac promoter/enhancer signal also exhibited corresponding changes in gene expression. Group 3 active genes were ranked by change in H3K27ac as above and distributed into 100 bins resulting in 104 genes/bin. In each bin, the average change in gene expression between NRL & CRX high and low cohorts was determined for all genes in the bin and plotted. Error bars represent the 95% confidence interval of the mean as determined by empirical resampling.
In situ Hybridization (ISH)
Embryos or new born mice were collected at different stages. Brains were dissected and postfixed overnight in PFA at 4°C. Tissues were then dehydrated in 30% (w/v) sucrose at 4°C for 24 hours, embedded in Tissue-Tek OCT compound (VWR Chemicals), frozen and sectioned at 12μm. ISH was performed essentially as described in (Riddle et al., 1993) with an additional 10 min incubation with RNAse A (Roche, 10 mg/ml in 10 nM Tris pH 7.5, 500 mM NaCl and 1 mM EDTA buffer) after hybridization. The NRL probe was kindly provided by Pr. J. Corbo (Montana et al., 2011). Dioxygenin-labeled riboprobes were synthesized as described previously (Lecoin et al., 2010). After linearization with EcoRI, the sense probe was transcribed by T7 RNA polymerase. For the anti-sense probe, NotI and the T3 polymerase were used.
Real time RT-PCR
Total RNAs were extracted using RNeasy Plus mini kit (Qiagen) and reversely transcribed with the Cloned AMV First-Strand cDNA Synthesis Kit (Invitrogen). Quantitative real-time PCR assays were conducted using SYBR Green real-time PCR Master Mix and real-time PCR amplification equipment (Applied Biosystem).
Constructs and transfection
The pcDNA3-NRL plasmid was obtained by inserting the NRL coding region into the BamH1 and EcoRI restriction sites of the pcDNA3 vector (Invitrogen). The pcDNA3 Luciferase was obtained by subcloning the Luciferase cassette from the PGL2Luc vector (Promega). The lentiviral vector pCCL-c-MNDI3c-LUC-PGK-EGFP coding for the Luciferase and GFP genes (Duy et al., 2011) and pMSCV-human-BCL-XL-IRES-GFP plasmid (Dolznig et al., 2002) were described elsewhere. Lentiviral pLKO constructs encoding shRNA Ctl (SHC202) or targeting NRL (NM_006177, clones TRCN0000015372 for shNRL#1, TRCN0000015369 for shNRL#2), BCL-XL (NM_001191, clones TRCN0000033499 for shBCL-XL#1 and TRCN0000033500 for shBCL-XL#2), CRX (NM_000554, clones TRCN0000013731 for shCRX#1 and TRCN0000013732 for shCRX#2) were purchased from Sigma-Aldrich.
Apoptosis and cell cycle analyses by flow cytometry
Cells (5×10⁵ cells/well) were grown in 6-well plates for 72 h. Apoptosis was measured using the Caspase-3 active form (cleaved Caspase-3) mAb Apoptosis Kit, FITC (BD bioscience). The signals were detected by a FACScalibur cytometer (BD biosciences). The percentage of apoptotic cells was determined using FlowJo software (Tree Star).
Cell cycle analysis was performed using APC BrdU flow kit (BD bioscience). The signals were detected a by FACScalibur cytometer (BD biosciences) and analyzed using FlowJo software (Tree Star).
Inhibitor treatments
For in vitro assays, the TW37 and ABT737 inhibitors (Selleckchem) were used at a concentration of 0.5 μM, 1μM or 5μM in DMSO.
Western blotting and antibodies
Cell extracts and Western blot analyses were performed as previously described (Rocques et al., 2007). Membranes were probed with anti-NRL (AF2945, R&D systems, 1/1000), anti-BCL-XL (mAb#2767, Cell signaling, 1/1000), anti-βactin (A1978, Sigma, 1/5000), anti-OTX2 (AB9566, Millipore, 1/10000) antibodies, at 4°C overnight. Signals were acquired using a CDD camera (G:BOX, Syngene).
Chromatin Immunoprecipitation (ChIP)
30×106 D458MED or DAOY cells were cross-linked with 1% formaldehyde for 10 min at 37°C and lysed in a buffer containing 1% SDS, 10mM EDTA and 50mM Tris pH 8.1. Sonicated chromatin was immunoprecipitated for 3h with 0.4μg of NRL antibody (AF2945, R&D systems) or with IgG as a negative control (sc-2028, Santa-Cruz). Immunoprecipitated chromatin was eluted in a buffer containing 1% SDS- 0.1M NaHCO3). The cross-links were reversed by the addition of NaCl (200mM final) for 4h at 65°C. DNA was extracted using phenol-chloroform. Real-time quantitative PCR was performed using SYBR Green realtime PCR Master Mix (Applied Biosystems) with specific primers in promoter or 3’UTR (negative control) of genes: Sense, 5′-TCCTGTAAGCGAGTCTGCTG-3′ and antisense, 5′-TGGTGAAACCCCGTCTCTAC-3′ for BCL-XL promoter (109 bp); Sense, 5′- CATCCCTACCCCCTAAGAGC-3′ and antisense, 5′-GCTTCTGGAGGACATTTGGA-3′ for BCL-XL 3’UTR (145 bp). Analysis of an input sample was used to normalize each sample (ΔCt (normalized CHIP)=(Ct(chip)-(Ctinput-log2(input dilution factor)), and then fold induction was measured by comparison of NRL antibody and IgG antibody precipitation.
Growth curves and soft agar colony formation assay
For growth curves, 105 DAOY and ONS-76 cells were seeded into 6-well plates in medium containing 0.2% FCS. D458MED cells were seeded into 12-well plates at a density of 5×10⁵ cells/ml in medium containing 10% FCS. 2.5×10⁴ HDMB03 cells were seeded into 96-well plates. Cultures were then stained with Trypan blue and the viable cells were counted at regular intervals. Cell viability assay based on luciferase activity was done using Cell titer Glo kit (Promega). Soft agar colony formation assay was performed at a density of 7.5 ×10⁴ cells as previously described (Pouponnot et al., 2006; Rocques et al., 2007).
Migration and Invasion assays
For cell migration assays, 2×10⁴ DAOY were seeded in 6-well plates and followed during 12h. Cell motility was analyzed by time-lapse videomicroscopy using an inverted microscope, equipped with a small transparent environmental chamber, at 37˚C in a humidified atmosphere containing 5% (v/v) CO2. The microscope was driven by the Metamorph software (Roper Scientific) and images were recorded with a charge-coupled device camera CoolsnapHQ. Cell speed (μm/min) was quantified by tracking cells with Image J software. For cell invasion assay, 104 DAOY cells were seeded on 8μm pore-transwell inserts coated with a uniform layer of growth factor reduced matrigel (BD bioscience) and cultured in 0.2% FCS-medium. In the bottom chamber, medium containing 10% FCS was used as a chemo attractant. After 16h of incubation, the cells that migrated through the membranes were fixed and stained in a 20% ethanol/crystal violet solution. The number of cells was counted for the entire well (photo x4), using ImageJ software.
Magnetic resonance imaging (MRI)
MRI experiments were performed on a small animal MRI system (Agilent), equipped with a 9.4T vertical magnet, a 500mT/m shielded micro-imaging gradient system, and a 40 mm inner diameter Millipede linear radiofrequency probe. Animals were anesthetized with isoflurane (AErrane, Baxter France, France), 4% for induction and 1–2% for maintenance in a mixture of N2 (80 vol %) and O2 (20 vol %). Body temperature was stabilized and respiration rate was monitored. A multi-slice (19 slices) multi echo sequence was used: TR/TE = 1000/10ms, FOV=30×30 mm2, matrix = 256 × 128, slice thickness = 1 mm. Images shown in Figure 2E were acquired about 22min after IP injection of Gd-DOTA (Dotarem, Guerbet, France): 100μl, 100mM.
DATA AND SOFTWARE AVAILABILITY
Code availability:
Python and R scripts used in this study can be obtained at https://www.charleslinlab.org/garancher_2018
Microarray data:
The microarray data has been deposited at the Geowebsite (https://www.ncbi.nlm.nih.gov/geo/) under the number GSE103902.
QUANTIFICATION AND STATISTICAL ANALYSIS
Statistical analysis
Statistical details can be found in the figure and figure legends. For the survival curves (Kaplan Meier analyses) the p-values have been calculated by using a log-rank (Mantel-cox) analysis. A p-value ≤0.05 is considered as significant.
Supplementary Material
TABLE S1: NRL/CRX cotargets GROUP3 SE genes (Related to Figure 1)
TABLE S2: NON NRL/CRX coTARGET GROUP 3 SE GENES (Related to Figure 1)
TABLE S3: Pathway enrichment following NRL knock-down in D458Med cells -DAVID ANALYSIS- (Related to Figure 5)
TABLE S4: List of photoreceptor genes (Related to Figure 5)
TABLE S5: List of Group 3 enriched genes (Related to Figure 5)
TABLE S6: List of NRL correlated genes in MB samples (Related to Figure 5)
SIGNIFICANCE:
Medulloblastoma (MB) is a malignant childhood brain tumor comprised of four biologically distinct molecular subgroups. Patients with Group 3 MB often fail conventional therapy and have an inferior prognosis. More than half of all Group 3 tumors express a photoreceptor-specific differentiation program of unknown biological significance. Here, we show that NRL and CRX, two photoreceptor-specific transcription factors, shape the Group 3 MB transcriptome and function as master regulators of this differentiation program. Our studies revealed notable molecular heterogeneity within Group 3 defined by NRL and CRX transcriptional activity, establishing the photoreceptor program as a Group 3 MB-specific dependency, and providing rationale for targeting this lineage as a potential therapeutic option for clinically aggressive Group 3 MB patients.
ACKNOWLEDGEMENTS
We thank members of our laboratory for helpful advice and comments, I. Dusanter and D. Duménil for transfer of the lentiviral technology, C. Lasgi for her assistance in FACS analyses, C. Alberti and E. Belloir at the Institut Curie mouse facilities and the genomic platform of Institut Curie. We also thank Drs. H. Dolznic, D. Bigner and T. Milde for providing us with materials and C. Lee for critical reading of the manuscript. This work was funded by grants from Ligue Nationale Contre le Cancer (Essonne-Oise-Yvelines #M18759, #M16649 and Legs Chovet), Fondation de France (#2009006690). We also thank the following associations for their financial support: les Torocinellles, Au nom d’Andréa, ADAM-Cancer (Association D’enfants Atteints de Médulloblastome), Franck Un rayon de soleil, Marabout de Ficelles and Abigaël. A.G. and M.M. were supported by a fellowship from the Ministère Français de l’Enseignement Supérieur et de la Recherche. C.Y.L. is supported by the Cancer Prevention Research Institute of Texas (RR150093), the NIH and NCI (1R01CA215452–01), and is a Pew-Stewart Scholar for Cancer Research (Alexander and Margaret Stewart Trust) P.A.N. is the recipient of a V Foundation V Scholar Award, Sontag Foundation Distinguished Scientist Award, and is a Pew-Stewart Scholar for Cancer Research (Alexander and Margaret Stewart Trust). P.A.N. acknowledges additional funding support from the American Association for Cancer Research (NextGen Grant for Transformative Cancer Research), American Lebanese Syrian Associated Charities (ALSAC) and St Jude Children’s Research Hospital.
Footnotes
DECLARATION OF INTERESTS
C.Y.L. is a shareholder and inventor of IP licensed to Syros Pharmaceuticals.
REFERENCES
- Adamson DC, Shi Q, Wortham M, Northcott PA, Di C, Duncan CG, Li J, McLendon RE, Bigner DD, Taylor MD, et al. (2010). OTX2 is critical for the maintenance and progression of Shh-independent medulloblastomas. Cancer Res 70, 181–191. [DOI] [PMC free article] [PubMed] [Google Scholar]
- Boon K, Eberhart CG, and Riggins GJ (2005). Genomic amplification of orthodenticle homologue 2 in medulloblastomas. Cancer Res 65, 703–707. [PubMed] [Google Scholar]
- Bunt J, Hasselt NE, Zwijnenburg DA, Hamdi M, Koster J, Versteeg R, and Kool M (2012). OTX2 directly activates cell cycle genes and inhibits differentiation in medulloblastoma cells. Int. J. Cancer 131, E21–32. [DOI] [PubMed] [Google Scholar]
- Cavalli FMG, Remke M, Rampasek L, Peacock J, Shih DJH, Luu B, Garzia L, Torchia J, Nor C, Morrissy AS, et al. (2017). Intertumoral Heterogeneity within Medulloblastoma Subgroups. Cancer Cell 31, 737–754. e6. [DOI] [PMC free article] [PubMed] [Google Scholar]
- Cho YJ, Tsherniak A, Tamayo P, Santagata S, Ligon A, Greulich H, Berhoukim R, Amani V, Goumnerova L, Eberhart CG, et al. (2010). Integrative Genomic Analysis of Medulloblastoma Identifies a Molecular Subgroup That Drives Poor Clinical Outcome. J Clin Oncol. [DOI] [PMC free article] [PubMed] [Google Scholar]
- Crowther AJ, Gama V, Bevilacqua A, Chang SX, Yuan H, Deshmukh M, and Gershon TR (2013). Tonic activation of Bax primes neural progenitors for rapid apoptosis through a mechanism preserved in medulloblastoma. J. Neurosci. Off. J. Soc. Neurosci 33, 18098–18108. [DOI] [PMC free article] [PubMed] [Google Scholar]
- Dai M, Wang P, Boyd AD, Kostov G, Athey B, Jones EG, Bunney WE, Myers RM, Speed TP, Akil H, et al. (2005). Evolving gene/transcript definitions significantly alter the interpretation of GeneChip data. Nucleic Acids Res 33, e175. [DOI] [PMC free article] [PubMed] [Google Scholar]
- Dolznig H, Habermann B, Stangl K, Deiner EM, Moriggl R, Beug H, and Müllner EW (2002). Apoptosis protection by the Epo target Bcl-X(L) allows factor-independent differentiation of primary erythroblasts. Curr. Biol. CB 12, 1076–1085. [DOI] [PubMed] [Google Scholar]
- Duy C, Hurtz C, Shojaee S, Cerchietti L, Geng H, Swaminathan S, Klemm L, Kweon S, Nahar R, Braig M, et al. (2011). BCL6 enables Ph+ acute lymphoblastic leukaemia cells to survive BCR-ABL1 kinase inhibition. Nature 473, 384–388. [DOI] [PMC free article] [PubMed] [Google Scholar]
- Eychene A, Rocques N, and Pouponnot C (2008). A new MAFia in cancer. Nat Rev Cancer 8, 683–693. [DOI] [PubMed] [Google Scholar]
- Fattet S, Haberler C, Legoix P, Varlet P, Lellouch-Tubiana A, Lair S, Manie E, Raquin MA, Bours D, Carpentier S, et al. (2009). Beta-catenin status in paediatric medulloblastomas: correlation of immunohistochemical expression with mutational status, genetic profiles, and clinical characteristics. J Pathol 218, 86–94. [DOI] [PubMed] [Google Scholar]
- Geisler S, Schöpf CL, and Obermair GJ (2015). Emerging evidence for specific neuronal functions of auxiliary calcium channel α₂δ subunits. Gen. Physiol. Biophys 34, 105–118. [DOI] [PMC free article] [PubMed] [Google Scholar]
- Hao H, Kim DS, Klocke B, Johnson KR, Cui K, Gotoh N, Zang C, Gregorski J, Gieser L, Peng W, et al. (2012). Transcriptional regulation of rod photoreceptor homeostasis revealed by in vivo NRL targetome analysis. PLoS Genet. 8, e1002649. [DOI] [PMC free article] [PubMed] [Google Scholar]
- He XM, Wikstrand CJ, Friedman HS, Bigner SH, Pleasure S, Trojanowski JQ, and Bigner DD (1991). Differentiation characteristics of newly established medulloblastoma cell lines (D384 Med, D425 Med, and D458 Med) and their transplantable xenografts. Lab Invest 64, 833–843. [PubMed] [Google Scholar]
- Hovestadt V, Jones DTW, Picelli S, Wang W, Kool M, Northcott PA, Sultan M, Stachurski K, Ryzhova M, Warnatz H-J, et al. (2014). Decoding the regulatory landscape of medulloblastoma using DNA methylation sequencing. Nature 510, 537–541. [DOI] [PubMed] [Google Scholar]
- Hsiau TH-C, Diaconu C, Myers CA, Lee J, Cepko CL, and Corbo JC (2007). The cis-regulatory logic of the mammalian photoreceptor transcriptional network. PloS One 2, e643. [DOI] [PMC free article] [PubMed] [Google Scholar]
- Hurt EM, Wiestner A, Rosenwald A, Shaffer AL, Campo E, Grogan T, Bergsagel PL, Kuehl WM, and Staudt LM (2004). Overexpression of c-maf is a frequent oncogenic event in multiple myeloma that promotes proliferation and pathological interactions with bone marrow stroma. Cancer Cell 5, 191–199. [DOI] [PubMed] [Google Scholar]
- Juin P, Geneste O, Gautier F, Depil S, and Campone M (2013). Decoding and unlocking the BCL-2 dependency of cancer cells. Nat. Rev. Cancer 13, 455–465. [DOI] [PubMed] [Google Scholar]
- Kataoka K (2007). Multiple mechanisms and functions of maf transcription factors in the regulation of tissue-specific genes. J Biochem Tokyo 141, 775–781. [DOI] [PubMed] [Google Scholar]
- Kool M, Koster J, Bunt J, Hasselt NE, Lakeman A, van Sluis P, Troost D, Meeteren NS, Caron HN, Cloos J, et al. (2008). Integrated genomics identifies five medulloblastoma subtypes with distinct genetic profiles, pathway signatures and clinicopathological features. PLoS ONE 3, e3088. [DOI] [PMC free article] [PubMed] [Google Scholar]
- Lecoin L, Rocques N, El-Yakoubi W, Ben Achour S, Larcher M, Pouponnot C, and Eychene A (2010). MafA transcription factor identifies the early ret-expressing sensory neurons. Dev Neurobiol 70, 485–497. [DOI] [PubMed] [Google Scholar]
- Lin CY, Erkek S, Tong Y, Yin L, Federation AJ, Zapatka M, Haldipur P, Kawauchi D, Risch T, Warnatz H-J, et al. (2016). Active medulloblastoma enhancers reveal subgroup-specific cellular origins. Nature 530, 57–62. [DOI] [PMC free article] [PubMed] [Google Scholar]
- McEvoy J, Flores-Otero J, Zhang J, Nemeth K, Brennan R, Bradley C, Krafcik F, Rodriguez-Galindo C, Wilson M, Xiong S, et al. (2011). Coexpression of normally incompatible developmental pathways in retinoblastoma genesis. Cancer Cell 20, 260–275. [DOI] [PMC free article] [PubMed] [Google Scholar]
- Mears AJ, Kondo M, Swain PK, Takada Y, Bush RA, Saunders TL, Sieving PA, and Swaroop A (2001). Nrl is required for rod photoreceptor development. Nat Genet 29, 447–452. [DOI] [PubMed] [Google Scholar]
- Milde T, Lodrini M, Savelyeva L, Korshunov A, Kool M, Brueckner LM, Antunes ASLM, Oehme I, Pekrun A, Pfister SM, et al. (2012). HD-MB03 is a novel Group 3 medulloblastoma model demonstrating sensitivity to histone deacetylase inhibitor treatment. J. Neurooncol 110, 335–348. [DOI] [PubMed] [Google Scholar]
- Mitton KP, Swain PK, Chen S, Xu S, Zack DJ, and Swaroop A (2000). The leucine zipper of NRL interacts with the CRX homeodomain. A possible mechanism of transcriptional synergy in rhodopsin regulation. J. Biol. Chem 275, 29794–29799. [DOI] [PubMed] [Google Scholar]
- Miyoshi K, Katayama T, Imaizumi K, Taniguchi M, Mori Y, Hitomi J, Yui D, Manabe T, Gomi F, Yoneda T, et al. (2000). Characterization of mouse Ire1 alpha: cloning, mRNA localization in the brain and functional analysis in a neural cell line. Brain Res. Mol. Brain Res 85, 68–76. [DOI] [PubMed] [Google Scholar]
- Montana CL, Lawrence KA, Williams NL, Tran NM, Peng G-H, Chen S, and Corbo JC (2011). Transcriptional regulation of neural retina leucine zipper (Nrl), a photoreceptor cell fate determinant. J. Biol. Chem 286, 36921–36931. [DOI] [PMC free article] [PubMed] [Google Scholar]
- Nishizawa M, Kataoka K, and Vogt PK (2003). MafA has strong cell transforming ability but is a weak transactivator. Oncogene 22, 7882–7890. [DOI] [PubMed] [Google Scholar]
- Northcott PA, Korshunov A, Witt H, Hielscher T, Eberhart CG, Mack S, Bouffet E, Clifford SC, Hawkins CE, French P, et al. (2011). Medulloblastoma comprises four distinct molecular variants. J. Clin. Oncol. Off. J. Am. Soc. Clin. Oncol 29, 1408–1414. [DOI] [PMC free article] [PubMed] [Google Scholar]
- Northcott PA, Jones DT, Kool M, Robinson GW, Gilbertson RJ, Cho YJ, Pomeroy SL, Korshunov A, Lichter P, Taylor MD, et al. (2012a). Medulloblastomics: the end of the beginning. Nat Rev Cancer 12, 818–834. [DOI] [PMC free article] [PubMed] [Google Scholar]
- Northcott PA, Shih DJ, Peacock J, Garzia L, Morrissy AS, Zichner T, Stutz AM, Korshunov A, Reimand J, Schumacher SE, et al. (2012b). Subgroup-specific structural variation across 1,000 medulloblastoma genomes. Nature 488, 49–56. [DOI] [PMC free article] [PubMed] [Google Scholar]
- Northcott PA, Lee C, Zichner T, Stütz AM, Erkek S, Kawauchi D, Shih DJH, Hovestadt V, Zapatka M, Sturm D, et al. (2014). Enhancer hijacking activates GFI1 family oncogenes in medulloblastoma. Nature 511, 428–434. [DOI] [PMC free article] [PubMed] [Google Scholar]
- Northcott PA, Buchhalter I, Morrissy AS, Hovestadt V, Weischenfeldt J, Ehrenberger T, Gröbner S, Segura-Wang M, Zichner T, Rudneva VA, et al. (2017). The whole-genome landscape of medulloblastoma subtypes. Nature 547, 311–317. [DOI] [PMC free article] [PubMed] [Google Scholar]
- Pouponnot C, Sii-Felice K, Hmitou I, Rocques N, Lecoin L, Druillennec S, Felder-Schmittbuhl MP, and Eychene A (2006). Cell context reveals a dual role for Maf in oncogenesis. Oncogene 25, 1299–1310. [DOI] [PubMed] [Google Scholar]
- Ramaswamy V, and Taylor MD (2017). Medulloblastoma: From Myth to Molecular. J. Clin. Oncol. Off. J. Am. Soc. Clin. Oncol 35, 2355–2363. [DOI] [PubMed] [Google Scholar]
- Riddle RD, Johnson RL, Laufer E, and Tabin C (1993). Sonic hedgehog mediates the polarizing activity of the ZPA. Cell 75, 1401–1416. [DOI] [PubMed] [Google Scholar]
- Rocques N, Abou Zeid N, Sii-Felice K, Lecoin L, Felder-Schmittbuhl MP, Eychene A, and Pouponnot C (2007). GSK-3-Mediated Phosphorylation Enhances Maf-Transforming Activity. Mol Cell 28, 584–597. [DOI] [PubMed] [Google Scholar]
- Roussel MF, and Robinson GW (2013). Role of MYC in Medulloblastoma. Cold Spring Harb Perspect Med 3. [DOI] [PMC free article] [PubMed] [Google Scholar]
- Schwalbe EC, Lindsey JC, Nakjang S, Crosier S, Smith AJ, Hicks D, Rafiee G, Hill RM, Iliasova A, Stone T, et al. (2017). Novel molecular subgroups for clinical classification and outcome prediction in childhood medulloblastoma: a cohort study. Lancet Oncol. 18, 958–971. [DOI] [PMC free article] [PubMed] [Google Scholar]
- Swaroop A, Kim D, and Forrest D (2010). Transcriptional regulation of photoreceptor development and homeostasis in the mammalian retina. Nat Rev Neurosci 11, 563–576. [DOI] [PMC free article] [PubMed] [Google Scholar]
- Taylor MD, Northcott PA, Korshunov A, Remke M, Cho YJ, Clifford SC, Eberhart CG, Parsons DW, Rutkowski S, Gajjar A, et al. (2011). Molecular subgroups of medulloblastoma: the current consensus. Acta Neuropathol. [DOI] [PMC free article] [PubMed] [Google Scholar]
- Thompson MC, Fuller C, Hogg TL, Dalton J, Finkelstein D, Lau CC, Chintagumpala M, Adesina A, Ashley DM, Kellie SJ, et al. (2006). Genomics identifies medulloblastoma subgroups that are enriched for specific genetic alterations. J Clin Oncol 24, 1924–1931. [DOI] [PubMed] [Google Scholar]
- White MA, Kwasnieski JC, Myers CA, Shen SQ, Corbo JC, and Cohen BA (2016). A Simple Grammar Defines Activating and Repressing cis-Regulatory Elements in Photoreceptors. Cell Rep. 17, 1247–1254. [DOI] [PMC free article] [PubMed] [Google Scholar]
- Yoshida S, Mears AJ, Friedman JS, Carter T, He S, Oh E, Jing Y, Farjo R, Fleury G, Barlow C, et al. (2004). Expression profiling of the developing and mature Nrl−/− mouse retina: identification of retinal disease candidates and transcriptional regulatory targets of Nrl. Hum. Mol. Genet 13, 1487–1503. [DOI] [PubMed] [Google Scholar]
Associated Data
This section collects any data citations, data availability statements, or supplementary materials included in this article.
Supplementary Materials
TABLE S1: NRL/CRX cotargets GROUP3 SE genes (Related to Figure 1)
TABLE S2: NON NRL/CRX coTARGET GROUP 3 SE GENES (Related to Figure 1)
TABLE S3: Pathway enrichment following NRL knock-down in D458Med cells -DAVID ANALYSIS- (Related to Figure 5)
TABLE S4: List of photoreceptor genes (Related to Figure 5)
TABLE S5: List of Group 3 enriched genes (Related to Figure 5)
TABLE S6: List of NRL correlated genes in MB samples (Related to Figure 5)
Data Availability Statement
Code availability:
Python and R scripts used in this study can be obtained at https://www.charleslinlab.org/garancher_2018
Microarray data:
The microarray data has been deposited at the Geowebsite (https://www.ncbi.nlm.nih.gov/geo/) under the number GSE103902.