MEDICAL SCIENCES Correction for “KDM4B protects against obesity and metabolic dysfunction,” by Yingduan Cheng, Quan Yuan, Laurent Vergnes, Xin Rong, Ji Youn Youn, Jiong Li, Yongxin Yu, Wei Liu, Hua Cai, Jiandie D. Lin, Peter Tontonoz, Christine Hong, Karen Reue, and Cun-Yu Wang, which was first published May 29, 2018; 10.1073/pnas.1721814115 (Proc Natl Acad Sci USA 115:E5566–E5575).
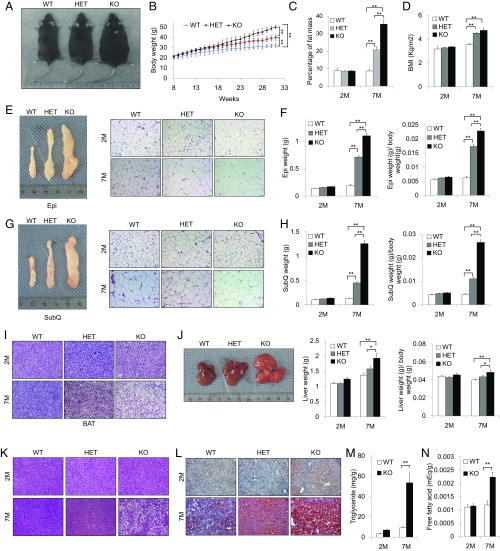
The authors note that, in Fig. 1G, the image for s.c. fat of 2M KO mouse appeared incorrectly. The authors inadvertently used an image of epidermal fat from the same mouse. The corrected Fig. 1 and its legend appear below.
Fig. 1.
Kdm4b KO mice exhibit obesity phenotypes on normal chow diet. (A) Representative images of male 7-mo-old WT, HET, and KO mice. (B) Growth curve of WT, HET, and KO littermates (n = 8). (C) Determination of percentage of fat mass of WT, HET, and KO mice using NMR imaging at 2 mo and 7 mo (n = 8). (D) Determination of BMI of WT, HET and KO mice starting at 28 d for 2-mo-old and 7-mo-old mice (n = 8). (E) Representative images of Epi WAT from WT, HET, and KO mice at 7 mo and H&E staining of Epi from WT, HET, and KO mice. (Scale bars, 50 µm.) (F) Determination of Epi weights from WT, HET, and KO mice at 2 and 7 mo (n = 8). (G) Representative images of SubQ WAT from WT, HET, and KO mice at 7 mo and H&E staining of SubQ from WT, HET, and KO mice at 2 and 7 mo. (Scale bars, 50 µm.) (H) Determination of SubQ from WT, HET, and KO mice at 2 and 7 mo (n = 8). (I) H&E staining of BAT for WT, HET, and KO mice at 2 and 7 mo. (Scale bars, 50 µm.) (J) Representative images of livers of WT, HET, and KO mice at 7 mo, and determination of liver weights (n = 8). (K) H&E staining of livers for WT, HET, and KO mice at 2 and 7 mo. (Scale bars, 50 µm.) (L) Oil Red O staining of livers for WT, HET, and KO mice at 2 and 7 mo. (Scale bars, 50 µm.) (M and N) Determination of percentage triglyceride (M) and free fatty acids (N) in liver tissues of WT and KO mice (n = 6). *P < 0.05; **P < 0.01. All data are presented as the mean ± SEM.


