Significance
Not all nutrient molecules act as attractant signals, and not all attractants are good nutrients. Here, we study behaviors of bacterial cells in an environment with competing sources: One has a strong attractant but a poor nutrient, and the other has a rich nutrient but a weak attractant. We find that, although initially cells are attracted toward the strong attractant, the opposing nutrient gradient generated by consumption eventually becomes dominant when the cell density reaches a critical value. The cells then form a band escaping the strong attractant but weak nutrient “trap” and migrating toward the rich nutrient. Our study shows that combination of growth and chemotaxis allows cells to find nutrient source in complex environments with conflicting sensory cues.
Keywords: chemotaxis, growth, opposing gradients, traveling wave
Abstract
It is commonly believed that bacterial chemotaxis helps cells find food. However, not all attractants are nutrients, and not all nutrients are strong attractants. Here, by using microfluidic experiments, we studied Escherichia coli chemotaxis behavior in the presence of a strong chemoattractant (e.g., aspartate or methylaspartate) gradient and an opposing gradient of diluted tryptone broth (TB) growth medium. Our experiments showed that cells initially accumulate near the strong attractant source. However, after the peak cell density () reaches a critical value , the cells form a “escape band” (EB) that moves toward the chemotactically weaker but metabolically richer nutrient source. By using various mutant strains and varying experimental conditions, we showed that the competition between Tap and Tar receptors is the key molecular mechanism underlying the formation of the escape band. A mathematical model combining chemotaxis signaling and cell growth was developed to explain the experiments quantitatively. The model also predicted that the width and the peak position of EB satisfy two scaling relations: and , where is the channel length. Both scaling relations were verified by experiments. Our study shows that the combination of nutrient consumption, population growth, and chemotaxis with multiple receptors allows cells to search for optimal growth condition in complex environments with conflicting sources.
Chemotactic bacteria are capable of sensing and migrating toward favorable locations for survival and growth in complex environments. As one of the most studied model systems in biology, Escherichia coli chemotaxis is relatively well understood (1–5). E. coli can sense different external chemical signals by using five different types of chemoreceptors: two abundant receptors (Tar and Tsr) and three minor receptors (Trg, Tap, and Aer). These receptors can bind to different ligands either directly or indirectly through periplasmic binding proteins (6). Binding of a ligand molecule triggers conformational changes of receptors and affects the autophosphorylation activity of the histidine kinase CheA that forms the core signaling complex with the receptors and the adapter protein CheW. The signal is then transmitted to the flagellar motor by a response regulator CheY to control the flagellar motor’s tumbling frequency.
While the molecular mechanism of bacterial chemotaxis has been investigated extensively, the relationship between chemotaxis and metabolism remains unclear. Early pioneering work by Adler and colleagues (7, 8) showed that not all nutrient molecules (amino acids and sugars) are attractants and not all attractants are good nutrients. In the classical swarm plate experiments (9, 10), the attractant gradient and the nutrient gradient are in the same direction. Thus, by following the attractant gradient, cells in the swarm rings migrate to locations with higher nutrient concentrations. However, in a more complex environment, these two gradients may not be in the same direction. For example, there can be two (or more) spatially separated sources: One source has a high concentration of a strong attractant, which may be only weakly or not consumable; the other has a high concentration of nutrient, which contains only weak attractants. Between the two sources, the attractant gradient is opposite to that of the nutrient. In complex environments, either geometrically (11–13) or chemically with multiple conflicting cues, the questions on whether and how chemotaxis guides cells toward locations with favorable conditions remain unanswered.
To address some of the questions raised above, we study bacterial chemotaxis behaviors in an attractant gradient and an opposing nutrient field that changes with time due to consumption, by combining microfluidic experiments and quantitative modeling. We show that the interplay among bacterial chemotaxis in opposing gradients, nutrient consumption, and cell growth leads to traveling shape-preserving cell density bands. These traveling bands allow cells to escape from traps near strong attractant but poor nutrient sources.
Results
The Traveling Escape Band in Opposing Gradients.
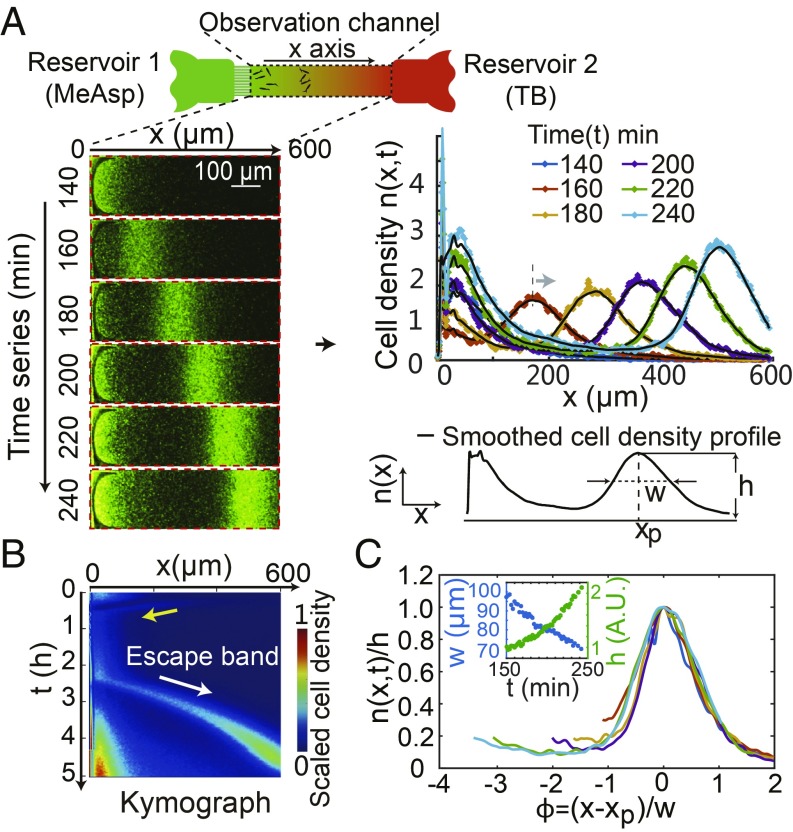
We study bacterial population dynamics in opposing attractant and nutrient gradients in a microfluidic channel. As shown in Fig. 1A, a linear attractant gradient is set up by maintaining a constant attractant concentration in reservoir 1 at one end of the channel (14, 15). For simplicity, we used MeAsp, a nonmetabolizable attractant, to maintain a fixed attractant gradient. Cells and then diluted tryptone broth (TB) growth medium were added in reservoir 2 in sequence. Once TB was added at time , it formed an opposing gradient to that of MeAsp by diffusion at min. See SI Appendix, SI Materials and Methods and Fig. S1 for details of the experiments.
Fig. 1.
The traveling escape band in a microfluidic channel with opposing gradients. (A) Schematic diagram of the microfluidic device (15). Reservoir 1 (green) contains 2 mM MeAsp. Reservoir 2 (red) contains TB and bacteria. (A, Left) Images of cell density in the channel at different times show the formation of the escape band traveling toward reservoir 2. (A, Right) The cell-density profiles along the length of the channel (x axis) at different times. The cell-density profile is characterized by its peak , width , and peak location . (B) The kymograph showing the spatiotemporal dynamics of the cell-density profile. The initial wave approaching reservoir 1 and the escape band formed later are highlighted by the yellow and white arrows, respectively. (C) The rescaled escape-band profiles at different times collapse onto a single curve. C, Inset shows the dependence of peak width and the height on time (t).
The cell density is determined by measuring the fluorescence intensity of the GFP-labeled cells in the observation window of the channel. Fig. 1 A, Left shows a series of cell-density images at different times. Initially, E. coli cells, attracted by MeAsp, move across the channel to accumulate near reservoir 1, where the cell population grows as a small amount of nutrient (TB) reaches them through diffusion from reservoir 2. However, after the bacteria population grows to a critical density , a subpopulation of cells form an “escape” band, which moves away from the strong attractant (MeAsp) source toward the nutrient (TB) source at reservoir 2. By integrating the cell density across the channel, the cell-density profiles along the channel (x axis), , can be determined quantitatively from the images at time . As shown in Fig. 1 A, Right, there is clearly an escape band moving to the right (see Movie S1 for details). The location and structure of the escape band can be characterized by the peak location , the peak density , and the width of the band defined as the half-maximum width of the profile.
The spatial cell-density profiles at different time can be put together in a “kymograph” as shown in Fig. 1B. The kymograph characterizes the spatiotemporal dynamics of the cell population, from which the escape band can be easily identified (highlighted by a white arrow). See Movie S1 for a video of the full escape-band dynamics and the construction of its corresponding kymograph.
From our experimental data (Fig. 1 A and B), we found that the density profile is shape-preserving. When we scale the cell density by and introduce a scaled distance parameter , all of the escape band profiles at different times collapse onto a single curve, as shown in Fig. 1C. This is remarkable given that both the width and the height of the escape band change with time (Fig. 1 C, Inset).
The Onset of Escape Band Depends on the Initial Cell Density and the Nutrient Concentration.
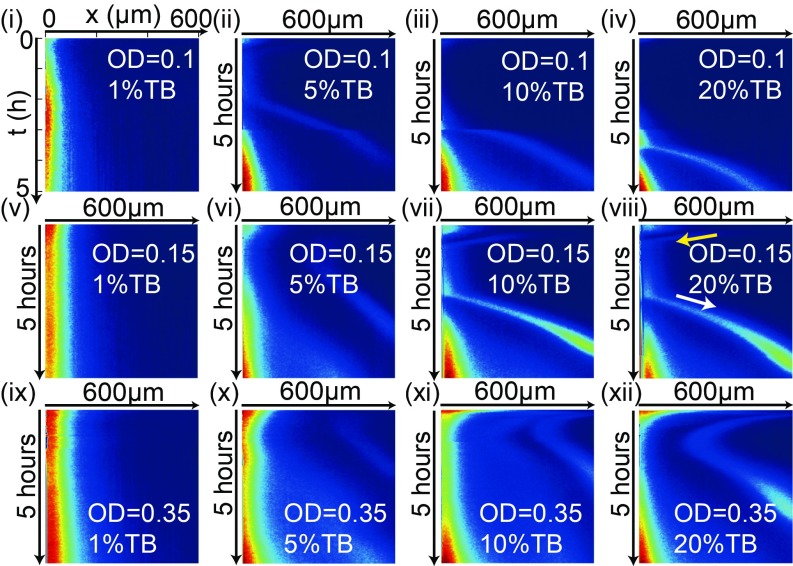
What determines the onset of the escape band? In Fig. 2, the observed spatiotemporal profiles of cell density are shown for different initial cell densities characterized by their optical density (OD) and for different TB concentrations in reservoir 2. For a small TB concentration (1), there is no escape band during our experiments (5 h) as shown in Fig. 2i. For larger TB concentrations (), an escape band emerges. For a smaller initial bacteria density (, Fig. 2 ii–iv), it takes longer to form the escape band than for a larger initial density, e.g., when as shown in Fig. 2 x–xii). These observations suggest the existence of a threshold cell density for the formation of the traveling escape band. As indicated by the yellow arrow in Fig. 2viii, a band is visible during the initial TB gradient establishment process, and it drifts toward reservoir 1 in the same direction as TB diffusion for . After reaching reservoir 1 and growing there for some time, the escape band emerges and moves in the opposite direction toward reservoir 2 when the cell density reaches a critical value. The onset time for the escape band depends on the initial cell density and the TB concentration in reservoir 2. However, the existence of the escape band is robust, independent of where cells were loaded (SI Appendix, Fig. S2 for the case when cells were put in the middle of the channel) and attractant used (see SI Appendix, Fig. S3 for Asp).
Fig. 2.
The kymographs of RP437 for different initial loading densities given by their OD and different TB concentrations. Each column has a fixed TB concentration . Each row has a fixed OD: 0.1, 0.15, and 0.35. viii is the same as shown in Fig. 1B.
Sensing of dipeptide in TB by Tap is crucial for the escape band.
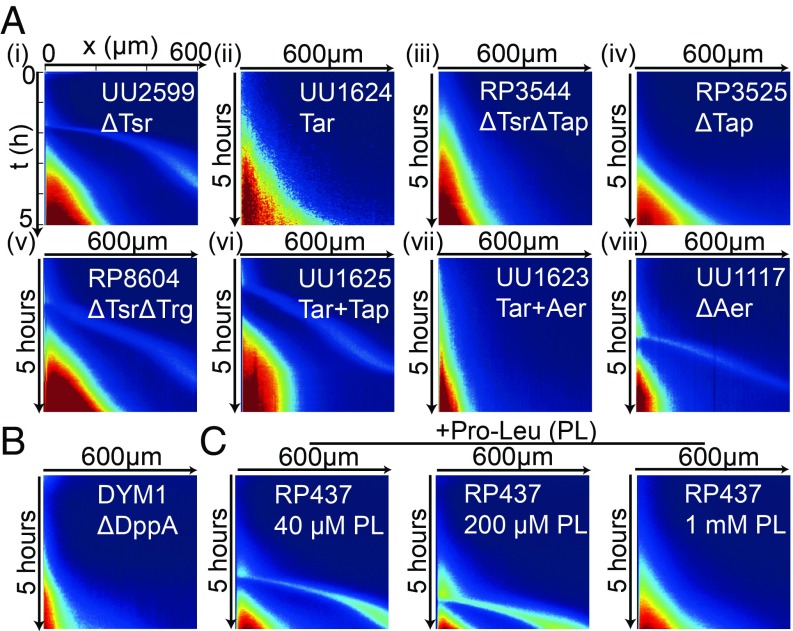
Which chemoreceptors are responsible for this complex behavior? In TB, aspartate and serine are the main known consumable attractants contributing to the formation of swarm rings observed in TB agar plate (9). Surprisingly, as shown in Fig. 3 A, i, the escape band still exists in the Tsr receptor mutant strain UU2599 (). As a control, we verified that the Tar-only strain UU1624 () did not form the escape band as shown in Fig. 3 A, ii. This indicates that the underlying mechanism for the observed escape band is the competition between Tar, which is responsible for sensing MeAsp and one of the minor receptors, Trg, Tap, or Aer.
Fig. 3.
Spatiotemporal cell density profile (kymograph) for mutants and WT under different nutrient conditions. (A) Kymograph for different mutant strains. (A, i) . (A, ii) ( only). (A, iii) . (A, iv) . (A, v) . (A, vi) . (A, vii) . (A, viii) . (B) Kymograph for strain DYM1 () shows no escape band. (C) Kymograph for WT () with different dipeptide Pro-Leu concentrations added to TB. The escape band is absent for Pro-Leu.
To determine which minor receptor is responsible for the escape band, we carried out a series of experiments with different E. coli mutants. Our experiments showed that the strains RP3544 () and RP3525 () did not form an escape band (Fig. 3 A, iii and iv), but the strain RP8604 () did form an escape band as shown in Fig. 3 A, v. Therefore, the competing receptor that senses certain attractant in TB is most likely Tap. We verified this hypothesis by using a strain UU1625 with only Tar and Tap, which showed a clear escape band (Fig. 3 A, vi). Finally, we excluded the involvement of the oxygen-sensing receptor Aer by using the strain UU1623 with Tar and Aer, which did not show a band (Fig. 3 A, vii), and the strain UU1117 (), which did form a band (Fig. 3 A, viii).
Our comprehensive mutant experiments identified Tap as the relevant chemosensor for the escape band. But what does Tap sense in TB? Tap is known to sense dipeptide through a dipeptide transport protein DppA (6, 16) and also pyrimidine (17). To find the responsible chemoeffector, we used the mutant strain DYM1 () derived from RP437 in our experiments. As shown in Fig. 3B, no escape band was observed with DYM1, which shows that sensing of dipeptide in TB by Tap is essential for the escape band. To further confirm the role of dipeptide, we repeated our experiments using the WT cells (RP437), but now with different amounts of dipeptide proline–leucine (Pro-Leu) added to TB. As shown in Fig. 3C, additional amount of Pro-Leu delayed the onset of the escape band. For the highest concentrations of added Pro-Leu, the traveling band did not form within our experiment time (). The reason is that for a higher initial Pro-Leu concentration, the consumption driven gradient will take longer to form and therefore the onset of the traveling band is delayed or absent (see SI Appendix, Fig. S4 for more details of the Pro-Leu dose response).
The Population Model Based on the Molecular Mechanism of the Chemotaxis Pathway.
To understand the mechanism for the escape-band formation, we studied the coupled spatiotemporal dynamics of the cell density and the nutrient concentration by incorporating the essential molecular mechanism of bacterial chemotaxis (2, 18, 19) into the phenomenological Keller–Segel (K-S) equation (20, 21):
| [1] |
| [2] |
where is the TB diffusion coefficient, is the active cell diffusion coefficient, is the chemotaxis coefficient, and is the MeAsp concentration.
As shown in our previous work (18, 19), when environment changes are slower than the intracellular adaption dynamics, chemotaxis motility is controlled by an effective chemotaxis potential , which is the free energy difference between active and inactive states of chemoreceptors due to ligand binding. Relevant molecular mechanisms are incorporated in . In particular, different types of chemoreceptors interact cooperatively within the mixed receptor cluster in bacteria (22–24), each contributing to additively (25). For the system studied here, there are two relevant contributions to , which come from bindings of MeAsp to Tar and certain metabolizable molecule (probably dipeptide) in TB to Tap:
| [3] |
where is the ratio between Tap and Tar receptors in the functional receptor cluster and and are the dissociation constants of MeAsp to the inactive (active) Tar receptor (26); , are the corresponding parameters for the TB-sensing Tap receptor. Given that Tap binds indirectly with ligands through binding proteins , , and are effective dissociation constants that depend on properties of BP (6). The growth rate takes the form that depends on nutrient concentration with a relatively slow maximum growth rate , a small threshold , and a modest Hill coefficient . The nutrient consumption rate is taken to be proportional to the growth rate .
Model Results Agree with Experiments Quantitatively.
We used the pathway based population model, Eqs. 1–3, to simulate the experimental system with the boundary conditions: , , and no flux for at . To mimic the cell-loading procedure in experiments, we set for 20 () with the initial cell density (OD) introduced in reservoir 2 and for . Most of the model parameters, which are given in SI Appendix, Table S1, are taken from previous studies.
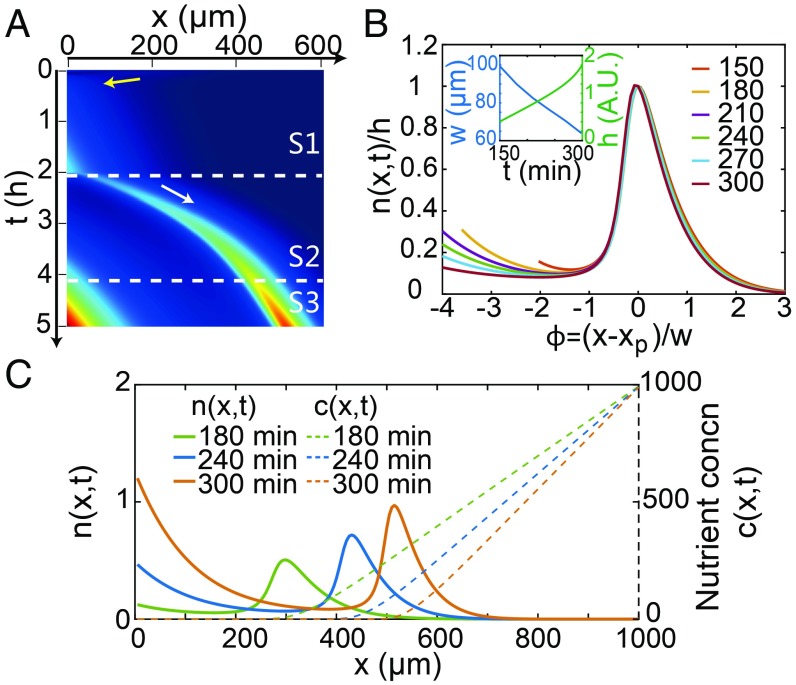
As shown in Fig. 4A, there are three phases (S1–S3) in the cell-distribution dynamics. Cells move toward the MeAsp side (yellow arrow) and grow there during the initial S1 phase, followed by the formation of an escape band (white arrow) traveling toward the nutrient side during the S2 phase. Subsequently, the cell density near the origin () also increases as some of the cells that grow in the escape band migrate back to the origin during the S3 phase. The simulation results shown in Fig. 4A are in quantitative agreement with the experimental data shown in Fig. 1B (see SI Appendix, Fig. S5 for the simulation-experiment comparison of the dynamics). Moreover, as shown in Fig. 4B, the normalized escape-band density profiles vs. the shifted and rescaled coordinate collapse onto a single curve in excellent agreement with the experimental observations shown in Fig. 1C. The dependence of the escape band on the initial cell density and the TB concentration shown in Fig. 2B are all reproduced in our simulations (SI Appendix, Fig. S6).
Fig. 4.
Simulation results from the modified K-S model based on chemotaxis signaling pathway dynamics (parameters given in SI Appendix, Table S1). (A) Kymograph shows the escape band (white arrow) and the initial wave (yellow arrow) in agreement with the experiments (Fig. 1A). (B) The collapsed cell-density profile after rescaling. The dynamics of and are shown in B, Inset. (C) The cell-density profiles (solid lines) and the corresponding nutrient profiles (dotted lines) at different times.
The model also allows us to study dynamics of the nutrient concentration , which cannot be directly measured easily. As shown in Fig. 4C, starting from its source at x = 1,000 m toward , the nutrient concentration decreases linearly until it vanishes near the peak position of the escape band and remains zero behind the escape band. The characteristics of the nutrient-concentration dynamics provide key insights for us to understand the mechanism for escape-band formation and its scaling properties as we describe below.
The Mechanism and Conditions for the Escape-Band Formation.
Given that cell growth is much slower than the cell motility time scale: , the cell-density profile can be obtained in our model by using the adiabatic approximation, i.e., by balancing the leading order motility terms in Eq. 1: which leads to the solution (19) with a normalization constant.
The compact traveling band structure in the S2 and S3 phases depends on the balance between the two attractant gradients, which results in a minimum of the effective chemotaxis potential at . From Eq. 3, we derived an equation to determine by requiring :
| [4] |
where is the time-independent MeAsp gradient and is the nutrient gradient in the opposite direction, which is time-dependent due to nutrient consumption. Expanding near to the second order, we can also obtain the width of the band .
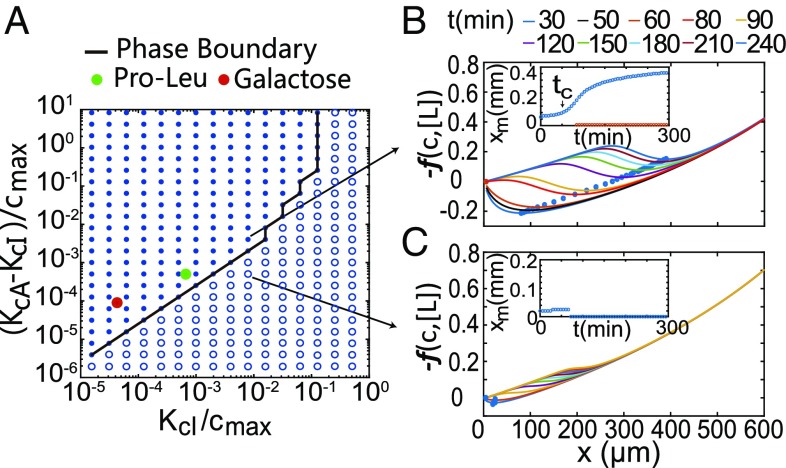
The mechanism for the band formation is evident from the balance equation, Eq. 4. The growth-driven consumption of nutrient () amplifies chemotaxis toward the nutrient by reducing and increasing . The strength of chemotaxis toward an attractant is characterized by the prefactor multiplying the gradient ( or ) in Eq. 4, which depends on the difference between the dissociation constants of the active and inactive forms of the corresponding receptor, i.e., for MeAsp and for the nutrient. The existence of the escape band requires a minimum chemotaxis strength toward the nutrient; otherwise, Eq. 4 would have no solution. We studied the conditions for the escape-band formation in the parameter space spanned by and by direct simulations of Eqs. 1 and 2. As shown in Fig. 5A, there is a clear phase boundary between parameter regimes with and without escape band. The dissociation constants for dipeptide (Pro–Leu) binding to Tap (filled green circle) belong to the escape-band regime, so does the galactose binding to Trg (filled red circle). Indeed, an escape band was also observed with RP3525 () cells by adding galactose to diluted TB as nutrient (SI Appendix, Fig. S7).
Fig. 5.
Conditions for the escape-band formation. (A) Phase diagram spanned by the dissociation constants and of the nutrient molecule. The filled (open) circles represent parameters when escape band can (cannot) form. The green dot represents the case of Pro-Leu binding to Tap (6). The red circle represents the case for galactose binding with Trg (6). (B) Spatial profiles of the effective potential at different times in the escape-band-forming regime. There exists an onset time beyond which a second minimum location of the chemotaxis potential (blue dots) emerges and starts to move to the right toward the nutrient side of the channel. B, Inset shows the dynamics of the minima of . (C) In the no-escape-band regime, the chemotaxis strength of the nutrient molecule is too weak to generate two minima in the chemotaxis potentials needed for a traveling escape band.
The mechanism of the escape band can be understood by studying dynamics of the effective chemotaxis potential . For parameters in the escape-band-forming regime with a relatively large difference , there exists an onset time beyond which a second minimum location in emerges besides the one near the origin. Once formed, this second minimum location is driven by nutrient consumption toward the nutrient-rich side of the channel, as shown in Fig. 5B and Fig. 5 B, Inset. However, for parameters in the no-escape-band regime with a relatively small difference , the chemotaxis potential only has one minimum near , and there is no escape band as shown in Fig. 5C and Fig. 5 C, Inset.
Scaling Properties of the Escape Band: Theory Predictions and Experimental Verification.
In our microfluidic experiments with a relatively short channel, the consumption of nutrient is much slower than the supply of nutrient by diffusion across the channel. Therefore, nutrient concentration field can be approximated by a piece-wise linear form at the leading order: , where is the inflection point slightly behind the peak of the band where (almost) all nutrients are consumed (SI Appendix, Fig. S8). By using the linear MeAsp profile and this piece-wise linear form of in the chemotaxis balance equation, Eq. 4, we obtain a relationship between and . Another relation among , , and is obtained by balancing the cell growth and the nutrient supply. Taken together, we have the following simple scaling relations among the three variables, , , and :
| [5] |
where is the critical cell density and is a system-specific constant. We note that the scaling relations are only quantitatively valid in the log-sensing regime, where , outside of which the relationships remain qualitatively true, but the exponents deviate from those given in Eq. 5. Dynamics of the peak cell density can be solved by integrating Eq. 1 over space (): , where the effective peak growth rate is , and is the onset time for the escape band. See SI Appendix for detailed derivation of the scaling relations and expressions for different constants.
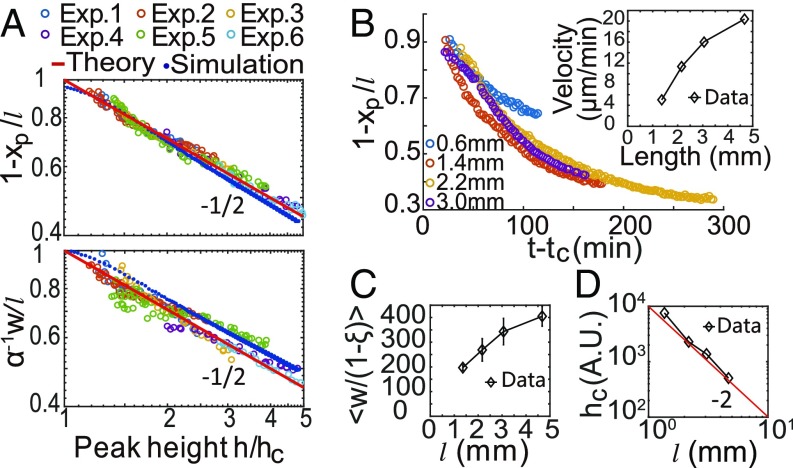
Next, we tested the scaling properties of the escape band predicted by Eq. 5. For six separate experiments with different initial cell densities (OD) and growth rates (), we measured the structures and dynamics of their escape bands (SI Appendix, Fig. S9A). Both vs. and vs. collapsed onto the same scaling form for all six experiments with an exponent as shown in Fig. 6A in agreement with Eq. 5.
Fig. 6.
Scaling behaviors of the traveling escape band. (A) In six experiments with different initial cell density (OD) and different growth rate, both and scale with as consistent with theory predictions. (B) In experiments with different channel length , the dependence of on time collapses for different . B, Inset shows that the average escape-band velocity increases with . (C) The width increases with , . (D) The critical cell density decreases with as consistent with prediction.
Besides the scaling relationships among , , and , our theory also predicts that in the slow growth (or short channel) limit when , both and scales with the channel length , and the critical cell density scales as . These predictions are tested by measuring dynamics of the escape band in channels with different lengths (SI Appendix, Fig. S9B). As shown in Fig. 6 B and C, the scaled peak position collapsed for different channel lengths and goes up roughly linearly with , consistent with Eq. 5. Finally, the measured shown in Fig. 6D decreases with as consistent with our scaling prediction (see SI Appendix for details).
Summary and Discussion
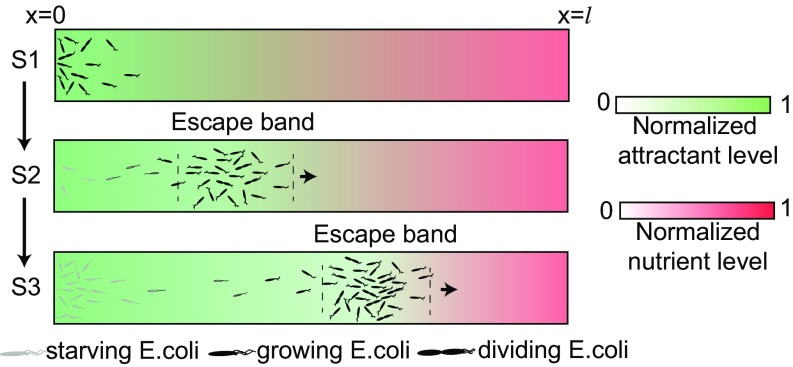
In this work, we studied E. coli chemotaxis behavior in an environment with two competing gradients: a strong but nonconsumable attractant at and a high concentration of nutrient at . We found three distinctive phases, as shown in Fig. 7. In the early phase (S1), cell density increases near due to chemotaxis-driven accumulation and the subsequent cell growth fueled by nutrient consumption. When the cell density near reaches a critical value , the supply of nutrient is no longer enough to sustain the population growth. This leads to the S2 phase when the escape band is formed and moves slowly toward the nutrient-rich side of the channel (). After the onset of the S2 phase, cell growth only occurs within the moving escape band. However, new cells originally born in the escape band can move back to the origin by crossing a “chemical” barrier (27) between and . As a result, cell population near the origin starts to increase again, which is defined as the S3 phase of the dynamics; see SI Appendix, Fig. S10 for details.
Fig. 7.
Illustration of the formation and dynamics of the escape band during the three phases (S1–S2–S3) of population behaviors in competing gradients: a strong attractant source at vs. a rich nutrient source at .
The mechanism for this rich set of spatiotemporal phenomena is due to the interplay between cell metabolism/growth and chemotaxis in competing gradients. The sharp (“soliton”-like) structure of the escape band, especially the trailing edge (Figs. 2B and 4B), is determined (shaped) by the two competing gradients. It is qualitatively different from the cell-density profile in the classic swarm-ring experiments, which has a wider width and a more diffused trailing tail (28, 29). The two opposing gradients also explain the much slower migrating speed of the escape band () in comparison with the band speed observed recently in systems with only one nutrient gradient ( in ref. 30 and 3–10 in ref. 29). The traveling escape band observed here is also different from E. coli chemotaxis behavior in two competing stationary chemoattractant gradients, e.g., MeAsp vs. serine gradients as studied in Kalinin et al. (31), where cells accumulate and stay near the source of one of the two attractants, depending on the chemoreceptor ratio (Tar:Tsr) in the cells. Here, cells first accumulate near the strong attractant source as in ref. 31. However, the continuous consumption of nutrient amplifies the chemotactic effect of the nutrient, and eventually an escape band is formed, which moves away from the strong attractant but poor nutrient source toward the rich nutrient source, despite the fact that it only serves as a weak attractant.
The escape band is a general phenomenon not limited by specific chemoattractants or receptors, and it should be physiologically relevant, as it enhances the fitness of the population by avoiding being trapped by nonmetabolizable or weakly metabolizable attractants, such as AI-2 in the biofilm (32, 33) and DHMA for commensal bacteria in the gut microbiota (34, 35). Indeed, our model showed that the overall population growth rate increases as the system changes from the no-band-forming regime to the band-forming regime (SI Appendix, Fig. S11). Besides growth, another condition for the escape band is the cell’s ability to sense some components of the nutrient. Here, we have identified Tap as the key receptor, which senses dipeptide in TB. The combined effects of growth and multiple chemosensors—E. coli has five different types of chemoreceptors that can sense a diverse set of different amino acids, sugars, oxygen, and other nutrient molecules—allow cells to find favorable conditions in complex environments with multiple nutrient sources and conflicting sensory cues.
Materials and Methods
All E. coli strains used in our experiments were from the Parkinson laboratory except DYM1 (), which was derived from RP437. All strains were transformed with GFP plasmid expressing ampicillin resistance. Attractant stocks used here were 2 mM -methyl-DL-aspartic acid (Sigma) solubilized in chemotaxis buffer (CB; 1 PBS, 0.1 mM EDTA, 0.01 mM l-methionine, and 10 mM DL-lactate). Bacteria were grown overnight in TB, shaking at 200 rpm and incubating at C. The overnight cultures were diluted in fresh TB (1:200) and cultured for 5 h. Cells were harvested at midlog phase OD = 0.1–0.4 by centrifugation at 500 g for 5 min. The harvested cells were resuspended in CB at OD = 0.1–0.35 for experiments. A MeAsp gradient was first established within 30 min after depositing MeAsp in reservoir 1. Next, cells were loaded into reservoir 2 and swam into the MeAsp side within 20 min. We only integrated agarose gel into the barrier region between reservoir 1 and the channel to prevent cells from entering reservoir 1, and there was no barrier between reservoir 2 and the channel. The remaining cells in reservoir 2 were then washed out with CB twice. After that, different levels of diluted TB were loaded into reservoir 2. See SI Appendix for details on chip fabrication and experimental procedures.
Supplementary Material
Acknowledgments
We thank Prof. Sandy Parkinson (University of Utah) for the gift of strains used in this study and Dr. Yihao Zhang (Peking University) for the GFP plasmid. We thank one of the reviewers for helping us to make the paper more accessible for readers focused on the biology. This work is partially supported by National Science Foundation of China Grants 11434001, 11674010, and 11774011; and NIH Grant R01-GM081747 (to Y.T.).
Footnotes
The authors declare no conflict of interest.
This article is a PNAS Direct Submission.
This article contains supporting information online at www.pnas.org/lookup/suppl/doi:10.1073/pnas.1808200116/-/DCSupplemental.
References
- 1.Parkinson JS, Hazelbauer GL, Falke JJ. Signaling and sensory adaptation in Escherichia coli chemoreceptors: 2015 update. Trends Microbiol. 2015;23:257–266. doi: 10.1016/j.tim.2015.03.003. [DOI] [PMC free article] [PubMed] [Google Scholar]
- 2.Tu Y. Quantitative modeling of bacterial chemotaxis: Signal amplification and accurate adaptation. Annu Rev Biophys. 2013;42:337–359. doi: 10.1146/annurev-biophys-083012-130358. [DOI] [PMC free article] [PubMed] [Google Scholar]
- 3.Li M, Hazelbauer GL. Cellular stoichiometry of the components of the chemotaxis signaling complex. J Bacteriol. 2004;186:3687–3694. doi: 10.1128/JB.186.12.3687-3694.2004. [DOI] [PMC free article] [PubMed] [Google Scholar]
- 4.Berg HC. E. coli in Motion. Springer Science & Business Media; New York: 2008. [Google Scholar]
- 5.Sourjik V, Wingreen NS. Responding to chemical gradients: Bacterial chemotaxis. Curr Opin Cell Biol. 2012;24:262–268. doi: 10.1016/j.ceb.2011.11.008. [DOI] [PMC free article] [PubMed] [Google Scholar]
- 6.Neumann S, Hansen CH, Wingreen NS, Sourjik V. Differences in signalling by directly and indirectly binding ligands in bacterial chemotaxis. EMBO J. 2010;29:3484–3495. doi: 10.1038/emboj.2010.224. [DOI] [PMC free article] [PubMed] [Google Scholar]
- 7.Mesibov R, Adler J. Chemotaxis toward amino acids in Escherichia coli. J Bacteriol. 1972;112:315–326. doi: 10.1128/jb.112.1.315-326.1972. [DOI] [PMC free article] [PubMed] [Google Scholar]
- 8.Adler J, Hazelbauer GL, Dahl M. Chemotaxis toward sugars in Escherichia coli. J Bacteriol. 1973;115:824–847. doi: 10.1128/jb.115.3.824-847.1973. [DOI] [PMC free article] [PubMed] [Google Scholar]
- 9.Adler J. Chemotaxis in bacteria. Science. 1966;153:708–716. doi: 10.1126/science.153.3737.708. [DOI] [PubMed] [Google Scholar]
- 10.Wolfe A, Berg H. Migration of bacteria in semisolid agar. Proc Natl Acad Sci USA. 1989;86:6973–6977. doi: 10.1073/pnas.86.18.6973. [DOI] [PMC free article] [PubMed] [Google Scholar]
- 11.Park S, et al. Motion to form a quorum. Science. 2003;301:188. doi: 10.1126/science.1079805. [DOI] [PubMed] [Google Scholar]
- 12.Park S, et al. Influence of topology on bacterial social interaction. Proc Natl Acad Sci USA. 2003;100:13910–13915. doi: 10.1073/pnas.1935975100. [DOI] [PMC free article] [PubMed] [Google Scholar]
- 13.Lambert G, Liao D, Austin RH. Collective escape of chemotactic swimmers through microscopic ratchets. Phys Rev Lett. 2010;104:168102. doi: 10.1103/PhysRevLett.104.168102. [DOI] [PMC free article] [PubMed] [Google Scholar]
- 14.Zhang X, Li L, Luo C. Gel integration for microfluidic applications. Lab Chip. 2016;16:1757–1776. doi: 10.1039/c6lc00247a. [DOI] [PubMed] [Google Scholar]
- 15.Si G, Yang W, Bi S, Luo C, Ouyang Q. A parallel diffusion-based microfluidic device for bacterial chemotaxis analysis. Lab Chip. 2012;12:1389–1394. doi: 10.1039/c2lc21219f. [DOI] [PubMed] [Google Scholar]
- 16.Manson M, Blank V, Brade G, Higgins C. Peptide chemotaxis in E. coli involves the tap signal transducer and the dipeptide permease. Nature. 1986;321:253–256. doi: 10.1038/321253a0. [DOI] [PubMed] [Google Scholar]
- 17.Liu X, Parales RE. Chemotaxis of Escherichia coli to pyrimidines: A new role for the signal transducer tap. J Bacteriol. 2008;190:972–979. doi: 10.1128/JB.01590-07. [DOI] [PMC free article] [PubMed] [Google Scholar]
- 18.Si G, Wu T, Ouyang Q, Tu Y. Pathway-based mean-field model for Escherichia coli chemotaxis. Phys Rev Lett. 2012;109:048101. doi: 10.1103/PhysRevLett.109.048101. [DOI] [PMC free article] [PubMed] [Google Scholar]
- 19.Hu B, Tu Y. Behaviors and strategies of bacterial navigation in chemical and nonchemical gradients. PLoS Comput Biol. 2014;10:e1003672. doi: 10.1371/journal.pcbi.1003672. [DOI] [PMC free article] [PubMed] [Google Scholar]
- 20.Keller E, Segel L. Traveling bands of chemotactic bacteria: A theoretical analysis. J Theor Biol. 1971;30:235–248. doi: 10.1016/0022-5193(71)90051-8. [DOI] [PubMed] [Google Scholar]
- 21.Budrene EO, Berg HC. Dynamics of formation of symmetrical patterns by chemotactic bacteria. Nature. 1995;376:49–53. doi: 10.1038/376049a0. [DOI] [PubMed] [Google Scholar]
- 22.Maddock J, Shapiro L. Polar location of the chemoreceptor complex in the Escherichia coli cell. Science. 1993;259:1717–1723. doi: 10.1126/science.8456299. [DOI] [PubMed] [Google Scholar]
- 23.Bray D, Levin M, Morton-Firth C. Receptor clustering as a cellular mechanism to control sensitivity. Nature. 1998;393:85–88. doi: 10.1038/30018. [DOI] [PubMed] [Google Scholar]
- 24.Ames P, Studdert CA, Reiser RH, Parkinson JS. Collaborative signaling by mixed chemoreceptor teams in Escherichia coli. Proc Natl Acad Sci USA. 2002;99:7060–7065. doi: 10.1073/pnas.092071899. [DOI] [PMC free article] [PubMed] [Google Scholar]
- 25.Mello B, Tu Y. An allosteric model for heterogeneous receptor complexes: Understanding bacterial chemotaxis responses to multiple stimuli. Proc Natl Acad Sci USA. 2005;102:17354–17359. doi: 10.1073/pnas.0506961102. [DOI] [PMC free article] [PubMed] [Google Scholar]
- 26.Mello BA, Tu Y. Effects of adaptation in maintaining high sensitivity over a wide range of backgrounds for Escherichia coli chemotaxis. Biophys J. 2007;92:2329–2337. doi: 10.1529/biophysj.106.097808. [DOI] [PMC free article] [PubMed] [Google Scholar]
- 27.Li Z, et al. Barrier crossing in Escherichia coli chemotaxis. Phys Rev Lett. 2017;118:098101. doi: 10.1103/PhysRevLett.118.098101. [DOI] [PMC free article] [PubMed] [Google Scholar]
- 28.Saragosti J, et al. Directional persistence of chemotactic bacteria in a traveling concentration wave. Proc Natl Acad Sci USA. 2011;108:16235–16240. doi: 10.1073/pnas.1101996108. [DOI] [PMC free article] [PubMed] [Google Scholar]
- 29.Fu X, et al. Spatial self-organization resolves conflicts between individuality and collective migration. Nat Commun. 2018;9:2177. doi: 10.1038/s41467-018-04539-4. [DOI] [PMC free article] [PubMed] [Google Scholar]
- 30.Saragosti J, et al. Mathematical description of bacterial traveling pulses. PLoS Comput Biol. 2010;6:e1000890. doi: 10.1371/journal.pcbi.1000890. [DOI] [PMC free article] [PubMed] [Google Scholar]
- 31.Kalinin Y, Neumann S, Sourjik V, Wu M. Responses of Escherichia coli bacteria to two opposing chemoattractant gradients depend on the chemoreceptor ratio. J Bacteriol. 2010;192:1796–1800. doi: 10.1128/JB.01507-09. [DOI] [PMC free article] [PubMed] [Google Scholar]
- 32.Jani S, Seely AL, Peabody VGL, Jayaraman A, Manson MD. Chemotaxis to self-generated AI-2 promotes biofilm formation in Escherichia coli. Microbiology. 2017;163:1778–1790. doi: 10.1099/mic.0.000567. [DOI] [PubMed] [Google Scholar]
- 33.Laganenka L, Colin R, Sourjik V. Chemotaxis towards autoinducer 2 mediates autoaggregation in Escherichia coli. Nat Commun. 2016;7:12984. doi: 10.1038/ncomms12984. [DOI] [PMC free article] [PubMed] [Google Scholar]
- 34.Sule N, et al. The norepinephrine metabolite 3,4-dihydroxymandelic acid is produced by the commensal microbiota and promotes chemotaxis and virulence gene expression in enterohemorrhagic Escherichia coli. Infect Immun. 2017;85:e00431-17. doi: 10.1128/IAI.00431-17. [DOI] [PMC free article] [PubMed] [Google Scholar]
- 35.Pasupuleti S, Sule N, Manson MD, Jayaraman A. Conversion of norepinephrine to 3, 4-dihdroxymandelic acid in Escherichia coli requires the QseBC quorum-sensing system and the fear transcription factor. J Bacteriol. 2018;200:e00564-17. doi: 10.1128/JB.00564-17. [DOI] [PMC free article] [PubMed] [Google Scholar]
Associated Data
This section collects any data citations, data availability statements, or supplementary materials included in this article.


