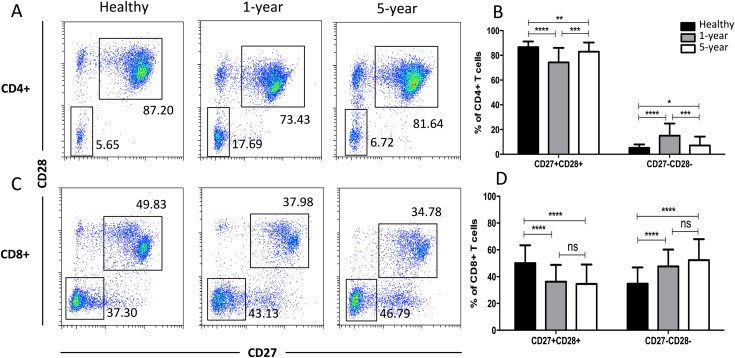
Figure 5. Parental proportions of costimulatory molecular (CD27 and CD28) T cells among different groups.
In CD4+ subsets, healthy individuals showed a higher percentage of CD27+CD28+ T cells than both 1-year (p < 0.0001) and 5-year (p < 0.01) renal allograft recipients; 1-year recipients had a lower percentage than 5-year group (p < 0.001). Healthy individuals showed a lower percentage of CD27-CD28- T cells than both 1-year (p < 0.0001) and 5-year (p < 0.05) renal allograft recipients; 1-year recipients had a higher percentage than 5-year group (p < 0.001) (A) and (B). In CD8+ subsets, healthy individuals showed a higher percentage of CD27+CD28+ T cells than both 1-year (p < 0.0001) and 5-year (p < 0.0001) renal allograft recipients. Healthy individuals showed a lower percentage of CD27-CD28- T cells than both 1-year (p < 0.0001) and 5-year (p < 0.0001) renal allograft recipients (C) and (D). The differences of both CD4+ and CD8+ CD27-CD28- T cells were not significant (p > 0.05) (A–D). Data are expressed as mean number of each group (mean ± SD). *p < 0.05, **p < 0.01, ***p < 0.001, and ****p < 0.0001.

