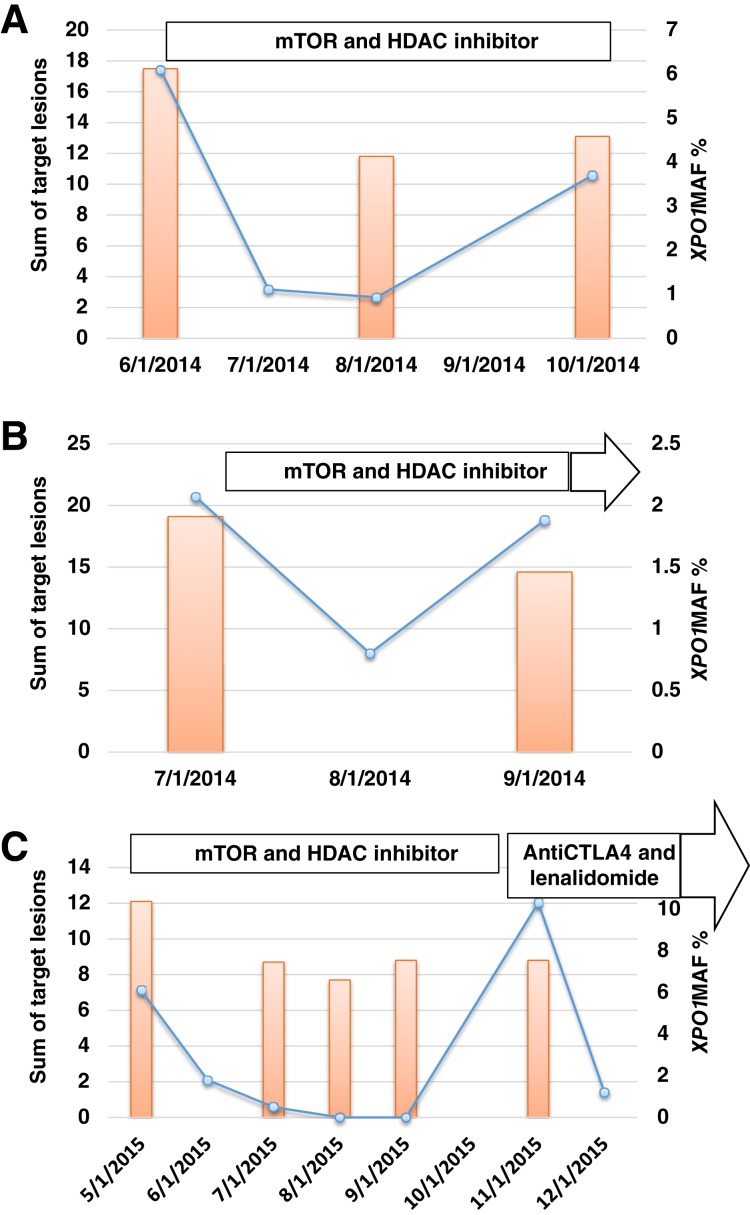
Figure 4.
Dynamic changes in XPO1 E571K MAF. Changes in XPO1 E571K MAF in plasma cell‐free DNA are shown as blue graph lines. Changes in tumor size, represented by the sum of perpendicular diameters of target tumor lesions evaluated by Cheson criteria (orange bars), in two Hodgkin lymphoma patients treated with mTOR and HDAC inhibitors (A and B) and one patient treated with mTOR and HDAC inhibitors followed by an anti‐CTLA4 antibody plus lenalidomide (C), are also shown. Abbreviations: CTLA4, cytotoxic T‐lymphocyte associated protein 4; HDAC, histone deacetylase; MAF, mutant allele frequency; mTOR, mammalian target of rapamycin.

