Abstract
Background:
Lobaplatin (LBP) is a third-generation platinum compound.
Material and methods:
This prospective study was performed in 7 institutions in 2014–2016. Elderly small cell lung cancer (SCLC) patients (≥65 years old) were divided into 2 groups to receive LBP regimens according to endogenous creatinine clearance rate (Ccr). LBP was administered at 30 and 20 mg/m2 in groups A (Ccr ≥ 80 ml/min) and B (60 ml/min ≤ Ccr < 80 ml/min), respectively. The primary endpoint was plasma LBP concentrations. Secondary endpoints were safety and efficacy parameters, including progression-free survival (PFS) and overall survival (OS).
Results:
One-hundred patients were enrolled. Median PFS and OS in groups A and B were 155 vs170 days and 306 vs 272 days, respectively. The rates of grade III/IV AEs in groups A and B were 60.8% (n = 31) and 51.0% (n = 25), respectively. In population pharmacokinetics, the area under the curve (AUC) value for group B was 39% lower than that of group A. With LBP administration based on body surface area (BSA), AUC differences between individuals were small.
Conclusion:
With Ccr ≥ 60 ml/min, BSA based administration is necessary. Meanwhile, LBP-based regimens are reliable in treating elderly patients with SCLC.
Keywords: chemotherapy, lobaplatin, plasma concentration, population pharmacokinetics, small-cell lung cancer
1. Introduction
As the global trend of aging becomes increasingly apparent, the incidence and mortality of small cell lung cancer (SCLC) in the elderly also show increasing trends.[1] Chemotherapy is one of the main therapeutic methods for SCLC. The etoposide and cisplatin (EC) regimen has been considered the classical first-line standard regimen in evidence-based medicine for the past 30 years.[2,3] However, due to the nephrotoxicity, ototoxicity, neurotoxicity, and gastrointestinal toxicity of cisplatin (DDP), as well as treatment-induced drug resistance, long-term use of DDP is limited. Although the EC regimen combined with carboplatin (CBP) instead of DDP also represents a standard regimen according to NCCN (National Comprehensive Cancer Network) guidelines, its clinical use and efficacy are restricted due to myelosuppression by CBP and the high degree of cross-resistance between DDP and CBP. Currently, no standard treatment has been established for elderly patients with SCLC, in whom individualized treatment has been seldom reported. Therefore, it is of great value to actively assess new platinum drugs and their individualized administration regimens with high efficiency, low toxicity, and no cross-resistance, which are suitable for elderly patients.
Lobaplatin (LBP), a third-generation platinum anticancer drug,[4–7] was launched in the Chinese market in 2005 for the treatment of SCLC, advanced breast cancer and chronic myeloid leukemia.[3,8] Multiple clinical studies have shown that LBP instead of DDP as a single drug or combined with EL (with etoposide) and IL (with irinotecan) regimens,[9,10] is helpful in the treatment of SCLC; in addition, the rate of adverse reactions was shown to be significantly reduced, indicating better tolerance. Theoretically, LBP is more suitable for elderly patients with SCLC. Pharmacokinetic (PK) studies showed that[11–13] LBP is excreted into urine in its original form by glomerular epithelial cells, with a linear positive correlation observed between clearance of unbound free platinum and that of creatinine (correlation coefficient r = 0.91). The logarithm of the thrombocytopenia score (log SF) associated with LBP treatment is linear and positively correlated with the area under the curve (AUC) of free platinum, with a correlation coefficient r = 0.72.[12] These findings further suggested that LBP-related thrombocytopenia is a dose-dependent side effect. Therefore, the initial dose of LBP can be adjusted according to the patient's creatinine clearance rate (Ccr), and subsequent LBP doses are adjusted according to the severity level of adverse reactions in the previous cycle; this would thereby effectively prevent thrombocytopenia through “dose individualization”.
Population pharmacokinetics/population pharmacodynamics (PPK/PPD) can establish a mathematical model by collecting sparse patient data to quantitatively assess the fixed effects on various PPK/PPD parameters of a given drug. This method has important scientific value and practical significance in the rational use and individualized administration of drugs.[14–17] Despite the broad use of PPK and PPD, these methods have not been applied for LBP. Therefore, in a sub-population of the National 12th 5-year Major Project, this study aimed to actively assess the changing pattern of LBP by PPK/PPD in elderly patients with SCLC as well as the correlation of LBP treatment with the incidence of adverse events (AEs) to provide a theoretical basis for developing an individualized LBP administration protocol for the elderly population.
2. Materials and methods
2.1. Study population
This prospective study (Chinese Clinical Trial Registry, number ChiCTR-OPN-15006057) obtained ethics approval on April 17, 2014, and was performed from June 25, 2014 to July 18, 2016 in 7 institutions, including Jilin Cancer Hospital (Prof Cheng Ying), Hunan Cancer Hospital (Prof Wu Lin), The 307th Hospital of Military Chinese People Liberation (Prof Liu Xiaoqing), Henan Cancer Hospital (Prof Zhao Yanqiu), Cancer Hospital Affiliated to Xinjiang Medical University (Prof Liu Chunling), Fuzhou Pulmonary Hospital of Fujian (Prof Chen Qun), and Liaoning Cancer Hospital (Prof Sun Tao).
Inclusion criteria were: histological or cytological diagnosis of SCLC; age ≥65 years; PS score of 0 to 2 and at least 1 measurable lesion; acceptable marrow (absolute ANC count ≥ 1.5 × 10⁹/L, PLT ≥ 100 × 109/L and HB ≥ 90 g/L), renal (Cr ≤ the upper limit of normal [ULN] and Ccr ≥ 60 ml/min, obtained by Cockcroft-Gault formula; Appendix 2), and hepatic (STB and CB ≤ ULN × 1.5, and alanine transaminase (ALT) and aspartate aminotransferase (AST) ≤ ULN × 2.5 (in the absence of liver metastasis) or ≤ ULN × 5 (in case of liver metastasis), and coagulation function (PT INR ≤ ULN × 1.5) functions.
Exclusion criteria included: a previous history of allergy to platinum compounds; coagulation dysfunction. Written informed consent was obtained from all patients before enrolment in this study performed in accordance with the Declaration of Helsinki.
2.2. Treatment plan
In this study, after informed consent, the patients were treated with an LBP regimen. The investigators developed individualized chemotherapy regimens based on the 2016 Chinese Society of Clinical Oncology guidelines for diagnosis and treatment of primary lung cancer, which consider SCLC an indication of LBP, for example, LBP+ etoposide (VP-16) or LBP+CPT-11.
Among the 100 subjects, 20 (20.0%) had received previous antitumor therapy previously, including 1 (5.0%) and 19 (95%) cases treated by surgery and chemotherapy, respectively; 4 cases also received radiotherapy, accounting for 20.0%, while 1 patient (5%) underwent other antitumor therapy.
It was required that LBP should be included in all regimens. According to endogenous Ccr levels, the patients were divided into 2 groups, including groups A (Ccr ≥ 80 ml/min) and B (60 ml/min≤Ccr < 80 ml/min). The initial LBP doses were 30 mg/m2 and 20 mg/m2 in groups A and B, respectively. A treatment regimen of 4 cycles was recommended; treatment was discontinued disease progression or intolerable toxicity. Efficacy was assessed every 2 months during the follow-up period until patient withdrawal for several reasons, including voluntary, disease progression, or toxicity.
Three dose levels of VP-16 were adopted: 100 mg/m2 (0), 80 mg/m2 (−1) and 60 mg/m2 (−2); there were 3 dose levels for CPT-11 as well: 200 mg/m2 (0), 160 mg/m2 (−1) and 120 mg/m2 (−2). In group A, LBP was administered at 3 dose levels: 30 mg/m2 (0), 25 mg/m2 (−1) and 20 mg/m2 (−2). Group B patients were administered LBP at 3 dose levels: 20 mg/m2 (0), 15 mg/m2 (−1) and 10 mg/m2 (−2).
In the case of multiple toxicities during a treatment cycle, the dose was adjusted according to toxic effects with a higher CTCAE rating. After dose reduction, the patient would continue to receive a reduced dose in subsequent cycles in case of no recovery. Treatment was terminated when CTCAE grades 3 and 4 occurred with the dose dropped to the −2 level.
If subjects do not meet the requirements for subsequent chemotherapy due to toxicity, the next cycle can be postponed appropriately, but not exceeding 14 days. The doses were adjusted for subsequent treatments based on the level of AEs in accordance with the National Cancer Institute's Common Terminology Criteria for AEs version 4.0 (NCI CTC AE v4.0).[18]
2.3. Sample collection for population pharmacokinetic study
Through a central randomized system, blood collection was performed for each subject at 4 random time points after the initial drug administration. The following time points were assessed: 0 h after infusion; 1 random point at 0.2 h, 0.5 h, or 1.0 h; 2 random points among the following times (2.0 h, 4.0 h, 6.0 h, 8.0 h, 12 h, and 24 h). For the subsequent cycles, only 1 blood sample was collected per patient at 4.0 h after the infusion. A total of 5 ml venous blood was obtained at each collection.
To establish a good PPK model, this study independently conducted a traditional pharmacokinetic study at Hunan Cancer Hospital. Blood samples were collected from each patient at all 10-time points, including 0 h, 0.2 h, 0.5 h, 1.0 h, 2.0 h, 4.0 h, 6.0 h, 8.0 h, 12 h, and 24 h, respectively, after the initial drug administration. Inclusion criteria and the dosing regimen for patients in the traditional pharmacokinetic study were the same applied to subjects in the PPK study.
Blood samples were placed in pre-numbered tubes containing heparin sodium, with negative pressure. First, a 1-ml blood sample was transferred to a cryovial with the corresponding label for assessing total platinum content. Then, the remaining 4-ml blood sample was centrifuged at room temperature at 3000–4000 r/min for 5 to 10 min, and plasma was transferred to a labeled cryovial for the assessment of unbound free platinum content. Whole blood and plasma samples were stored at −20 °C for subsequent tests. The samples were placed in an ice box during transportation and shipped on dry ice.
2.4. Population pharmacokinetic study
After thawing at room temperature, 100 μl of each plasma sample was placed in a 1.5 ml Eppendorf tube. Subsequently, 20 μl of an internal standard solution (5 ng/ml diphenhydramine), 20 μl of methanol-water solution (1:1, v/v), and 500 μl of methanol were added sequentially, followed by vortexing for 1 min and centrifugation for 5 min at 13,300 rpm. The upper organic phase was transferred into another tube, and 50 μl of the resulting supernatant was mixed with 450 μl of 5% formic acid solution; 20 μl of the resulting mixture was subjected to liquid chromatography-tandem mass spectrometry (LC-MS/MS).
Plasma samples were analyzed in accordance with the relevant requirements of the Technical Guidelines for the Study of Bioavailability and Bioequivalence of Chemicals in Chemical Preparations (March 2005)[19] promulgated by the China Food and Drug Administration (CFDA).
2.5. Sample size
Based on previous experience in PPK studies, at least 600 blood sample concentration points were assessed, with no more than 10 fixed effects. An average of 7 blood samples was collected from each subject as normal, and 100 subjects were required as a result.
To establish a sound PPK model, an additional 13 to 15 cases (meeting the above eligibility criteria) were selected for the traditional PK study. The data of blood samples from these patients were only included in the PK analysis and not in efficacy and safety analyses.
2.6. Establishment of the population pharmacokinetic model
These experiments were performed as described previously.[11–14] Details are provided below.
2.6.1. Selection of the basic model
The nonlinear mixed effect model was used to establish the PPK model of LBP in elderly patients with SCLC. One-compartment, 2-compartment, 3-compartment and saturable PK models were used to describe the PK profile of LBP in the elderly. The objective function value (OFV) of the 2-compartment model was the smallest and relatively stable; therefore, it was selected as the basic PK model.
2.6.2. Selection of the statistical model
The selection of the statistical model is the process by which inter-individual and intra-individual variabilities are selected. The exponential model was selected for inter-individual variability:
 |
Meanwhile, additive, proportional, and proportional additive models were selected for the intra-individual variability:
Additive model:
 |
Proportional model:
 |
Proportional additive model:
 |
Pi is the individual parameter, PTV is the population parameter, and ηi is the inter-individual variability, which meets the criteria for normal distribution with a mean of 0 and a variance of ω2. Yobs, ij and Ypred, ij are observation and prediction values for plasma concentration; εij,1 is the intra-individual variability of the proportional model; εij,2 is the intra-individual variability of the additive model, which meets the criteria for normal distribution with a mean of 0 and a variance of σn2.
The statistical model examined the additive, proportional and proportional additive models. The OFV of the proportional additive model was the smallest, but the covariance step failed in the fitting. Therefore, the more stable proportional model was selected as the statistical model.
2.6.3. Selection of the fixed effects
The various possible influencing factors that affect PK–PD characteristics were considered the fixed effects. Variables, including creatinine clearance, age, body surface area (BSA), clinical stage, chemotherapy regimen, and dose, were introduced into the basic model in different forms to modify the basic model parameters, and their impacts on the model were observed. The fixed effects were screened by the forward and backward method, graphics method, and clinical significance. A difference between the OFV of the basic model and the new OFV (Δ-2LL) above 3.84 in the forward selection indicated that the introduced variable significantly improved the fit degree of the model (P < .05). A difference (Δ-2LL) below 6.63 after removal of a variable from the model in backward selection indicated that the indicated variable improved the fit degree of the model (P < .01).
Continuous covariates were introduced by the linear or exponential model as follows:
Linear model:
Exponential model:
 |
θ1 is the typical value for the population when individual covariates and the median of all covariates are equal; θ2 describes the relationship between the typical values of the population and the covariates; COV is the individual covariate.
Classification covariates were introduced by the piece-wise model:
 |
θ1 is the typical value for the population when the covariate is 0; θ2 describes the relationship between typical values for the population and the covariates when the covariate is 1; cov is the covariate value.
2.7. Statistical analysis
Safety analyses included all patients who received at least 1 dose of trial medication and were performed at primary progression-free survival (PFS) analysis. AEs were described in detail, including the start time, end time, severity, relationship with the drug, treatment, and prognosis; the incidence rates of AEs were calculated. Associations of adverse reactions (such as thrombocyte SF) with AUC were assessed.
This study was a 1-arm test to calculate descriptive statistics for efficacy indicators. PFS and OS were assessed by Kaplan–Meier curves, and median values were determined. The 95% confidence intervals of objective response rate (ORR; ratio of cases with optimal efficacy [complete remission + partial remission] versus total cases) and disease control rate (DCR; ratio of cases with complete remission, partial remission, or stable disease for ≥8 weeks versus total cases) were derived. Exploratory correlation analysis was performed for efficacy and general information.
The stability of the model was evaluated by the Bootstrap method. One thousand new datasets were obtained by 1000 samplings with original data replacement, and model parameters for each dataset were calculated. Then, 95% confidence intervals (CIs) for parameters of the dataset were computed by nonparametric statistics, as well as the 2.5 and 97.5 percentiles of the 1000 results.
Visual predictive check (VPC) was used to assess the predictive power of the final model. The predictive power of the obtained model was evaluated by simulating changing of plasma concentration/pharmacokinetic indicators over time and comparing the results of 1000 simulations with the original data. All model parameters were estimated by the first-order conditional estimation with interaction (FOCEI) method, which considers the interaction.
The analysis software programs used were NONMEM (Version 7.3.0, ICON Development Solutions) and PsN (Perl Speaks NONMEM); the R software (Version 3.2.3) and SAS (Version 9.3) were used for graphing and general analysis, respectively.
3. Results
3.1. Patient characteristics
From May 2014 to August 2016, 103 eligible patients were continuously enrolled in the PPK study. Of these, 3 cases received no medication, while the remaining 100 completed at least 1 cycle of treatment. Among them, 78, 57, and 46 subjects completed 2, 3, and 4 cycles of treatment, respectively (Fig. 1). A total of 51 cases with Ccr ≥80 ml/min were assigned to group A, while 49 cases with 60 ml/min ≤ Ccr < 80 ml/min were assigned to group B; 30 and 70 cases were in the limited and extensive stage, respectively (Table 1).
Figure 1.
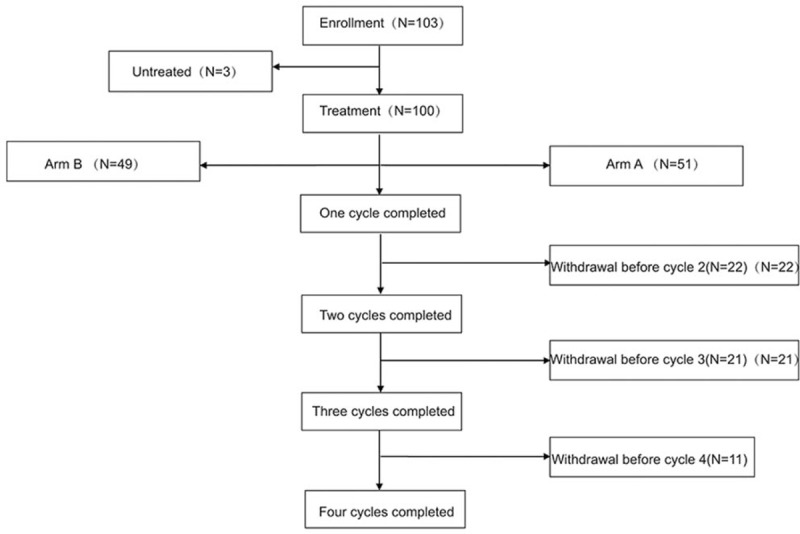
Study flowchart.
Table 1.
Baseline characteristics.
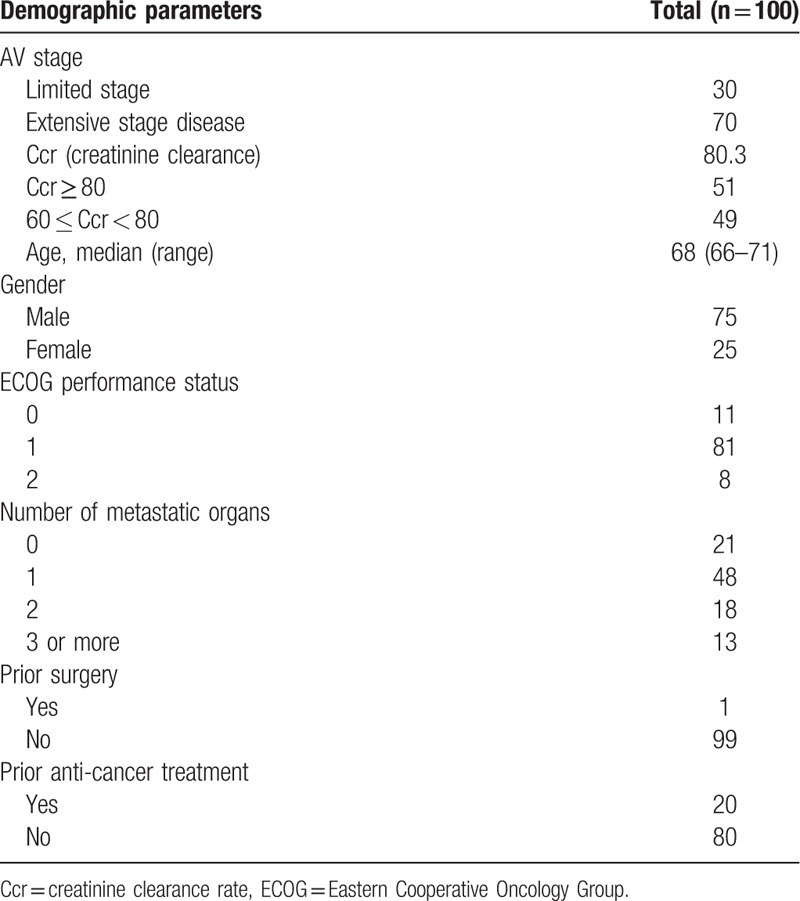
The 100 patients who completed at least 1 cycle of treatment were included in the safety set (SS) and full analysis set (FAS). In addition, 85 patients were included in the per-protocol set.
3.2. Efficacy
Among the 100 patients assessed, median PFS (mPFS) was 159 days (95%CI: 143–181 days), with values of 205 and 154 days for patients at the limited and extensive stages, respectively. The mPFS was 155 days in group A and 170 days in group B. Median OS (mOS) was 283 days (95% CI: 248–334 days), with values of 362 and 248 days for patients at the limited and extensive stages, respectively. The mOS was 306 days in group A and 272 days in group B.
In the FAS, the ORR was 50.59% (95%CI: 39.6–61.22), the DCR was 89.41% (95%CI: 82.87–95.95). For patients at the limited stage, ORR and DCR were 61.54% and 96.15%; ORR and DCR were 45.76% and 86.44% for patients at the extensive stage. ORR and DCR were 50% and 88.64% in group A, respectively, and 51.22% and 90.24% in group B, respectively.
3.3. Toxicity
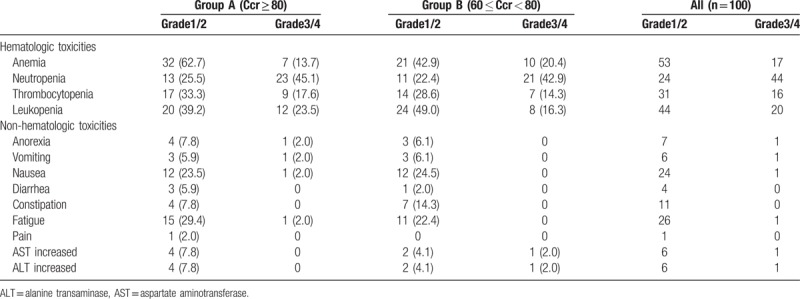
A total of 93 AEs occurred during the trial, indicating an incidence of 93.0%, including 37 grade I-IIAEs. Three severe AEs occurred, indicating an incidence of 3.0%. The incidence rates of grade III/IV ALT/AST alterations, anemia, and hyperglycemia in group B were slightly higher than those of group A (Table 2). Meanwhile, the incidence rates of other AEs were similar between the 2 groups. No correlation was observed between safety and Ccr in elderly patients with Ccr ≥ 60 ml/min.
Table 2.
Adverse events.
3.4. Pharmacokinetics
In this study, 113 elderly SCLC patients were enrolled in the pharmacokinetic analysis (13 were used in the traditional PK study, and the remaining 100 in the PPK study); 56 cases each were administered 20 mg/m2 and 30 mg/m2, respectively. A total of 678 plasma concentration data were obtained, with 17 data points below the limit of quantitation (BLOQ).
3.5. Fixed effect screening
The stepwise method was adopted to further assess covariates. The general information on healthy subjects included age, height, weight, body mass index (BMI), BSA, and Ccr. Since height, weight, BMI, and BSA are correlated (collinearity), with CL and V theoretically affected by weight, BSA was preferred for covariate screening, and used in allometric equations (exponential model). In addition, due to the large gender difference in this study (a male to female ratio of 75:25), the covariates were likely to be false positives in this distribution. Therefore, the gender factor was not introduced into the covariate screening process.
The BSA and Ccr could be introduced into the model as covariates after screening by the forward and backward method, in which the BSA could significantly affect V1 (ΔOFV = −8.825), with V1 = 51.4+ (BSA-1.675) × 47.7; that is, the population value of V1 was 51.4 L, and V1 was increased by 4.77 L for each 0.1 BSA increment compared with 1.675 (median value in this study). Meanwhile, patient grouping according to the Ccr also significantly affected CL2 (ΔOFV = −7.999), with CL2 values of 12.10 L/h and 15.85 L/h for Ccr < 80 ml/min and Ccr≥80 ml/min, respectively, indicating a 31% increase in patients with Ccr ≥ 80 ml/min.
3.6. Final model and parameter estimation
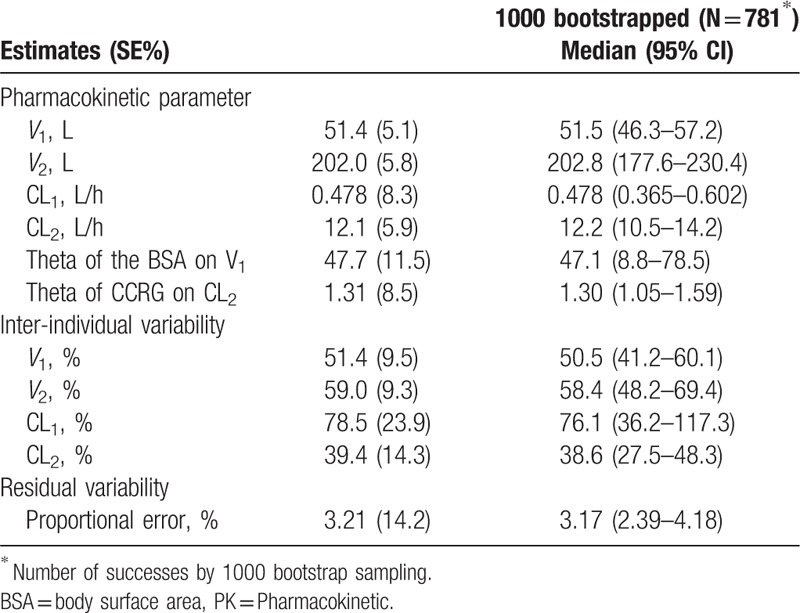
In the final model, intra-individual variability was described by the proportional additive model, while inter-individual variability was described by the exponential model. PK parameters and estimates of variability indexes obtained in the final model are shown in Table 3.
Table 3.
Final parameter estimation of the Pop PK model.
Intra-individual variability:
 |
Inter-individual variability:
 |
The Pop PK model is a 2-compartment model, with V1 and V2 values of 51.4 and 202.0 L, respectively, and CL1 and CL2 values of 0.478 and 12.1 L/h, respectively. The BSA and Ccr were screened and introduced into the model as covariates, and the BSA could significantly affect V1, with V1 = 51.4 + (BSA-1.675) × 47.7; that is, the population value of V1 was 51.4 L, and V1 was increased by 4.77 L for each BSA increment of 0.1 from 1.675 (median in this study). Meanwhile, patient grouping according to the Ccr significantly affected CL2, with CL2 values of 12.10 L/h and 15.85 L/h in patients with Ccr < 80 ml/min and Ccr 80 ml/min, respectively (indicating a 31% increase).
3.7. Model evaluation
The fitting evaluation for the final model (Fig. 2) showed that the predicted values for the population and individuals were well correlated with the observed values, with the trend line close to the diagonal 1. The model fitted the observed values well. Meanwhile, the conditional weighted residuals values were mostly within ±4 and distributed more evenly on the upper and lower sides of the ordinate axis. This indicates that the deviation of the model from actual plasma concentration was small. The fitting values were close to the actual values for each individual.
Figure 2.
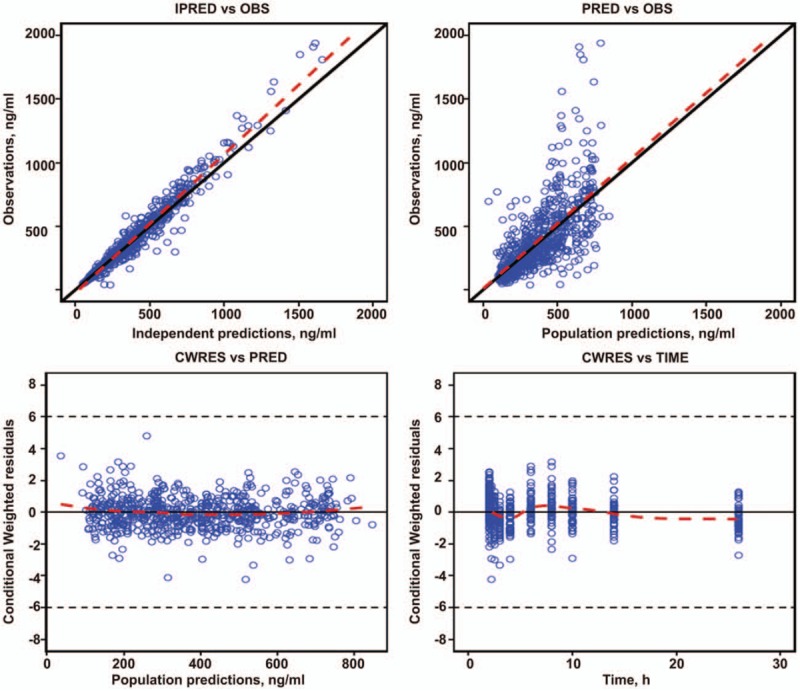
Final goodness of fit evaluation for the Pop PK model. Upper left, observed value versus individual predictive value; upper right, observed value vs group predictive value; bottom left, conditional weighted error vs group predictive value; bottom right, conditional weighted error versus point-in-time. The dotted line represents accuracy (diagonal), and the solid one is the Lowess trend line. PK = pharmacokinetic.
The bootstrap method was used to evaluate the stability of the model. Medians of the parameters obtained by the bootstrap method were basically consistent with those of the original parameters for the sample, and 95% confidence intervals were all within the reasonable range excluding 0. This indicates that the original parameters had stable and reliable values for samples and were not significantly affected by sample distribution (Table 3).
Based on the final model, plasma LBP concentration was simulated 1000 times with the simulation procedure (Fig. 3). The red line in the figure represents the median value predicted by the model, while the dashed blue line indicates the 5% and 95%. The results showed that only 3.4% of the points were not within the 95% confidence interval of the predicted value after simulation of a 4-cycle administration. Meanwhile, only 4.1% of the points were not in the 95% confidence interval of the predicted value after simulation of an administration time of 0 to 24 h. These findings indicated that the established PPK model appropriately described the PK characteristics of LBP.
Figure 3.
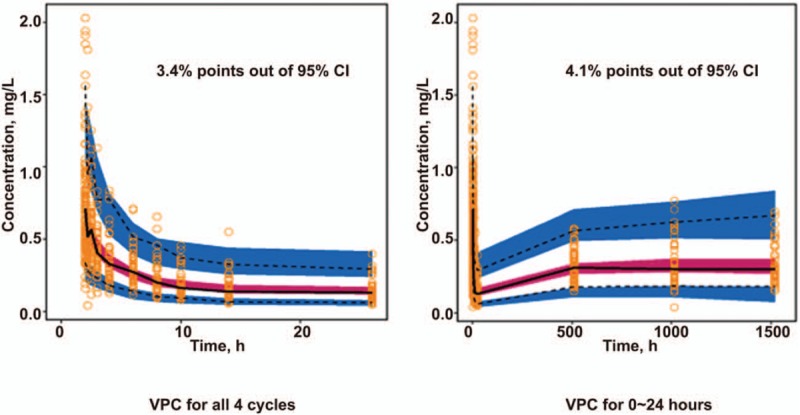
Visual predictive testing of the Final Pop PK Model. Gray points are measured values. The solid line is the median of 1000 simulations in the final model of plasma LBP concentrations, indicating the 2.5th and 97.5th quantiles. The shading represents the 95% confidence interval for each quantile. LBP = lobaplatin, PK = pharmacokinetic.
3.8. Model simulation and prediction
3.8.1. Simulation of LBP administration with a fixed dose
By simulating LBP treatment with the same dose of 30 × 2.09 mg (2.09 is the maximum BSA in the original population), populations with BSA values of 1.24, 1.675, and 2.09 (minimum, median, and maximum values in the original population) and those with Ccr values above or below 80 ml/min were simulated. The results showed AUC values for drug exposure were significantly different in populations with different BSAs (Fig. 4), which confirmed the necessity of BSA-based administration.
Figure 4.
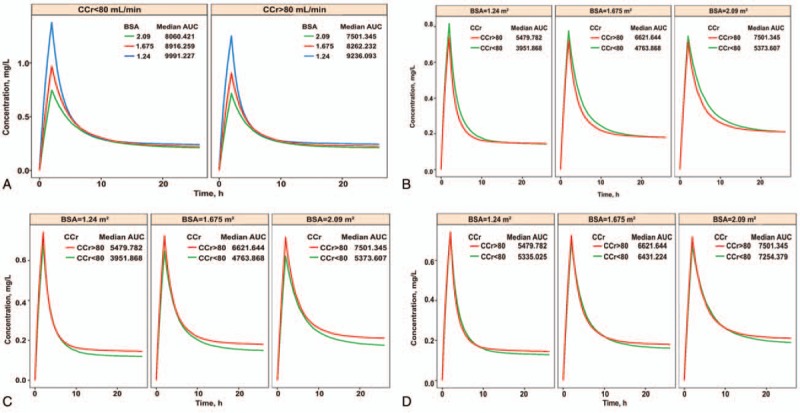
(A) Simulation chart of patients treated at a fixed dose. Left panel, patients with Ccr < 80 ml/min; right panel, patients with Ccr ≥ 80 ml/min. The different colored lines represent populations with distinct BSAs, respectively, and the corresponding median AUCs are plotted. (B) Simulation chart of patients with different Ccr values using BSA-based administration of 30 mg/m2. Left, patients with a BSA of 1.24 m2; middle, patients with a BSA of 1.675 m2; right, patients with a BSA of 2.09 m2. The different colored lines represent populations with distinct BSAs, respectively, and the corresponding median AUCs are plotted. (C) Simulation chart of patients with LBP administration based on the experimental regimens. Left, patients with a BSA of 1.24 m2; middle, patients with a BSA of 1.675 m2; right, patients with a BSA of 2.09 m2. The different colored lines represent populations with distinct BSAs, and the corresponding median AUCs are plotted. (D) Simulation chart of patients with LBP administration based on adjusted experimental regimens. Left, patients with a BSA of 1.24 m2; middle, patients with a BSA of 1.675 m2; right, patients with a BSA of 2.09 m2. The different colored lines represent populations with distinct BSAs, respectively, and the corresponding median AUCs are plotted. AUC = area under the curve, BSA = body surface area, Ccr = creatinine clearance rate, LBP = lobaplatin.
3.8.2. Simulation of LBP administration based on the BSA of patients with different Ccr values
By simulating BSA-based administration at 30 mg/m2, populations with BSA values of 1.24, 1.675, and 2.09, respectively, and those with Ccr above or below 80 ml/min were simulated. The results showed that differences in AUC values for individuals with different BSAs were small; meanwhile, the AUC for group B patients was 8% higher than that of group A, indicating that administration according to the Ccr was not obviously significant.
3.8.3. Simulation of LBP administration according to the protocol
By simulating LBP administration according to the protocol (groups A and B were administered LBP at 30 mg/m2 and 20 mg/m2, respectively), populations with BSA values of 1.24, 1.675, and 2.09, respectively, and those with Ccr values above or below 80 ml/min were simulated. The results showed that the AUC for group B patients was approximately 39% lower than that of group A.
3.8.4. Simulation of LBP administration according to the adjusted regimens
The administration process was adjusted by simulation. With doses of 27 mg/m2 and 30 mg/m2 for patients in groups B and A, respectively, populations with BSA values of 1.24, 1.675, and 2.09, respectively, and those with Ccr values above or below 80 ml/min were simulated. The results showed that the AUC difference was further reduced with dose adjustment in group B (from 20 mg/m2 to 27 mg/m2), and the AUC in group B was only 3% lower than that of group A.
In summary, for patients with Ccr > 60 ml/min (normal renal function), populations with different BSA values showed a great difference in drug exposure in vivo, while the incidence and extent of AEs were essentially the same. It is therefore not necessary to adjust the dose according to the Ccr, and the BSA remains a necessary reference for drug administration.
4. Discussion
This study demonstrated that LBP administration based on the BSA is useful in elderly SCLC patients with Ccr ≥ 60 ml/min; in addition, we found that LBP-based regimens are reliable in the treatment of these patients. Due to changes occurring with age, the physiological functions of the heart, liver, kidney, and other major organs in the elderly are decreased, and drug tolerance by the body is significantly reduced, which can extend the half-life of drugs.[20,21] The kidney plays critical roles in the metabolism and excretion of drugs,[22] and there is a higher risk of adverse reactions in elderly patients compared with the general population. Therefore, it is of great clinical significance to actively develop individualized drug administration protocols for the elderly population. PPK as a new method for PK has been widely applied in recent years.[23] As an excellent method for the clinical study of individualized drug administration, it has wide application prospects. Classical PK and pharmacodynamics (PD) generally involve multiple sampling points. Differences in physiological and pathological characteristics, nutritional status, combination therapy, and genetic factors in the assessed subjects may result in significant individual differences in terms of in vivo metabolism, clearance, and pharmacological activities, for the same drug. To further explain the discrete degree and distribution of clinical PK/PD parameters, to determine the value and variability of a population parameter, and to investigate the effects of different fixed factors (liver and kidney functions, age, height, body weight, and drug combination) simultaneously, population analysis is required.[23] Therefore, PPK is ideal for developing individualized drug administration programs for the elderly population.
A previous phase I study reported that LBP is excreted into urine primarily in its original form by glomerular epithelial cells; a linear positive correlation between unbound, free platinum clearance and creatinine clearance was reported, with a correlation coefficient of r = 0.91. The same study adjusted the dose of LBP based on the Ccr; that is, at a Ccr > 60 ml/min but ≤80 ml/min, the recommended dose of LBP as a single agent was 30 mg/m2; at a Ccr > 81 ml/min but ≤100 ml/min, 55 mg/m2 LBP was recommended; At a Ccr > 100 ml/min, the recommended dose of LBP as a single agent was 70 mg/m2.[11] After the introduction of LBP in China, combination therapy has been mostly used in the clinic, with a recommended LBP dose of 30 mg/m2. it has been confirmed in non-small cell lung cancer.[24] Considering previous findings and the specific conditions of body functions of elderly patients, LBP was used in this study at 20 mg/m2 in elderly SCLC patients with a Ccr > 60 ml/min but ≤80 ml/min, and 30 mg/m2 in those with a Ccr > 100 ml/min. No difference was observed in the incidence and extent of AEs between the 2 groups, indicating that elderly patients with Ccr > 60 ml/min could well tolerate the above regimen.
In this study, the PPK and PPD of LBP in elderly SCLC patients were assessed by PPK simulation. A total of 113 patients from 7 centers (the PPK and traditional pharmacokinetic studies included 100 and 13 patients, respectively) were included to establish an excellent PPK model. The predicted population and individual values determined by this model exhibited a good correlation with the observed ones and passed the VPC test. The results showed that the 95% confidence intervals of predicted values essentially covered all the measured blood concentration values, indicating that the 2-compartment model in this study is appropriate to describe the pharmacokinetic characteristics of LBP in elderly patients with SCLC.
The basic PPK model of LBP in elderly SCLC patients is in line with a 2-compartment model. According to this model and its prediction results, fixed factors such as age, clinical stage, chemotherapy regimen, and dose in the elderly population had no significant effects on LBP PK compared with the BSA and Ccr. The results of fixed effect parameters in this model showed that the BSA could significantly affect V1 (central compartment apparent volume). V1 was increased by 4.77 L for each 0.1 increment of the BSA; meanwhile, patient grouping according to the Ccr significantly affected CL2, with CL2 = 12.10 L/h for a Ccr ≥60 ml/min or < 80 ml/min, and CL2 = 15.85 L/h for a Ccr ≥ 80 ml/min (a 31% increase). With a Ccr ≥60 ml/min, both the Ccr and BSA affected AUC values for the patients, but BSA impact was much greater, which confirms the necessity of BSA-based drug administration in the clinic. The PPK model established in this study provides a basis for individualized drug administration.
The limitations of this study should be mentioned. All patients enrolled had Ccr ≥ 60 ml/min (normal renal function), and the need for BSA-based administration was demonstrated. However, PK in patients with a Ccr < 60 ml/min was not assessed in this study; renal function in these patients was either relatively low or impaired. In theory, the in vivo metabolic and excretory rates of LBP in such patients should be lower so that LBP could easily accumulate within the body, potentially leading to an increased risk of adverse reactions. The Ccr of these patients may have a greater impact on PK, and BSA-based administration may not necessarily appropriate. This deserves further assessment in PPK studies of a wider population of elderly patients with SCLC.
Overall, PPK was used to assess elderly patients with SCLC in this study. With Ccr ≥ 60 ml/min, BSA-based administration of LBP is useful, and LBP-based regimens are reliable in treating elderly SCLC patients. Further studies are warranted to assess those with reduced/impaired renal function (Ccr < 60 ml/min), who were not enrolled in this study.
Author contributions
Conceptualization: Ying Cheng and Qingshan Zheng.
Data curation: Yanqiu Zhao, Chunling Liu, Qun Chen, and Tao Sun.
Formal analysis: Lin Wu.
Funding acquisition: Ying Cheng.
Investigation: Ying Cheng, Chunling Liu and Qun Chen.
Methodology: Xiaoqing Liu.
Project administration: Lin Wu and Tao Sun.
Resources: Yanqiu Zhao, Chunling Liu, Tao Sun, and Qingshan Zheng.
Software: Xiaoqing Liu, Qun Chen.
Supervision: Ying Cheng and Lin Wu.
Validation: Xiaoqing Liu, Yanqiu Zhao, and Qingshan Zheng.
Visualization: Chunling Liu.
Writing – original draft: Ying Cheng.
Footnotes
Abbreviations: AEs = adverse events, AUC = area under the curve, BMI = body mass index, BSA = body surface area, Ccr = creatinine clearance rate, CFDA = China food and drug administration, CWRES = conditional weighted residuals, DCR = disease control rate, EC = etoposide and cisplatin, FOCEI = first-order conditional estimation with interaction, LBP = lobaplatin, mPFS = median PFS, OFV = objective function value, ORR = objective response rate, OS = overall survival, PD = pharmacodynamics, PFS = progression-free survival, PK = pharmacokinetic, PPK/PPD = population pharmacokinetics/population pharmacodynamics, SCLC = small cell lung cancer, VPC = visual predictive check.
This work was supported by China State Project for Essential Drug Research and Development (Grant number: 2013ZX09104001).
All procedures performed in studies involving human participants were in accordance with the ethical standards of the institutional and/or national research committee and with the 1964 Helsinki declaration and its later amendments or comparable ethical standards.
Written informed consent was obtained from all patients.
The authors have no conflicts of interest to declare.
References
- [1].Yau T, Ashley S, Popat S, et al. Time and chemotherapy treatment trends in the treatment of elderly patients (age >/ = 70 years) with small cell lung cancer. Br J Cancer 2006;94:18–21. [DOI] [PMC free article] [PubMed] [Google Scholar]
- [2].Lu HY, Wang XJ, Mao WM. Targeted therapies in small cell lung cancer. Oncol Lett 2013;5:3–11. [DOI] [PMC free article] [PubMed] [Google Scholar]
- [3].McKeage MJ. Lobaplatin: a new antitumour platinum drug. Expert Opin Investig Drugs 2001;10:119–28. [DOI] [PubMed] [Google Scholar]
- [4].Lobaplatin: D 19466. Drugs R D 2003;4:369–72. [DOI] [PubMed] [Google Scholar]
- [5].Kou Y, Koag MC, Cheun Y, et al. Application of hypoiodite-mediated aminyl radical cyclization to synthesis of solasodine acetate. Steroids 2012;77:1069–74. [DOI] [PubMed] [Google Scholar]
- [6].Kou Y, Cheun Y, Koag MC, et al. Synthesis of 14′, 15′-dehydro-ritterazine Y via reductive and oxidative functionalizations of hecogenin acetate. Steroids 2013;78:304–11. [DOI] [PubMed] [Google Scholar]
- [7].Lee S, Kou Y, Koag M. Mechanism of alkylation and platination-induced mutagenesis. Environ MolMutagen 2018;59:107–107. [Google Scholar]
- [8].Jakupec MA, Galanski M, Keppler BK. Tumour-inhibiting platinum complexes–state of the art and future perspectives. Rev Physiol Biochem Pharmacol 2003;146:1–54. [DOI] [PubMed] [Google Scholar]
- [9].Guo W, Liao G, Gao H, et al. Randomized comparison of lobaplatin plus etoposide and cisplatin plus etoposide chemotherapy in patients with extensive-stage small cell lung cancer. Chin Germ J Clin Oncol 2013;12:365–8. [Google Scholar]
- [10].Noda K, Nishiwaki Y, Kawahara M, et al. Irinotecan plus cisplatin compared with etoposide plus cisplatin for extensive small-cell lung cancer. N Engl J Med 2002;346:85–91. [DOI] [PubMed] [Google Scholar]
- [11].Gietema JA, de Vries EG, Sleijfer DT, et al. A phase I study of 1,2-diamminomethyl-cyclobutane-platinum (II)-lactate (D-19466; lobaplatin) administered daily for 5 days. Br J Cancer 1993;67:396–401. [DOI] [PMC free article] [PubMed] [Google Scholar]
- [12].Welink J, Boven E, Vermorken JB, et al. Pharmacokinetics and pharmacodynamics of lobaplatin (D-19466) in patients with advanced solid tumors, including patients with impaired renal of liver function. Clin Cancer Res 1999;5:2349–58. [PubMed] [Google Scholar]
- [13].Gietema JA, Veldhuis GJ, Guchelaar HJ, et al. Phase II and pharmacokinetic study of lobaplatin in patients with relapsed ovarian cancer. Br J Cancer 1995;71:1302–7. [DOI] [PMC free article] [PubMed] [Google Scholar]
- [14].Quartino AL, Hillenbach C, Li J, et al. Population pharmacokinetic and exposure-response analysis for trastuzumab administered using a subcutaneous “manual syringe” injection or intravenously in women with HER2-positive early breast cancer. Cancer Chemother Pharmacol 2016;77:77–88. [DOI] [PMC free article] [PubMed] [Google Scholar]
- [15].Aoyama Y, Kaibara A, Takada A, et al. Population pharmacokinetic modeling of sepantronium bromide (YM155), a small molecule survivin suppressant, in patients with non-small cell lung cancer, hormone refractory prostate cancer, or unresectable stage III or IV melanoma. Invest New Drugs 2013;31:443–51. [DOI] [PMC free article] [PubMed] [Google Scholar]
- [16].Gupta A, Jarzab B, Capdevila J, et al. Population pharmacokinetic analysis of lenvatinib in healthy subjects and patients with cancer. Br J Clin Pharmacol 2016;81:1124–33. [DOI] [PMC free article] [PubMed] [Google Scholar]
- [17].Han K, Peyret T, Quartino A, et al. Bevacizumab dosing strategy in paediatric cancer patients based on population pharmacokinetic analysis with external validation. Br J Clin Pharmacol 2016;81:148–60. [DOI] [PMC free article] [PubMed] [Google Scholar]
- [18].Thanarajasingam G, Sloan JA, Grothey A. Adverse event development in clinical oncology trials - authors’ reply. Lancet Oncol 2016;17:e264–5. [DOI] [PubMed] [Google Scholar]
- [19].Davit B, Braddy AC, Conner DP, et al. International guidelines for bioequivalence of systemically available orally administered generic drug products: a survey of similarities and differences. AAPS J 2013;15:974–90. [DOI] [PMC free article] [PubMed] [Google Scholar]
- [20].Hammerlein A, Derendorf H, Lowenthal DT. Pharmacokinetic and pharmacodynamic changes in the elderly. Clinical implications. Clin Pharmacokinet 1998;35:49–64. [DOI] [PubMed] [Google Scholar]
- [21].Jackson S, Ham RJ, Wilkinson D. The safety and tolerability of donepezil in patients with Alzheimer's disease. Br J Clin Pharmacol 2004;58:1–8. [DOI] [PMC free article] [PubMed] [Google Scholar]
- [22].Ma Y, Xue L, Chen X, et al. Population pharmacokinetics of theophylline in adult Chinese patients with asthma and chronic obstructive pulmonary disease. Int J Clin Pharm 2018;40:1010–8. [DOI] [PubMed] [Google Scholar]
- [23].Bender BC, Schindler E, Friberg LE. Population pharmacokinetic-pharmacodynamic modelling in oncology: a tool for predicting clinical response. Br J Clin Pharmacol 2015;79:56–71. [DOI] [PMC free article] [PubMed] [Google Scholar]
- [24].Qin SK, Cheng Y, Chen ZD, et al. Dose escalation trial of lobaplatin combined with paclitaxel in patients with advanced non-small cell long cancer as the first-line therapy. Chin Clin Oncol 2018;23:97–100. [Google Scholar]


