Abstract
In nearly all subfields of biomedical sciences, there are phenotypes that are currently classified by expert visual scoring. In research applications, these classifications require the experimenter to be blinded to the treatment group in order to avoid unintentional bias in scoring. Currently, many labs either use laborious and tedious methods to manually blind the images, require multiple experimenters to gather and score the data blindly or fail to properly blind the data altogether. In this protocol, we present a simple, freely available software that we created that allows the experimenter to blindly score images. In our protocol, the user loads unblinded images and defines a scoring system. The software then shows the user the images in a random order, allowing the user to select a score from their defined scoring system for each image. Furthermore, the software has an optional “quality control” mechanism where the user will be shown some images multiple times to test the robustness of the visual scoring. Finally, the software summarizes the results in an exportable file that includes unblinded summary data for each group and a full list of images with their scores. In this protocol, we briefly present directions for using the software, potential applications, and caveats/limitations to this approach.
Keywords: Blinder, Blind, Visual scoring, Microscopy, Bias, Histopathology, Immunohistochemistry, Diagnosis, Classification
Background
Although considerable efforts are being made to automate image processing and analysis through machine learning and other computational approaches ( Gulshan et al., 2016 ; Janowczyk and Madabhushi, 2016; Esteva et al., 2017 ; Bychkov et al., 2018 ), many biomedical subfields currently require expert visual image classification due to the complexity of the phenotypes being studied. Furthermore, machine learning approaches require many examples to train, so developing automated approaches to score newly discovered or rare phenotypes may take time. Examples of expert image scoring include but are not limited to: medical diagnostic scores for tumors and other pathologies ( Dhyani et al., 2015 ; Fuchs et al., 2018 ), veterinary applications ( Barton et al., 2018 ), and research that requires quantification of physiological and cellular morphologies ( Passeri et al., 2009 ; Bretman et al., 2010 ; Green et al., 2011 ; Gonzalez- Hunt et al., 2014 ; Riley et al., 2016 ).
Expert image scoring requires that the experimenter be blinded to the treatment group in order to avoid unintentional bias in the qualitative visual scoring. Researchers commonly achieve this in one of three ways. First, some labs choose to have multiple experts involved in the preparation of slides/specimens, image acquisition, and image processing/scoring so that treatment groups are not identifiable between tasks ( Bretman et al., 2010 ; Green et al., 2011 ). A second approach is to have a single experimenter prepare specimens, acquire images, and score images, but have a second experimenter manually rename images to blind the scoring to treatment group. A third approach is to create an in-house command line script to blind the image names to avoid the manual manipulation of file names ( Riley et al., 2016 ). All three of these approaches ultimately can lead to a robust and unbiased classification of images, but are labor-intensive, time-consuming, and can lead to errors in assignment of scores.
In this protocol, we introduce a simple, freely available software application we developed to allow the user to load unblinded images, be shown those images in a randomized order, easily assign scores, and receive summarized results in a readily exportable file format. All of these steps are carried out within the software using a simple graphical user interface. The software also includes an optional Quality Control mechanism to help identify scoring inconsistencies. We have recently reported exercise effects on mitochondrial morphology in body wall muscle of the nematode Caenorhabditis elegans that were classified by blind visual categorical scoring using this software ( Hartman et al., 2018 ). Herein, we describe the basic methods for using the software as well as caveats and considerations that should be taken into account when using blind visual scoring of images.
Materials and Reagents
Glass slide
Coverslip
Specimen of choice: Caenorhabditis elegans expressing GFP in the mitochondria of body wall muscle (strain SJ4103)
10 mM sodium azide (Sigma-Aldrich, St. Louis, MO)
-
Agarose
Note: In our example, we used adult Caenorhabditis elegans expressing GFP in the mitochondria of body wall muscle (strain SJ4103); this strain was obtained from the Caenorhabditis Genetics Center (CGC). We immobilized the animals using 10 mM sodium azide (Sigma Aldrich, St. Louis, MO) and mounted them on a 2% agarose pad on a glass slide covered with a coverslip (Shaham, 2006).
Equipment
-
LSM 510 confocal microscope (ZEISS, model: LSM 510) or camera to obtain images
Note: In the presented example, we imaged body wall muscle of nematodes using confocal imaging on a Zeiss LSM 510 confocal microscope with a 40x objective.
Software
-
Blinder (Solibyte Solutions, Durham, NC; http://blinder.solibytesolutions.com/)–available for Windows operating system only
Note: The software is also archived on Zenodo (DOI: 10.5281/zenodo.1464815).
-
Image-processing software to prepare images for scoring
FIJI (a distribution of ImageJ https://fiji.sc/)
-
Statistical software to analyze data
GraphPad Prism 7.04 (https://www.graphpad.com/scientific-software/prism/)
Note: In this protocol, we used FIJI (a distribution of ImageJ) to generate Z-projections of confocal stacks and crop the image to include only body wall muscle from a single animal before loading into the scoring software. We used GraphPad Prism 7.04 to statistically analyze the data from the visual scoring.
Procedure
-
Acquire images of specimen to be scored
In this example, images were acquired by scanning with a 488 nm laser at 1 mW power with 100 ms exposure. Body wall muscle was imaged in the posterior region, just anterior to the tail, in order to avoid confounding autofluorescence from the intestine. 21 images were taken beginning at -15 µm relative Z at 0.5 µm intervals (Figure 1).
-
Process images to obtain a single, isolated and clearly distinguishable image for each specimen
In our study, we used FIJI to generate maximal intensity Z-projections for the confocal stacks and to crop images to display body wall muscle from a single animal (Figure 2). Z-projections were created by opening all images as a stack, then choosing Image, Stacks, Z-project. In the dialog box, we selected all slices and the projection type “Max Intensity.”
-
Decide upon an appropriate scoring system for your specimens/phenotype
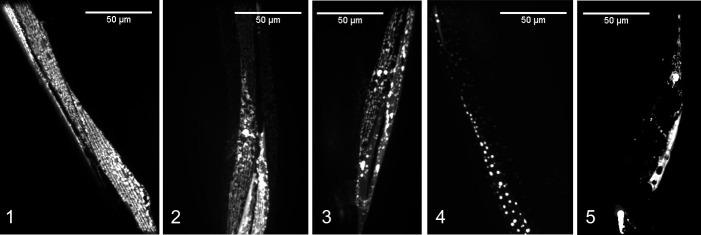
Here, we created a 1-5 scoring system to classify age-related degeneration of mitochondria. In this system, mitochondria with a relatively ‘healthy’ score of 1 showed abundant, networked mitochondria with no “blebs” (large, bright GFP structures) and no spaces between mitochondria (breaks in the network). As the scores increased from 1 to 4, mitochondria become increasingly more fragmented (breaks in the network), sparse, and blebbed. Finally, a score of 5 represents the absence of mitochondria in the muscle region imaged (shown in Figure 3, the example for score 5 shows only autofluorescence).
Load images into Blinder software: “Add Groups of Images”. Click on “Add Group” to add images from each treatment group.
Define Quality Control parameters. Select how many images (% of total images) you would like to have repeated to ensure that scoring is consistent with multiple queries. See “Notes” for suggestions on best practices for quality control.
Define within the software the scoring system developed in Step 3. It is a good idea to include both a numerical value for each category (i.e., 1-5 in our case) and a short description of the selection criteria to remind the user what defines a category. This scoring system can be saved for future use using the “Save” button.
Score your images! Images will be presented randomly to the user, who can assign a score either by using the keyboard (typing the number or letter that begins each score will automatically fill in the dropdown menu) or by selecting the score in the drop-down menu with the mouse (see screenshot in Figure 4).
Browse your results in the Summary and Quality Control windows within the software (see screenshots in Figure 5). The results can then be exported in a .csv format using the “Save Results” button.
Figure 1. Representative confocal stack (0.5 µm slices) of 8-day adult C. elegans nematodes expressing GFP in the mitochondria of body wall muscle.
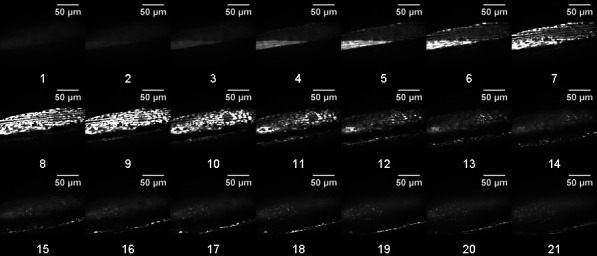
Slices are numbered according to position in the stack. Body wall muscle mitochondria appear clearly in a large upper portion of the image in slices 5-12 and are also present along the lower edge in slices 13-21.
Figure 2. Representative cropped Z-projection from confocal stack displayed in Figure 1.
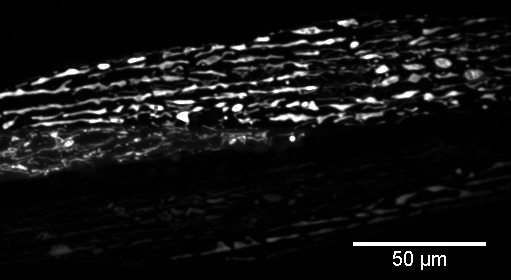
Max intensity was used for the Z-projection type.
Figure 3. Scoring system for mitochondrial networks in C. elegans body wall muscle.
Scores range from healthy (score 1) to severely degenerated (scores 4-5) phenotypes that arise as animals age (adapted from Hartman et al., 2018 ).
Figure 4. Screenshot demonstrating selection of score for a randomly displayed image.
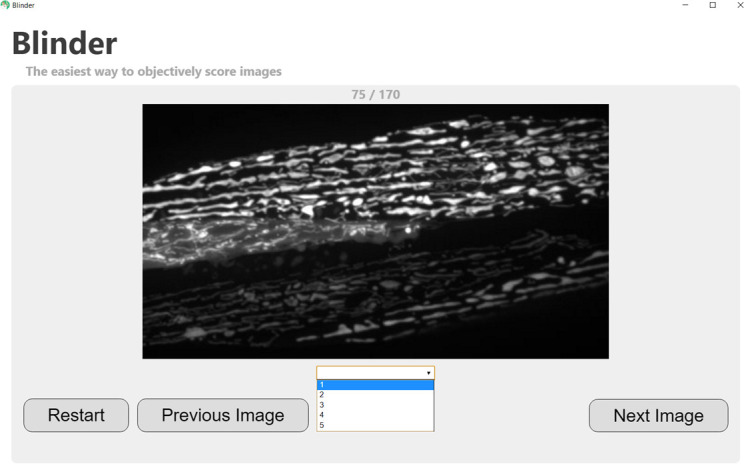
Note that the progress through the image set is shown at the top of the screen (75/170 in this case), and the user has the option to go back to the previous image if an incorrect score is mistakenly assigned.
Figure 5. Screenshot of results.
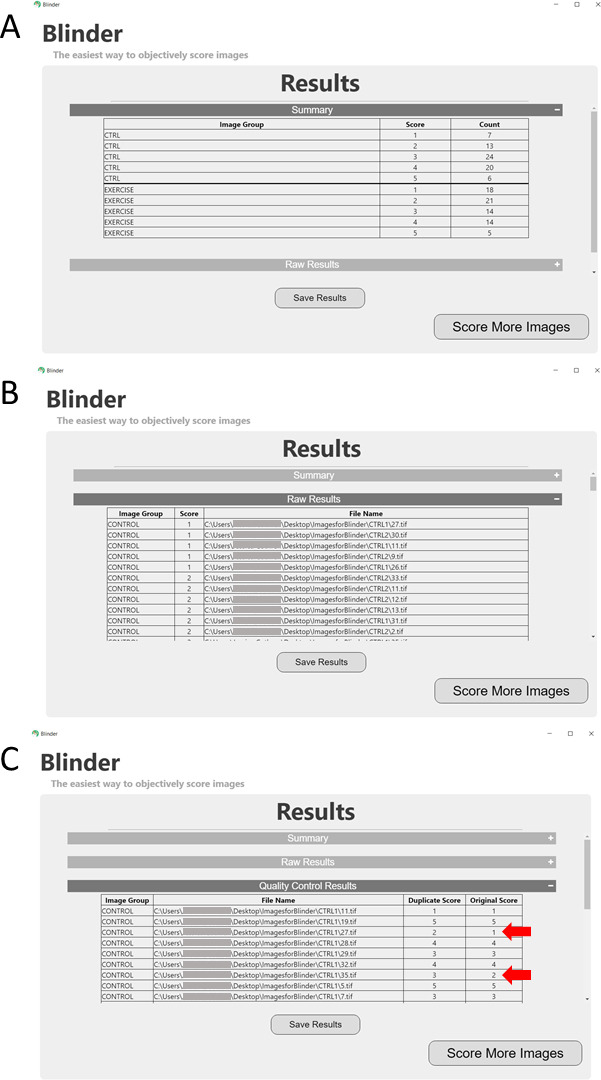
Panel A shows the summary indicating the number of images from each unblinded group (in this case, Control and Exercise) in each scoring category. Panel B gives the raw results indicating the score for each file (given as a full path). Panel C shows the results of the quality control, or repeated images. Red arrows highlight images with failed quality control (mismatched scores). See Notes section for tips if scoring fails quality control.
Data analysis
For data analysis, most applications with scoring systems that include 3 or more possible categories will require a categorical statistical test such as Chi-Square analysis. In our example, we use the Chi-Square test to compare three different treatment groups (control, transiently food-deprived animals, and animals that have undergone swim exercise training). For analysis, actual numbers of animals exhibiting each score (from the blinded categorization) were entered into GraphPad prism “Grouped Analysis” table. The Chi-Square test was then run to globally compare the three groups and test for significance. We found no significant difference between distribution of scores among groups on Day 8, but found significant differences by Day 12 ( Hartman et al., 2018 ).
Notes
-
A word of caution about collecting and scoring images: while we believe that this process can normally be done in an unbiased way, it is necessary to use judgment about the design of the experiment. The experimenter should consider the following:
It should not be possible to ascertain the treatment group identity by looking at the picture (for example, if body/cell size is different for some groups).
The total number of images should be sufficiently large that the experimenter cannot recall specific images belonging to a particular group. If the sample number is small, it would be better to involve another experimenter to ensure no bias.
If possible, image collection, processing, and scoring should be done on different days to avoid recall of specific images.
If there is any concern about image recall, we suggest involving multiple experimenters to load and score images.
Because images must fit comfortably on the user’s monitor during the scoring process, some images will require preprocessing before loading into the software. Cropping, aspect ratio adjustment, size adjustment, and brightness/contrast manipulation may be employed so that images are presented in recognizable format–and this can be a source of bias. To ensure that the user is not introducing bias by manipulating individual unblinded images, when possible, adjustments should be made in “batch” to the whole set of images. For example, if the contrast needs to be increased, consider using “Auto” contrast on all images to avoid manual manipulation of individual unblinded images.
-
Quality control features in the software allow the user to request a certain percentage of total pictures be repeated during the analysis process. This ensures that the user is consistent in the scoring, and may also permit assessment of whether a newly-trained person has reached a level of proficiency that permits them to use a scoring rubric in a fashion comparable to a trained expert. If quality control is failed for any images, the user should consider why the scoring was inconsistent and consider revising the scoring system. Two salient examples are outlined below:
In some situations, an unexpected phenotype might emerge that is different than the ones included in the scoring system. This might be an intermediate phenotype between existing categories in the system, or might be a phenotype that is altogether undescribed by the scoring system. In either case, this type of failure would require an additional score option to be added to the scoring system.
Alternatively, in some cases the scoring system defined by the user might offer a finer level of discrimination than is possible in visual inspection. For example, a score of ‘2’ may be indistinguishable from a score of ‘3’ and the user is frequently failing to classify images consistently in these two categories. In this case, the user should collapse these two scores into a single score in the scoring system.
-
Other Applications: we imagine that there could be many applications, including for non-biological images, where users would need to blindly score images. Below are some examples we have considered.
In teaching and training applications, where an individual is learning to recognize structures/morphologies in images, we imagine this software could be used to test that person’s accuracy and precision of identification. The software could even be used in classroom (and particularly laboratory classroom) settings.
In the development of automated image analysis, one could use Blinder to give an expert visual score benchmark for the performance of such automated systems.
Acknowledgments
The authors would like to gratefully acknowledge the input and suggestions of Melissa Chernick (Duke University, Durham, NC) and Ricardo Laranjeiro (Rutgers University, New Brunswick, NJ) from beta testing previous versions of the software. The strain used in this protocol was provided by the Caenorhabditis Genetics Center (CGC), which is funded by the NIH Office of Research Infrastructure Programs (P40 OD010440). This work was funded in part by NIEHS F32ES027306 (J.H.H.), R01ES028218 (J.N.M.) and P42ES010356 (J.N.M.).
Competing interests
The authors have no conflicts of interest or competing interests to declare.
Citation
Readers should cite both the Bio-protocol article and the original research article where this protocol was used.
References
- 1. Barton A. K., Schulze T., Doherr M. G. and Gehlen H.(2018). Influence of bronchoalveolar lavage on thoracic radiography in the horse. J Vet Sci 19(4): 563-569. [DOI] [PMC free article] [PubMed] [Google Scholar]
- 2. Bretman A., Lawniczak M. K., Boone J. and Chapman T.(2010). A mating plug protein reduces early female remating in Drosophila melanogaster . J Insect Physiol 56(1): 107-113. [DOI] [PubMed] [Google Scholar]
- 3. Bychkov D., Linder N., Turkki R., Nordling S., Kovanen P. E., Verrill C., Walliander M., Lundin M., Haglund C. and Lundin J.(2018). Deep learning based tissue analysis predicts outcome in colorectal cancer. Sci Rep 8(1): 3395. [DOI] [PMC free article] [PubMed] [Google Scholar]
- 4. Dhyani M., Gee M. S., Misdraji J., Israel E. J., Shah U. and Samir A. E.(2015). Feasibility study for assessing liver fibrosis in paediatric and adolescent patients using real-time shear wave elastography. J Med Imaging Radiat Oncol 59(6): 687–694.; quiz 751. [DOI] [PMC free article] [PubMed] [Google Scholar]
- 5. Esteva A., Kuprel B., Novoa R. A., Ko J., Swetter S. M., Blau H. M. and Thrun S.(2017). Dermatologist-level classification of skin cancer with deep neural networks. Nature 542(7639): 115-118. [DOI] [PMC free article] [PubMed] [Google Scholar]
- 6. Fuchs F., Burlat J., Grosjean F., Rayssiguier R., Captier G., Faure J. M. and Dumont C.(2018). A score-based method for quality control of fetal hard palate assessment during routine second-trimester ultrasound examination. Acta Obstet Gynecol Scand. doi: 10.1111/aogs.13418 [DOI] [PubMed] [Google Scholar]
- 7. Gonzalez-Hunt C. P., Leung M. C., Bodhicharla R. K., McKeever M. G., Arrant A. E., Margillo K. M., Ryde I. T., Cyr D. D., Kosmaczewski S. G., Hammarlund M. and Meyer J. N.(2014). Exposure to mitochondrial genotoxins and dopaminergic neurodegeneration in Caenorhabditis elegans . PLoS One 9(12): e114459. [DOI] [PMC free article] [PubMed] [Google Scholar]
- 8. Green R. A., Kao H. L., Audhya A., Arur S., Mayers J. R., Fridolfsson H. N., Schulman M., Schloissnig S., Niessen S., Laband K., Wang S., Starr D. A., Hyman A. A., Schedl T., Desai A., Piano F., Gunsalus K. C. and Oegema K.(2011). A high-resolution C. elegans essential gene network based on phenotypic profiling of a complex tissue . Cell 145(3): 470-482. [DOI] [PMC free article] [PubMed] [Google Scholar]
- 9. Gulshan V., Peng L., Coram M., Stumpe M. C., Wu D., Narayanaswamy A., Venugopalan S., Widner K., Madams T., Cuadros J., Kim R., Raman R., Nelson P. C., Mega J. L. and Webster D. R.(2016). Development and validation of a deep learning algorithm for detection of diabetic retinopathy in retinal fundus photographs. JAMA 316(22): 2402-2410. [DOI] [PubMed] [Google Scholar]
- 10. Hartman J. H., Smith L. L., Gordon K. L., Laranjeiro R., Driscoll M., Sherwood D. R. and Meyer J. N.(2018). Swimming exercise and transient food deprivation in Caenorhabditis elegans promote mitochondrial maintenance and protect against chemical-induced mitotoxicity . Sci Rep 8(1): 8359. [DOI] [PMC free article] [PubMed] [Google Scholar]
- 11. Janowczyk A. and Madabhushi A.(2016). Deep learning for digital pathology image analysis: A comprehensive tutorial with selected use cases. J Pathol Inform 7: 29. [DOI] [PMC free article] [PubMed] [Google Scholar]
- 12. Passeri M. J., Cinaroglu A., Gao C. and Sadler K. C.(2009). Hepatic steatosis in response to acute alcohol exposure in zebrafish requires sterol regulatory element binding protein activation. Hepatology 49(2): 443-452. [DOI] [PMC free article] [PubMed] [Google Scholar]
- 13. Riley A. K., Chernick M., Brown D. R., Hinton D. E. and Di Giulio R. T.(2016). Hepatic responses of juvenile Fundulus heteroclitus from pollution-adapted and nonadapted populations exposed to Elizabeth River sediment extract . Toxicol Pathol 44(5): 738-748. [DOI] [PMC free article] [PubMed] [Google Scholar]
- 14. Shaham S.(2006). Methods in cell biology. The C. elegans Research Community, WormBook, doi/ 10.1895/wormbook.1.49.1. [DOI] [Google Scholar]


