

ABSTRACT
Activated p53 can promote apoptosis or cell cycle arrest. Differences in energy metabolism can influence cell fate in response to activated p53. Nutlin-3a is a preclinical drug and small molecule activator of p53. Alpha-ketoglutarate (αKG) levels were reduced in cells sensitive to Nutlin-3a-induced apoptosis and increased in cells resistant to this apoptosis. Add-back of a cell-permeable αKG analog (DMKG) rescued cells from apoptosis in response to Nutlin-3a. OGDH is a component of the αKGDH complex that converts αKG to succinate. OGDH knockdown increased endogenous αKG levels and also rescued cells from Nutlin-3a-induced apoptosis. We previously showed reduced autophagy and ATG gene expression contributes to Nutlin-3a-induced apoptosis. DMKG and OGDH knockdown restored autophagy and ATG gene expression in Nutlin-3a-treated cells. These studies indicate αKG levels, regulated by p53 and OGDH, determine autophagy and apoptosis in response to Nutlin-3a.
Keywords: Alpha-ketoglutarate, p53, autophagy, apoptosis, Nutlin-3a
Introduction
P53 is a stress responsive transcription factor and potent tumor suppressor. Stress-activated p53 promotes expression of downstream target genes like P21, PUMA, Noxa, and Bax, whose gene products induce cell cycle arrest or apoptosis1. P53 can also regulate energy metabolism. Cancer cells have an altered metabolism compared to normal cells that includes increased glucose uptake and glycolysis and reduced oxidative phosphorylation2. P53 can inhibit glycolysis by promoting expression of TIGAR and repressing expression of various glucose transporter and glycolytic enzyme genes while at the same time increasing expression of genes like sco2 to increase oxidative phosphorylation3-6. The ability of p53 to regulate metabolism is considered important for its tumor suppressor function7. There is evidence that metabolic changes can determine cell fate in response to activated p53. For example, we and others showed that some cancer cell lines undergo apoptosis when treated with the p53-activator Nutlin-3a (Nutlin) while other cell lines undergo cell cycle arrest with minimal apoptosis6,8–10. We observed that glycolysis was inhibited by p53 in cell lines sensitive to Nutlin-induced apoptosis, but not inhibited in cell lines that were apoptosis resistant6. Importantly, inhibiting glycolysis increased apoptosis in response to Nutlin in cells that were otherwise resistant6. This indicated that glycolysis inhibition contributes to apoptosis in p53-activated cells.
Autophagy is a cell survival mechanism that can become activated when nutrient and energy levels are limiting11,12. During autophagy, cells degrade internal organelles and damaged proteins in autophagolysosomes. The degradation products are then recycled into metabolic pathways in order to maintain or restore nutrient and energy levels required for survival. In our studies, we also found differences in autophagy between cell lines that are either sensitive or resistant to Nutlin-induced apoptosis. Specifically, we found autophagy was inhibited in response to Nutlin-activated p53 in cell lines that undergo apoptosis in response to Nutlin, but maintained or increased in cell lines that are apoptosis resistant6. Chemical inhibitors of autophagy increased apoptosis in Nutlin-treated cells that were otherwise apoptosis resistant, supporting the idea that autophagy inhibition contributes to apoptosis6,13. Most importantly, we found that inhibiting glycolysis (e.g. by 2DG treatment) also inhibited autophagy in Nutlin-treated cells, coincident with increased apoptosis6. The results support a model in which glycolysis inhibition promotes apoptosis in Nutlin-treated cells by in some way inhibiting pro-survival autophagy.
In the current report we sought metabolites downstream of glycolysis that could regulate autophagy and influence apoptosis in response to p53. We found that the TCA cycle metabolite αKG was increased in cells resistant to Nutlin-induced apoptosis but reduced in apoptosis-sensitive cells. We found this regulation of αKG was dependent on OGDH, a component of the αKGDH complex, and whose expression we found is elevated in apoptosis sensitive cells. Finally, we found that restoring αKG levels restores autophagy and rescues cells from Nutlin-induced apoptosis. We propose glycolysis inhibition increases apoptosis by reducing αKG levels and thus reducing pro-survival autophagy. We propose αKG levels, regulated by p53 and OGDH, determine autophagy and thus apoptosis and cell fate in Nutlin-treated cells.
Results
We previously showed glycolysis can protect cells against Nutlin-3a-induced apoptosis6,14. Our studies suggested glycolysis protects cells by in some way maintaining autophagy. Based on this we sought metabolites downstream of glycolysis that could potentially regulate autophagy and reduce apoptosis. Alpha-ketoglutarate (αKG) is a TCA cycle metabolite that can be increased downstream of glycolysis. In addition, αKG has been reported to have both positive and negative effects on autophagy in different model and cell systems15-17. We speculated αKG may regulate autophagy and apoptosis in Nutlin treated cells. To test this, we first treated different cancer cell lines with Nutlin and monitored both apoptosis and αKG levels after treatment. This included MDM2 amplified osteosarcoma cell lines (MHM, SJSA1), S4 cells, which is a CP-resistant derivative of MHM cells, and cancer cell lines without MDM2 gene amplification, U2OS (osteosarcoma) and A549 (lung cancer). As shown in Figure 1a, MHM, SJSA1, and S4 cells were sensitive to Nutlin-induced apoptosis (evidenced by an increased percentage of cells with sub-G1 DNA content), while A549 and U2OS cells were largely resistant to apoptosis. Interestingly, αKG levels were reduced in Nutlin-treated MHM, SJSA1, and S4 cells, but were increased in Nutlin treated A549 and U2OS cells (Figure 1b). This result suggests reduced alpha-KG levels are associated with apoptosis sensitivity in Nutlin treated cells, and increased a-KG levels are associated with apoptosis resistance.
Figure 1.
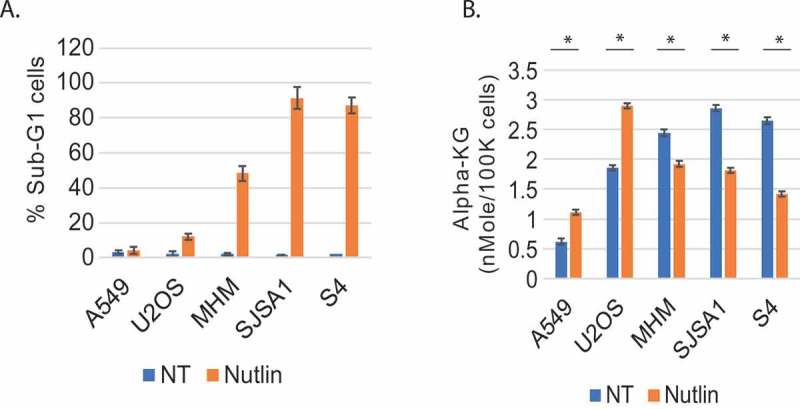
Nutlin-induced α-KG level change correlates with cell fate. A. Cells were treated 72 hr with Nutlin and % sub-G1 cells determined. Data presented as graphs with standard deviation (SD). B. Cells were treated 24 hr with vehicle or Nutlin (10 µM and α-KG levels quantified. Data is presented ± SD. There is a significant difference between vehicle and Nutlin-treated A549 (p=0.011), U2OS (p=0.005), MHM (p=0.002), SJSA1(p˂0.0001), and S4 cells (p˂0.0001).
Next, we asked if increasing αKG levels could protect cells from apoptosis by Nutlin. To this end, we cotreated MHM, SJSA1, and S4 cells with Nutlin and the cell-permeable αKG analog DMKG, and monitored apoptosis by the percentage of cells with sub-G1 DNA content. As shown in Figure 2a, cotreatment with DMKG reduced apoptosis in the Nutlin treated cells. Immunoblotting showed p53 was induced in cells treated with Nutlin alone and also induced in cells treated with Nutlin plus DMKG, though to a slightly lesser extent (Figure 2b). These data indicate DMKG can protect cells from Nutlin-induced apoptosis. Further, the results suggest reduced αKG levels contribute to apoptosis in MHM, SJSA1, and S4 cells treated with Nutlin.
Figure 2.
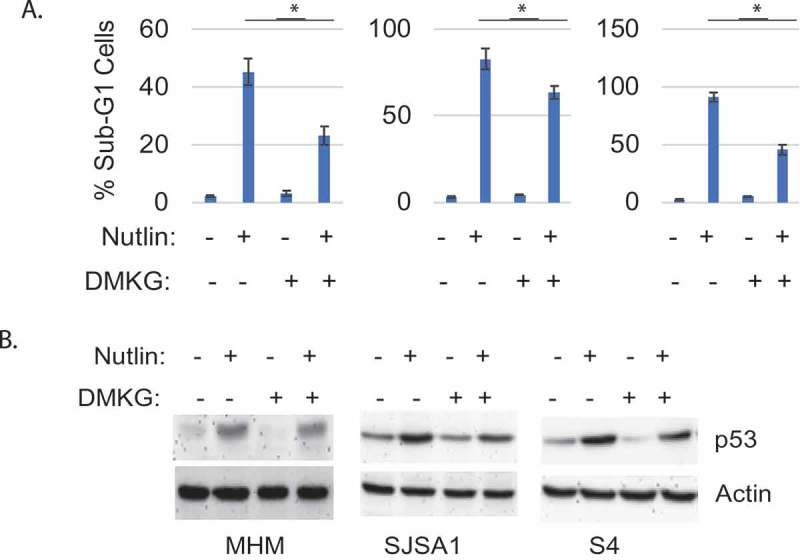
DMKG rescues Nutlin-induced apoptosis in sensitive cells. A. Cells were treated 72 hr with vehicle or Nutlin (10 µM) without or with DMKG (5 mM) and % sub-G1 cells determined. Data presented as graphs with SD indicated. There is significant difference between Nutlin and Nutlin plus DMKG in MHM (p˂0.01), SJSA1 (p˂0.01), and S4 cells (p˂0.01). B. Cells were treated 72 hr with vehicle or Nutlin (10 µM) without or with DMKG (5 mM). Whole cell lysates were immunoblotted for the indicated proteins.
αKGDH is the rate limiting TCA cycle enzyme that converts αKG to succinate. αKGDH is a multiprotein complex that includes the proteins OGDH, DSLT, and DLD. We compared OGDH protein levels by immunoblotting in the cell lines resistant and sensitive to Nutlin-induced apoptosis. As shown in Figure 3a, OGDH levels were higher in MHM, S4, and SJSA1 cells compared to A549 and U2OS cells. These results indicate that OGDH levels are higher in the MDM2-amplified cell lines that are sensitive to Nutlin-induced apoptosis.
Figure 3.
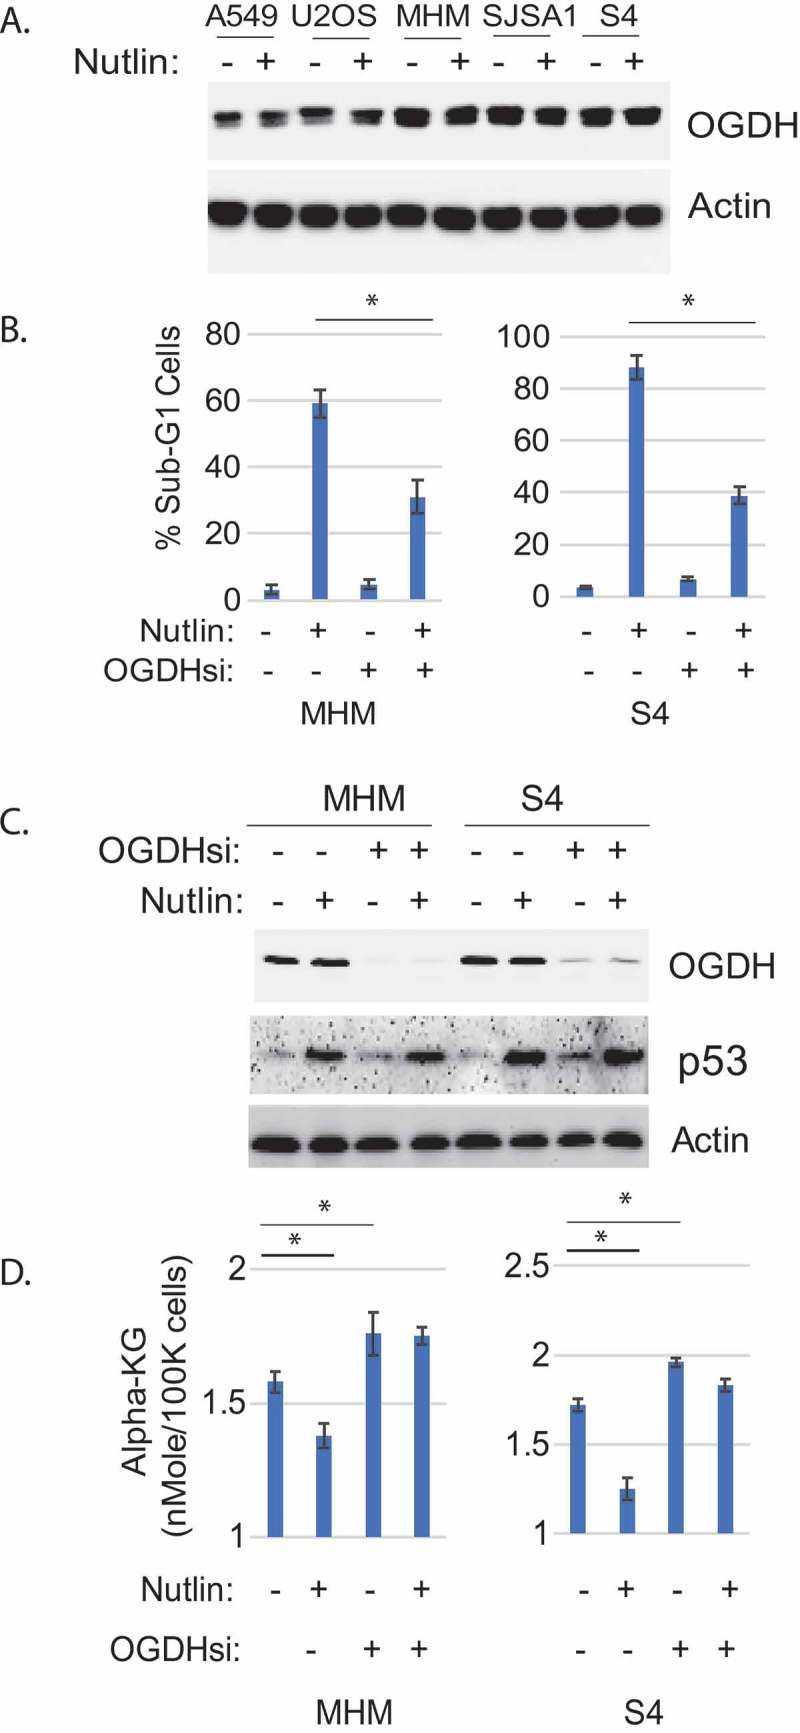
Knockdown of OGDH decreased Nutlin-induced apoptosis and increased cellular alpha-KG level. A. cells were treated 24 hr with Nutlin (10 µM), lysates were immunoblotted for the indicated proteins. B. MHM and S4 cells were transfected with control siRNA or OGDH siRNA and then treated 72 hr with vehicle or Nutlin (10 µM). Cells were analyzed with flow cytometry for sub-G1 cells. Percent cells with sub-G1 were presented as graphs with SD indicated. There is a significant difference (p˂0.005) between Nutlin-treated controls siRNA and OGDH siRNA conditions. C. MHM and S4 cells were transfected with control siRNA or OGDH siRNA and then treated 24hr with vehicle or Nutlin (10 µM). Lysates were immunoblotted for the indicated proteins. C. MHM and S4 cells were transfected with control siRNA or OGDH siRNA and then treated 24hr with vehicle or Nutlin (10 µM), average cellular alpha-KG levels (in triplicate) were presented as graphs with SD indicated. There are significant differences between vehicle and Nutlin-treated MHM and S4 cells and between vehicle-treated control siRNA and OGDH siRNA cells in MHM (p˂0.05) and S4 cells (p˂0.05).
We speculated the high levels of OGDH in MHM, S4, and SJSA1 cells might contribute to apoptosis in Nutlin treated cells by functioning in the αKGDH complex and reducing αKG levels. To test this possibility, we monitored apoptosis and αKG levels in MHM and S4 cells that were treated with Nutlin and in which OGDH was depleted by siRNA. As shown in Figure 3b, Nutlin caused abundant apoptosis in MHM and S4 cells transfected with control siRNA, but caused much less apoptosis in cells where OGDH was depleted. P53 was induced comparably by Nutlin in the control and OGDH knockdown cells, indicating the reduced apoptosis in OGDH knockdown cells is not due to a lower induction of p53 (Figure 3c). αKG levels were reduced by Nutlin in MHM and S4 cells transfected with control siRNA (Figure 4d). However, basal αKG levels were elevated in OGDH knockdown cells, and Nutlin treatment failed to reduce αKG levels in these cells (Figure 3d). These results indicate OGDH expression contributes to the reduction in αKG levels and apoptosis seen in Nutlin treated MHM and S4 cells.
Figure 4.

α-KG or knockdown of OGDH inhibits mTORC1 and increases autophagic flux in response to Nultin. A. MHM and S4 cells were treated with Nutlin (10 µM) and/or DMKG (5 µM) with or without bafilomycin A1 for 24hr. Whole cell lysates were immunobotted for the indicated proteins. B. MHM and S4 cells were treated with Nutlin (10 µM) and/or DMKG (5 µM) for 24hr. Whole cell lysates were immunobotted for the indicated proteins. C. Cells were transfected with control siRNA or OGDH siRNA and then treated 24 hr with vehicle or Nutlin (10 µM) with or without bafilomycin A1. Whole cell lysates were immunoblotted for the indicated proteins. D. Cells were treated with DMKG (5 µM) or knockdown of OGDH and treated with Nutlin (10 µM) for 24hr. Cells were analyzed for MDC sequestration. Relative MDC fluorescence is presented as graphs with SD indicated. There is a significant difference between vehicle and DMKG-treated conditions in MHM and S4 cells (p˂0.05). There is a significant difference between control siRNA and OGDH siRNA conditions (p˂0.05).
We previously reported that autophagy is inhibited by Nutlin in cells sensitive to Nutlin-induced apoptosis, but not inhibited or increased in cells resistant to apoptosis6,13. Inhibition of autophagy increased apoptosis in response to Nutlin, confirming that autophagy promotes apoptosis resistance. The data presented above indicate that αKG, which is regulated by OGDH, promotes resistance to Nutlin-induced apoptosis. Therefore we speculated αKG may protect cells from Nutlin induced apoptosis by promoting autophagy while, in contrast, OGDH may increase sensitivity to Nutlin induced apoptosis by reducing autophagy. To test this we monitored autophagy flux in Nutlin treated MHM and S4 cells when the cells were either co-treated with DMKG, or when the cells had OGDH depleted by siRNA. LC3II is an autophagy protein that is degraded in autophagolysosomes. Bafilomycin inhibits autophagic protein degradation, including the degradation of LC3II. Thus, the extent to which LC3II accumulates in Bafilomycin treated cells reflects the rate of autophagic protein degradation, or autophagy “flux”. As shown in Figure 4a, LC3II accumulated in Bafilomycin treated MHM and S4 cells, indicating autophagic protein degradation was occurring in these cells. However, LC3II accumulated to a lesser extent in MHM and S4 cells cotreated with Nutlin and Bafilomycin compared to cells treated with Bafilomycin alone. This is consistent with our previous findings and indicates Nutlin treatment reduces autophagy flux in these cells. Importantly, LC3II accumulated to a greater extent in cells cotreated with Nutlin plus Bafilomycin plus DMKG compared to cells treated with Nutlin plus Bafilomycin alone. This indicates DMKG increased autophagy flux in Nutlin treated cells, and supports the idea that DMKG may protect cells from Nutlin induced apoptosis by increasing autophagy. mTORC1 is a kinase complex that promotes growth and normally inhibits autophagy, and phosphorylation of S6K is a commonly used indicator of mTORC1 activity. We found increased autophagy flux upon DMKG treatment coincided with reduced S6K phosphorylation (Figure 4b). These findings are consistent with previous reports and suggest DMKG may promote autophagy, at least in part, by inhibiting mTORC116. LC3II also accumulated to a greater extent in OGDH knockdown cells treated with Nutlin plus Bafilomycin compared to control cells treated with Nutlin plus Bafilomycin (Figure 4c), and OGDH knockdown inhibited mTORC1 (indicated by reduced S6K phosphorylation in OGDH knockdown cells compared to control cells) (Figure 4c). These results indicate OGDH knockdown increases autophagy flux in Nutlin treated cells, and support the idea that OGDH knockdown may protect cells from Nutlin induced apoptosis by increasing autophagy. Monondansylcadaverine (MDC) labels lysosomes and autophagosomes18, and cell incorporation of MDC is a common autophagy measure. We found Nutlin decreased MDC incorporation in S4 and MHM cells, while DMKG or knockdown of OGDH increased MDC incorporation (Figure 4d), supporting the idea that autophagy is increased by DMKG and knockdown of OGDH.
Results in Figure 4b and C suggest DMKG and OGDH knockdown may increase autophagy, at least in part, by inhibiting mTORC1. However, Nutlin treatment also inhibited mTORC1 yet inhibited autophagy flux (the inhibition of mTORC1 by Nutlin is evidenced by reduced pS6K levels in Nutlin treated cells, Figure 4(b-c) This indicates Nutlin treatment inhibits autophagy despite the inhibition of mTORC1. We previously showed Nutlin treatment reduces expression of ATG genes whose protein products are required for formation of autophagolysosomes6. DMKG and knockdown of OGDH restored autophagy in Nutlin-treated cells and we therefore speculated DMKG and OGDH knockdown may also restore ATG gene expression. To test this, we analyzed expression of ATG genes in MHM cells treated with Nutlin or Nutlin plus DMKG, and in MHM cells with OGDH knockdown. The results showed that Nutlin reduced mRNA levels of ULK1, ATG3, ATG7, and ATG16L1 in MHM cells. Knockdown of OGDH or co-treatment with DMKG blocked the inhibitory effect of Nutlin on these genes and in some cases appeared to reverse the effect (e.g. ULK1 and ATG16L mRNA levels were increased in Nutlin treated cells with OGDH knockdown compared to control cells (Figure. 5(a-b)). Immunoblotting showed ATG16L1 levels were reduced by Nutlin and ULK1 levels modestly reduced by Nutlin, and these effects were blocked or reversed by DMKG or knockdown of OGDH. The results suggest Nutlin suppressed gene expression of ULK1, ATG3, ATG7, and ATG16L1 by downregulating αKG in MHM cells. Increasing αKG by knockdown of OGDH can restore ATG gene expression to promote autophagy and cell survival in response to Nutlin.
Figure 5.
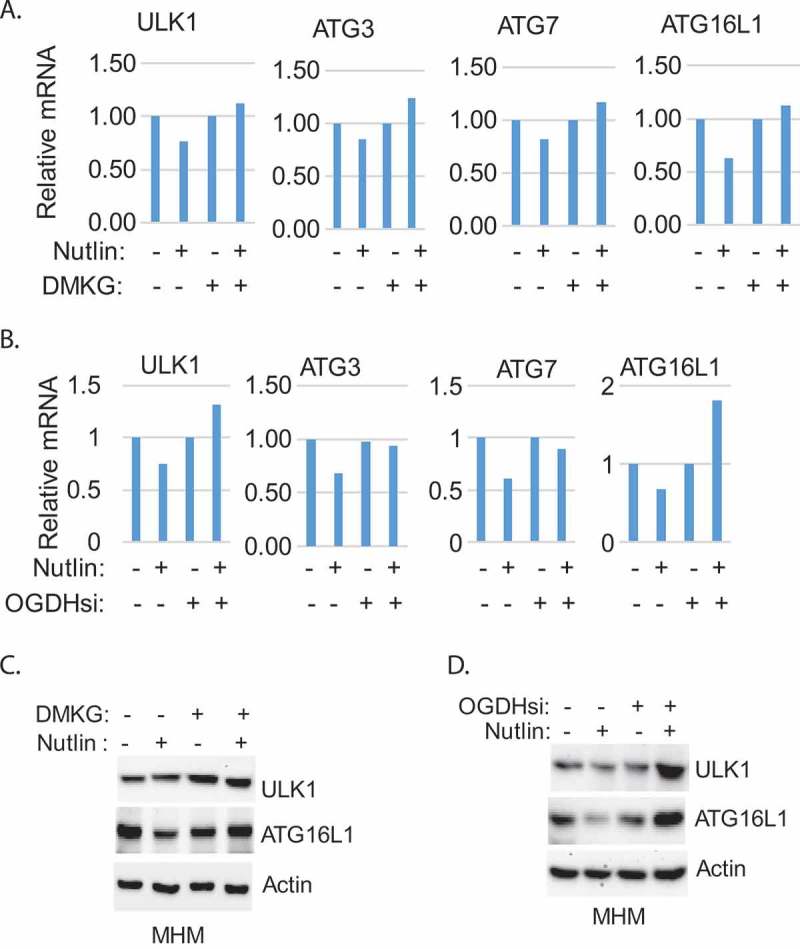
Nutlin decreases expression of ATG genes which is reversed by alpha-KG or knockdown of OGDH. A. MHM cells were treated with Nutlin (10 µM) and/or DMKG (5 µM) for 24hr. B. MHM cells were transfected with control siRNA or OGDH siRNA and treated with vehicle or Nutlin (10 µM) for 24hr. mRNA were analyzed by qT PCR for the indicated ATG genes. Relative mRNA was presented as graphs (note that SD is too small to show). C. MHM cells were treated with DMKG or knockdown of OGDH and treated with vehicle or Nutlin for 24hr. Whole cell lysates were immunoblotted for the indicated genes.
Discussion
We previously reported that blocking glycolysis leads to inhibition of autophagy and cell death (apoptosis) in Nutlin treated cells6. Based on these previous studies we hypothesized that one or more metabolites downstream of glycolysis may regulate autophagy and thus apoptosis in response to Nutlin. We focused on αKG because previous studies (e.g. in c elegans) have shown that αKG can inhibit mTORC1 to promote autophagy and increase survival and longevity16. We found αKG levels were reduced in some cell lines treated with Nutlin and increased in other cell lines. The reduced αKG levels coincided with reduced autophagy and increased apoptosis while, in contrast, increased αKG levels coincided with increased autophagy and apoptosis resistance. Finally, restoring αKG levels by either DMKG addition or OGDH knockdown restored autophagy and rescued cells from Nutlin-induced apoptosis. We conclude αKG levels, regulated by p53 and OGDH, determine autophagy and cell fate/apoptosis in response to Nutlin-activated p53.
A question that arises in the current study is how p53 regulates αKG levels in different cells. αKG is a TCA cycle metabolite that can be produced downstream of glycolysis or via glutamine metabolism after the conversion of glutamine to glutamate. P53 can increase glutamine metabolism by regulating expression of GLS219,20. However, in our continuing experiments we have found that glutamine consumption and the production of glutamate were comparable after Nutlin treatment in cells sensitive to Nutlin-induced apoptosis (MHM, S4) and cells resistant to apoptosis by Nutlin (U2OS). Based on this we do not believe differences in αKG levels between apoptosis sensitive and apoptosis-resistant cells are due to difference in glutamine metabolism. We previously showed glycolysis is inhibited by Nutlin treatment in cells with MDM2 gene amplification that are sensitive to Nutlin-induced apoptosis6,14. The inhibition of glycolysis appears to result from high levels of MDM2 promoting degradation of SP1, a transcription factor that normally maintains glycolysis by promoting expression of glycolytic enzyme genes. MDM2 amplified cells also express higher levels of OGDH compared to cells without MDM2 gene amplification. OGDH is a component of the αKGDH complex that can reduce αKG levels by converting αKG to succinate. Thus, a likely scenario is that reduced αKG levels in MDM2 amplified cells treated with Nutlin results from a combination of high OGDH levels and reduced glycolysis and glucose metabolism through the TCA cycle. Our previous study also showed that Nutlin treatment and p53 can increase AKT activation leading to increased glycolysis in at least some cells (e.g. A549)14. Thus, increased αKG in these Nutlin-treated cells may result in part from increased glycolysis mediated by p53 and AKT.
Results from the current study suggest increased αKG levels promote autophagy and decreased αKG levels reduce autophagy in Nutlin-treated cells. A question that arises is how autophagy is regulated by changes in αKG. Autophagy is controlled in large part by the nutrient sensing mTORC1 complex21. mTORC1 is activated downstream of various growth factor signaling pathways as well as nutrient and energy sensing pathways. Nutrient rich conditions activate mTORC1, and activated mTORC1 then promotes protein synthesis and growth by phosphorylating downstream substrates such as S6K. Activated mTORC1 also inhibits autophagy by phosphorylating and inhibiting the ULK1 initiating complex. Nutrient poor conditions cause inactivation of mTORC1 and subsequent activation of autophagy. Chin et al found in c. elegans that αKG could increase survival and longevity by inhibiting mTORC1 activity and inducing autophagy16. Consistent with this, we found the αKG analog DMKG inhibited mTORC1 activity (evidenced by reduced phosphorylation of S6K) and promoted autophagy flux in Nutlin-treated cells. OGDH knockdown increased endogenous αKG levels, inhibited mTORC1, and also promoted autophagy in Nutlin-treated cells. The results suggest αKG promotes autophagy, in part, by inhibiting mTORC1. Notably, however, Nutlin treatment inhibited autophagy in MHM, S4, and SJSA1 cells despite the fact that mTORC1 was inhibited in these cells. The inhibition of autophagy in these cells coincided with reduced expression of various ATG genes whose protein products promote formation of mature autophagolysosomes. Importantly, add-back of DMKG or knockdown of OGDH restored gene expression of ULK1, ATG3, ATG7, and ATG16L1 in Nutlin treated cells. This result indicates a second way in which αKG can promote autophagy is by maintaining expression of these ATG genes. One possibility is that mTORC1 promotes expression of one or more factors that normally repress ATG gene expression. αKG, by inhibiting mTORC1, may prevent expression of this repressor(s) and in this way restore ATG gene expression. Histone methylation can repress gene expression and αKG is an activating co-factor for the JMJD2-family of histone demethylases.22,23 Thus, a second possibility is that αKG restores ATG gene expression and autophagy by reducing methylation in the promoters of these genes through the action of JMJD2 demethylases. A final question is how autophagy reduces apoptosis in Nutlin treated cells. Apoptosis in most cases involves release of pro-apoptotic factors such as cytochrome c from mitochondria. One possibility is that autophagy protects cells from apoptosis by selectively degrading mitochondria that are prone to release these pro-apoptotic factors.
Materials and methods
Cells and reagents
SJSA1, MHM, U2OS, A549 cells were obtained from ATCC. All the cell lines were grown in RPMI medium with 10% fetal bovine serum (FBS), penicillin (100 U/mL) and streptomycin (100 µg/mL). Cells were plated 48h before being treated with Nutlin at the indicated concentrations. Nutlin, monodansylcadaverine (MDC), dimethyl ketoglutarate (DMKG), and bafilomycin A1 were obtained from Sigma Chemical Co (St. Louis, MO).
Immunoblotting
Whole cell extracts were prepared by scraping cells in RIPA buffer, resolved by sodium dodecyl sulfate polyacrylamide gel electrophoresis (SDS-PAGE) and transferred to polyvinylidene difluoride membranes (Thermo Fisher Scientific). Antibodies to ULK1, ATG16L1, OGDH, and SP1 were from Cell Signaling (Boston, MA); LC3B antibodies were from Abcam (San Francisco, CA). β-actin, MDM2, and p53 (DO-1) antibodies were from Santa Cruz (CA). Primary antibodies were detected with goat anti-mouse or goat anti-rabbit secondary antibodies conjugated to horseradish peroxidase was from Invitrogen (Carlsbad, CA), using Clarity chemiluminescence (BIO-RAD).
Flow cytometry
For cell cycle analysis, cells were harvested and fixed in 25% ethanol overnight. The cells were then stained with propidium iodide (25 µg/ml, Calbiochem). Flow cytometry analysis was performed on a Gallios™ Flow Cytometer (Beckman Coulter), analyzed with FlowJo 10 (Treestar Inc). For each sample, 10,000 events were collected.
Sirna-mediated transient knockdown
OGDH siRNA (On-target plus smart pool) and Control siRNA (On-target plus siControl non-targeting pool) were purchased from Dharmacon and were transfected according to the manufacturer’s guidelines using DharmaFECT I reagent.
Shrna-mediated stable knockdown
The lentiviral pLVUT-KRAB p53 shRNA was described (a generous gift from Dr. Patrick Aebischer) 24; the lentiviral packaging and envelop vectors psPAX2 and pMD2G (Addgene plasmid 12260 and 12259 deposited by Dr. Didier Trono) and the pLKO-control shRNA 25 (Addgene plasmid 1864 deposited by Dr. David M. Sabatini) were obtained from Addgene plasmid repository. Lentiviral supernatants for the expression of shRNAs were generated from 293FT cells using psPAX2 and pMD2G packaging and envelope vectors according to the OpenBiosystems protocol. MHM and A549 cells were infected to establish polyclonal lines.
RNA isolation and real-time quantitative PCR analysis
Total RNA was prepared using Total RNA Mini Kit (IBI Scientific, IA); the first cDNA strand was synthesized using High Capacity cDNA Reverse Transcription Kit (Applied Biosystems, CA). Manufacturers’ protocols were followed in each case. The PCR primers for ULK1, ATG3, 7, 16L1, and β-actin genes are listed in Supplemental Table. SYBR green PCR kit (Applied Biosystems) was used according to the manufacturer’s instructions. AB7300 system was used as follows: activation at 95°C; 2 minutes, 40 cycles of denaturation at 95°C; 15 seconds and annealing/extension at 60°C; 60 seconds, followed by melt analysis ramping from 60°C to 95°C. Relative gene expression was determined by the ΔΔCt method using β-Actin to normalize.
Quantification of cellular α-kg
Cellular α-KG was quantified using the α-KG Assay Kit from Sigma-Aldrich. 106 cells were collected in 100 μl of α-KG assay buffer and lysed by three rounds of freeze and thaw. The lysates were deproteinized with a 10 kDa MWCO spin filter. 50 μl of the lysates were then added to a well of a 96-well plate for reaction following the manufacturer’s instructions. The colorimetric absorbance was measured at 570 nM wavelength using a BioTekMx microplate reader. The concentration of cellular α-KG was calculated using linear regression of α-KG standards.
Quantitative analysis of autophagosomes and autolysosomes
For analysis of antophagosomes/autolysosomes, MDC sequestration was conducted as previously described 26.
Statistical analysis
One-way analysis of variance (ANOVA) and Student’s t-test were used to determine the statistical significance of differences among experimental groups. Student’s t-test was used to determine the statistical significance between control and experimental groups.
Funding Statement
This work was supported by the HHS | NIH | National Cancer Institute (NCI) [1 R21 CA185036-01A1].
Disclosure of Potential Conflicts of Interest
No potential conflicts of interest were disclosed
Supplemental Material
Supplemental data for this Article can be acessed here
References
- 1.Carvajal LA, Manfredi JJ.. Another fork in the road–life or death decisions by the tumour suppressor p53. EMBO Rep. 2013;14:414–421. doi: 10.1038/embor.2013.25. [DOI] [PMC free article] [PubMed] [Google Scholar]
- 2.Pavlova NN, Thompson CB. The emerging hallmarks of cancer metabolism. Cell Metab. 2016;23:27–47. doi: 10.1016/j.cmet.2015.12.006. [DOI] [PMC free article] [PubMed] [Google Scholar]
- 3.Bensaad K, Tsuruta A, Selak MA, Vidal MN, Nakano K, Bartrons R, Gottlieb E, Vousden KH. TIGAR, a p53-inducible regulator of glycolysis and apoptosis. Cell. 2006;126:107–120. doi: 10.1016/j.cell.2006.05.036. [DOI] [PubMed] [Google Scholar]
- 4.Matoba S, Kang JG, Patino WD, Wragg A, Boehm M, Gavrilova O, Hurley P.J, Bunz F, Hwang P.M. p53 regulates mitochondrial respiration. Science (New York, NY. 2006;312:1650–1653. doi: 10.1126/science.1126863. [DOI] [PubMed] [Google Scholar]
- 5.Zawacka-Pankau J, Grinkevich VV, Hünten S, Nikulenkov F, Gluch A, Li H, Enge M, Kel A, Selivanova G. Inhibition of glycolytic enzymes mediated by pharmacologically activated p53: targeting warburg effect to fight cancer. J Biol Chem. 2011;286:41600–41615. doi: 10.1074/jbc.M111.240812. [DOI] [PMC free article] [PubMed] [Google Scholar]
- 6.Duan L, Perez RE, Davaadelger B, Dedkova EN, Blatter LA, Maki CG. p53-regulated autophagy is controlled by glycolysis and determines cell fate. Oncotarget. 2015;6:23135–23156. [DOI] [PMC free article] [PubMed] [Google Scholar]
- 7.Li T, Kon N, Jiang L, Tan M, Ludwig T, Zhao Y, Baer R, Gu W. Tumor suppression in the absence of p53-mediated cell-cycle arrest, apoptosis, and senescence. Cell. 2012;149:1269–1283. doi: 10.1016/j.cell.2012.04.026. [DOI] [PMC free article] [PubMed] [Google Scholar]
- 8.Tovar C, Rosinski J, Filipovic Z, Higgins B, Kolinsky K, Hilton H, Zhao X., Vu B.T, Qing W, Packman K., et al. Small-molecule MDM2 antagonists reveal aberrant p53 signaling in cancer: implications for therapy. Proc Natl Acad Sci U S A. 2006;103:1888–1893. doi: 10.1073/pnas.0507493103. [DOI] [PMC free article] [PubMed] [Google Scholar]
- 9.Aziz MH, Shen H, Maki CG. Acquisition of p53 mutations in response to the non-genotoxic p53 activator Nutlin-3. Oncogene. 2011;30(46):4678–4686. doi: 10.1038/onc.2011.185. [DOI] [PMC free article] [PubMed] [Google Scholar]
- 10.Zhou Y, Perez RE, Duan L, Maki CG. DZNep represses Bcl-2 expression and modulates apoptosis sensitivity in response to Nutlin-3a. Cancer Biol Ther. 2018;19:465–474. doi: 10.1080/15384047.2018.1433500. [DOI] [PMC free article] [PubMed] [Google Scholar]
- 11.Jiang X, Overholtzer M, Thompson CB. Autophagy in cellular metabolism and cancer. J Clin Invest. 2015;125:47–54. doi: 10.1172/JCI73942. [DOI] [PMC free article] [PubMed] [Google Scholar]
- 12.White E, Mehnert JM, Chan CS. Autophagy, Metabolism, and Cancer. Clin Cancer Res. 2015;21:5037–5046. doi: 10.1158/1078-0432.CCR-15-0490. [DOI] [PMC free article] [PubMed] [Google Scholar]
- 13.Davaadelger B, Perez RE, Zhou Y, Duan L, Gitelis S, Maki CG. The IGF-1R/AKT pathway has opposing effects on Nutlin-3a-induced apoptosis. Cancer Biol Ther. 2017;18:895–903. doi: 10.1080/15384047.2017.1345397. [DOI] [PMC free article] [PubMed] [Google Scholar]
- 14.Duan L, Perez RE, Chen L, Blatter LA, Maki CG. p53 promotes AKT and SP1-dependent metabolism through the pentose phosphate pathway that inhibits apoptosis in response to Nutlin-3a. J mol cell bio. 2018;10(4):331–340. [DOI] [PMC free article] [PubMed] [Google Scholar]
- 15.Zhao J, Peng L, Cui R, Guo X, Yan M. Dimethyl α-ketoglutarate reduces CCl4-induced liver fibrosis through inhibition of autophagy in hepatic stellate cells. Biochem Biophys Res Commun. 2016;481:90–96. doi: 10.1016/j.bbrc.2016.11.010. [DOI] [PubMed] [Google Scholar]
- 16.Chin RM, Fu X, Vergnes L, Hwang H, Deng G, Diep S, Lomenick B, Meli VS, Monslave GC, et al. The metabolite alpha-ketoglutarate extends lifespan by inhibiting ATP synthase and TOR. Nature. 2014;510:397–401. doi: 10.1038/nature13264. [DOI] [PMC free article] [PubMed] [Google Scholar]
- 17.Villar VH, Merhi F, Djavaheri-Mergny M, Durán RV. Glutaminolysis and autophagy in cancer. Autophagy. 2015;11:1198–1208. doi: 10.1080/15548627.2015.1053680. [DOI] [PMC free article] [PubMed] [Google Scholar]
- 18.Munafó DB, Colombo MI. A novel assay to study autophagy: regulation of autophagosome vacuole size by amino acid deprivation. J Cell Sci. 2001;114:3619–3629. [DOI] [PubMed] [Google Scholar]
- 19.Hu W, Zhang C, Wu R, Sun Y, Levine A, Feng Z. Glutaminase 2, a novel p53 target gene regulating energy metabolism and antioxidant function. Proc Natl Acad Sci U S A. 2010;107:7455–7460. doi: 10.1073/pnas.1001006107. [DOI] [PMC free article] [PubMed] [Google Scholar]
- 20.Suzuki S, Tanaka T, Poyurovsky MV, Nagano H, Mayama T, Ohkubo S, Lokshin M, Hosokawa H, Nakayama T, Suzuki Y, et al. Phosphate-activated glutaminase (GLS2), a p53-inducible regulator of glutamine metabolism and reactive oxygen species. Proc Natl Acad Sci U S A. 201. 4;107:7461–7466. doi: 10.1073/pnas.1002459107. [DOI] [PMC free article] [PubMed] [Google Scholar]
- 21.Saxton RA, Sabatini DM. mTOR signaling in growth, metabolism, and disease. Cell. 2017;169:361–371. doi: 10.1016/j.cell.2017.03.035. [DOI] [PubMed] [Google Scholar]
- 22.Tsukada Y, Fang J, Erdjument-Bromage H, Warren ME, Borchers CH, Tempst P, Zhang Y. Histone demethylation by a family of JmjC domain-containing proteins. Nature. 2006;439:811–816. doi: 10.1038/nature04433. [DOI] [PubMed] [Google Scholar]
- 23.Teperino R, Schoonjans K, Auwerx J. Histone methyl transferases and demethylases; can they link metabolism and transcription? Cell Metab. 2010;12:321–327. doi: 10.1016/j.cmet.2010.09.004. [DOI] [PMC free article] [PubMed] [Google Scholar]
- 24.Szulc J, Wiznerowicz M, Sauvain M-O, Trono D, Aebischer P. A versatile tool for conditional gene expression and knockdown. Nat Methods. 2006;3:109–116. doi: 10.1038/nmeth846. [DOI] [PubMed] [Google Scholar]
- 25.Sarbassov DD, Guertin DA, Ali SM, Sabatini DM. Phosphorylation and regulation of Akt/PKB by the rictor-mTOR complex. Science (New York, NY. 2005;307:1098–1101. doi: 10.1126/science.1106148. [DOI] [PubMed] [Google Scholar]
- 26.Duan L, Danzer B, Levenson VV, Maki CG. Critical roles for nitric oxide and ERK in the completion of prosurvival autophagy in 4OHTAM-treated estrogen receptor-positive breast cancer cells. Cancer Lett. 2014;353:290–300. doi: 10.1016/j.canlet.2014.07.031. [DOI] [PMC free article] [PubMed] [Google Scholar]
Associated Data
This section collects any data citations, data availability statements, or supplementary materials included in this article.