

Abstract
Background:
Epigenetic modifications of a gene have been shown to play a role in maintaining a long-lasting change in gene expression. We hypothesize that alcohol’s modulating effect on DNA methylation on certain genes in blood is evident in binge and heavy alcohol drinkers and is associated with alcohol motivation.
Methods:
Methylation specific polymerase chain reaction assays were used to measure changes in gene methylation of period 2 (PER2) and proopiomelanocortin (POMC) genes in peripheral blood samples collected from nonsmoking moderate, non-binging, binge and heavy social drinkers who participated in a 3-day behavioral alcohol motivation experiment of imagery exposure to either stress, neutral or alcohol related cues, one per day, presented on consecutive days in counterbalanced order. Following imagery exposure on each day, subjects were exposed to discrete alcoholic beer cues followed by an alcohol taste test (ATT) to assess behavioral motivation. Quantitative real-time polymerase chain reaction was used to measure gene expression of PER2 and POMC genes levels in blood samples across samples.
Results:
In the sample of moderate, binge and heavy drinkers, we found increased methylation of the PER2 and POMC DNA, reduced expression of these genes in the blood samples of the binge and heavy drinkers relative to the moderate, non-binge drinkers. Increased PER2 and POMC DNA methylation was also significantly predictive of both increased levels of subjective alcohol craving immediately following imagery (p<.0001), and with presentation of the alcohol (2 beers) (p<.0001) prior to the ATT, as well as with alcohol amount consumed during the ATT (p<.003).
Conclusions:
These data establish significant association between binge or heavy levels of alcohol drinking and elevated levels of methylation and reduced levels of expression of POMC and PER2 genes. Furthermore, elevated methylation of POMC and PER2 genes is associated with greater subjective and behavioral motivation for alcohol.
Keywords: Alcoholism, Period 2, proopiomelanocortin, DNA methylation
Introduction:
Alcohol use disorders affect more than 75 million people worldwide (WHO, 2014). Alcohol abuse is one of the leading causes of death in the United States, contributing to over 3.5% of deaths annually (Mokdad et al., 2004). It is important to identify the genetic and environmental factors that contribute to alcohol use in order to target at-risk populations. The circadian system and the stress-response system are both fundamental mechanisms for adaptation to environmental change (Moore-Ede, 1986). Excessive alcohol use can lead to long-lasting circadian desynchronization with altered expression of various clock genes in laboratory animals and humans (Spanagel et al., 2005a; Spanagel et al., 2005b). It is also associated with changes in the diurnal rhythm of the hypothalamic pituitary adrenal (HPA) axis hormone (corticosteroid and adrenocorticotropic hormone (ACTH) secretion in animals and humans (Chen et al., 2004; Gianoulakis et al., 2005; Fox et al., 2007; Laudenslager et al., 2009; Sinha et al., 2009). Such changes of the HPA axis are associated with increased relapse risk in alcoholic patients (Junghanns et al., 2003; Brady et al., 2006; Sinha et al., 2011) and higher alcohol motivation and intake in binge heavy drinkers (Blaine et al., 2018).
Interestingly a mutation in the clock gene period 2 (Per 2) increases alcohol consumption, while challenges to normal circadian entrainment increase alcohol preference and consumption in rodent models (Spanagel et al., 2005b). Furthermore, a significant association of the PER2 single nucleotide polymorphism (SNP) 10870 with increased alcohol consumption was observed in adolescent boys (Comasco et al., 2010). Per2 gene mutation also alters circadian rhythms of circulating glucocorticoids (Yang et al., 2009) and hypothalamic proopiomelanocortin (POMC) mRNA levels (Agapita et al., 2010), two key regulators of the stress axis. On the other hand, glucocorticoid receptors appear to be necessary for the rhythmic expression of PER2 protein in the mesocorticolimbic region of the brain (Segall and Amir, 2010) where corticotropin releasing hormone (CRH) and POMC-derived peptide β-endorphin are known to interact to regulate dopamine release and control stress-induced alcohol-drinking behavior (Nikulina et al., 2008; Segall et al., 2009). However, no previous study has assessed whether binge and heavy alcohol use alters PER2 and POMC gene methylation levels to regulate the stress-response system and whether such alterations influence alcohol motivation in humans. Epigenetic modifications of a gene have been shown to play a role in maintaining a long-lasting change in gene expression (Govorko et al., 2012; Finegersh et al., 2015). DNA methylation occurring at CpG dinucleotides is the most common epigenetic modification that constitutes an important regulatory element in human genome. Epigenetic alterations believed to occur early in disease state, thus providing the possibility of early diagnosis. We found in our animal model of prenatal alcohol exposure Pomc expression was reduced and Pomc promoter methylation was increased in the hypothalamus (Govorko et al., 2012). It has also been shown that Pomc and Per2 gene expression levels are reduced and the corticosterone response to a stress challenge is increased in both alcohol dependent animals and in PAE animals (Chen et al., 2004; Agapito et al., 2010). Thus, here we hypothesized that there will be gene methylation and expression differences in PER2 and POMC gene in non-smoking, binge and heavy non-dependent drinkers relative to moderate, non-binging social drinkers and that group differences PER2 gene and/or POMC gene methylation related to drinking history will predict experimentally provoked increases in subjective and behavioral alcohol motivation in a 3-day experiment.
Materials and Methods:
We conducted a controlled laboratory experiment described in detail in Blaine et al., (2018) in well characterized groups of moderate (MD), binge (MB) and heavy (HD) alcohol users. Briefly, subjects were exposed to stress, neutral and alcohol cue context, using personalized guided imagery procedures as shown in previous research (Fox et al., 2007; Sinha et al., 2009; Fox et al., 2012), after which they presented with discrete alcohol cues in the form of two 12 oz beers in chilled beer mugs for an ‘alcohol taste test’, a widely used test of behavioral motivation for alcohol in the laboratory (Higgins and Marlatt, 1975; Marlatt et al., 1975; Conney et al., 1997; de Wit et al., 2003; Colby et al., 2004). Subjective craving was assessed at baseline prior to imagery, after imagery, and pre- and post- presentation of discrete alcohol cues. Subjects then participated in the alcohol taste test to assess behavioral motivation for alcohol.
Subjects:
Subjects were non-smoking social drinkers who reported “liking beer”, between the ages of 21 to 50 years, and were recruited from the community through local advertisements. The sample was a subgroup of a larger study of nonsmoking social drinkers who participated in the 3-day experiment (Blaine et al., 2018), but also provided blood samples for DNA methylation for inclusion in the current study. Subjects were admitted for a 3-day hospital stay to the Yale Hospital Research Unit at Yale-New Haven Hospital for participation in the study. During this period, they were required to stay on the unit, within a controlled environment. All subjects reported no lifetime or current history of any drug dependence (including DSM-IVTR alcohol dependence), did not meet criteria for any Axis I DSM-IV psychiatric diagnoses, and provided negative urine toxicology screens during initial appointments and at inpatient admission for laboratory sessions. The subjects were divided into 3 subgroups: heavy, binge and moderate, utilizing criteria outlined by NIAAA for binge drinking episode as well as for at-risk or hazardous drinking (NIAAA Rethinking Drinking, 2010). The moderate group included subjects who reported regular alcohol use over past year not to exceed 7 standard drinks/wk for women and 14 standard drinks/wk for men, with no occasions of binge drinking (women: 4 or more drinks/occasion; men: 5 or more drinks/occasion). The binge group included subjects who regularly used alcohol at the level of the moderate group but also reported at least one occasion of binge drinking in the past month (women: 4 or more drinks/occasion; men: 5 or more drinks/occasion). The heavy group included individuals meeting hazardous drinking levels with regular alcohol use over the past year of at least 8 standard drinks/wk for women and at least 15 standard drinks/wk for men (binge drinking allowed). Subjects provided detailed information on current drinking levels using the Cahalan Quantity Frequency Variability Index (QFVI, Cahalan, 1967) as well as the Alcohol Use Disorders Identification Test (AUDIT) (Young and Mayson, 2010).
Exclusion criteria included current nicotine users/smokers, current dependence on another psychoactive substance, current use of opiates or past history of opiate abuse/dependence; current use of any psycho- active drugs, including anxiolytics, antidepressants, naltrexone, or any psychotic disorder or current psychiatric symptoms requiring specific attention, including need for psychiatric medications for current major depression and anxiety disorders; any significant current medical condition such as neurological, cardiovascular, endocrine, renal, liver, and thyroid pathology; subjects on medications for any medical condition; women on oral contraceptives, peri- and postmenopausal women, and those with hysterectomies; and pregnant and lactating women.
All procedures involving human subjects were approved by the Yale Human Investigation Committee and are in accordance with the Helsinki declaration of 1975. All subjects provided written informed consent at the time of enrollment in the study.
Imagery script development procedures:
Before the laboratory sessions, guided imagery scripts for stress, alcohol cue and neutral relaxing states were developed. The stress imagery script was based on subjects’ description of a recent personal stressful event that was experienced as ‘most stressful’. Most stressful was determined by having the subjects rate their individual level of distress on a 10-point Likert scale where ‘1 = not at all stressful’ and ‘10 = the most stress they felt recently in their life’. Only situations rated as eight or above were accepted as appropriate for script development. Trauma-related situations and those with explicit alcohol cues were not allowed. The alcohol-related cue script was based on individual situations that included alcohol-related stimuli and resulted in subsequent alcohol use (e.g. buying alcohol and being at a bar). Alcohol-related situations that occurred in the context of negative affect or psychological distress were not allowed. A neutral script was developed from the participants’ individual experiences of commonly experienced neutral- relaxing situations, such as a fall day reading at the park.. Scripts were developed using a standardized format, based on specific stimulus and response details of each situation and then audiotaped for presentation in the laboratory sessions, as described in previous work (Sinha et al., 2009; 2011) and detailed in a standardized procedures manual (Sinha, 2009; Sinha & Tuit, 2012). Order of imagery condition and script type was randomly assigned across the 3 experimental days and counterbalanced across subjects.
Habituation and imagery training session:
One day before the laboratory sessions subjects were brought into the testing room where they were acclimatized to specific aspects of the study procedures, such as the subjective rating forms and then trained in relaxation and imagery procedures (Sinha et al., 1999).
Laboratory sessions:
On each of the three testing days, subjects had a standard healthy lunch at noon, and were brought into the testing room at 1400 hours by the research nurse. A blood pressure cuff was placed on the subject’s preferred arm to monitor blood pressure and a pulse sensor was placed on the subject’s forefinger to obtain a measure of pulse. This was followed by a 1-h adaptation period. At 1500 hours, subjects were provided headphones and the audiotape presented the instructions for the imagery procedure and the script for guided imagery for a period of 5min. After imagery, subjects remained in the testing room for an additional 75min to examine recovery from the imagery exposure and for repeated assessments of mood and alcohol craving. In addition, immediately following imagery and assessments, subjects were also presented with the “alcohol taste test” on each day, a widely used and validated procedure to experimentally assess motivation for alcohol consumption and amount of alcohol consumed following a variety of challenges (Higgins et al., 1975; Marlatt et al., 1975; Lang et al., 1980; Young and Mayson, 2010).
Alcohol Taste Test (ATT) :
After the imagery period and ratings of anxiety and craving, subjects were presented with a tray of two 12-Oz beer mugs with chilled beer and one mug marked A and the other marked B, along with a glass of water and ice. Subjective alcohol craving was assessed upon presentation of the beers. Subjects then participated in a 10 minute ATT in which they were asked to taste the beer in each of the A and B mugs to identify whether the brand and type of beer was the same or different in each mug. They were told that they could drink as much as they wished to make this determination and that they would receive $10 for each day for correct identification of whether the beers were same or different. The total amount of amount of beer consumed (A+B) on each experimental day was recorded as a measure of implicit behavioral motivation for alcohol (as described previously in Milivojevic et al., 2017 and Blaine et al., 2018).
Alcohol Craving Visual Analog Scale (VAS):
Participants were requested to rate the intensity of their desire to use alcohol at that moment using a 10-point visual analog scale (VAS) in which 0 = “not at all” and 10 = “extremely high.” Subjective measures of alcohol craving were collected repeatedly at baseline (B) prior to the experimental imagery manipulation on each condition day, immediately following stress, cue or neutral imagery exposure (I, Imagery timepoint) and 10 minutes later after the presentation of the beer glasses (discrete alcohol cue) but prior to the onset of the alcohol taste test (R1b, recovery timepoint), as well as immediately following the ATT (R2, recovery 2 timepoint) and every 15 minutes after that for 3 more assessments period over 45 minutes (R3, R4 and RX).
DNA and RNA extraction
DNA was extracted from blood samples using DNeasy blood and tissue extraction kit (Qiagen, Valencia, CA). 2ml of non-coagulated blood samples was centrifuged at 3000 rpm for 15 min, pelleted, resuspended in 100 ul of 1X PBS, and then mixed with 50ul of proteinase K. The volume was adjusted to 220ul with 1X PBS. The rest of the protocol was followed as it was described in DNeasey blood and tissue extraction kit (Qiagen, Valencia, CA). RNA was extracted from blood samples collected in PAX gene tubes using preserved Blood RNA purification kit II (Norgen Biotek, Ontario, Canada) as per instructions from manufacturer.
Quantitative Reverse transcription polymerase chain reaction (qRT-PCR)
Gene expression levels of POMC and PER2 of blood samples were measured by quantitative real time PCR SYBR green assay. Total RNA of samples about 1ug were converted to first strand complementary DNA (cDNA) using high capacity cDNA reverse transcription kit (Life technologies, Carlsbad, CA). The primer sequences for POMC, Per2 and GAPDH are listed in Table 1. RT PCR was performed at 95ᵒC for 5 min followed by 40 cycles of 95ᵒC for 15 sec, 60ᵒC for 30 sec, 72ᵒC for 40 sec in Applied Biosystems 7500 Real time PCR system (ABI Carlsbad, CA). The quantity of target gene expression was measured using a standard curve. The values are presented as the ratio of target gene and housekeeping gene Gapdh.
Table 1:
Demographic and Recent Alcohol Drinking in the Study Sample (N=47)
| Demographic/Drinking Variable | Total Sample (N=47) |
Moderate (MD: N=33) |
Binge (BD: N=6) |
Heavy (HD: N=8) |
|---|---|---|---|---|
| AGE (mean[SD]) | 27.49 (6.22) | 28 (6.56) | 26.43 (4.28) | 26.25 (6.48) |
| Gender (N/% Male) | 28 (57%) | 21 (62%) | 4 (57%) | 3 (38%) |
| Race N/% Caucasian | 37 (76%) | 27 (79%) | 5 (71%) | 5 (63%) |
| Race N/% African American | 9 (18%) | 6 (18%) | 1 (14%) | 2 (25%) |
| Race (N/% Other) | 3 (6%) | 1 (3%) | 1 (14%) | 1 (13%) |
| Years of Education (Mean[SD]) | 15.94 (1.94) | 15.82(2.05) | 15.86 (1.34) | 16.5 (2.0) |
| Shipley IQ (Mean[SD]) | 116.02 (6.29) | 115.67 (7.1) | 117.71 (1.89) | 116.0 (5.29) |
| AUDIT Total Score (Mean[SD])* | 4.98 (3.53) | 3.15 (1.37) ab | 8.4 (1.67) | 10.38 (3.54) |
| Cahalan Total Score* | 8.52 (4.23) | 6.64 (3.29) ab | 12.4 (2.19) | 13.88 (1.64) |
| Avg. Drinks/Occasion (mean N[SD])* | 2.63 (1.95) | 1.81 (0.77) ab | 3.8 (2.17) | 5.25 (2.66) |
| Drinking Days/Week (Mean Days[SD])* | 1.54 (1.15) | 1.12 (0.92) ab | 2.6 (1.34) | 2.63 (0.74) |
| Max. Drinks/Occasion (Mean Days[SD])* | 5.78 (3.42) | 4.48 (2.08) ab | 8.4 (4.16) | 9.5 (4.11) |
| Days of Max Drinks/week (Mean[SD])* | 0.18 (0.33) | 0.11 (0.19) abc | 0.12 (0.08) | 0.50 (0.62) |
| Avg. Total Drinks Weekly (Mean[SD])* | 5.04 (5.47) | 2.26 (1.93) abc | 8.38 (3.17) | 14.42 (4.98) |
Note: Demographic variables were not different between groups;
Significant main effect of drinking group for recent alcohol drinking levels using One-way ANOVAs (p’s<.0001);
MD < BD (p<.05);
MD < HD (p<.05);
BD<HD (p<.05).
Methylation specific PCR
POMC, and PER2 gene methylation analyses were performed by SYBR green qRT-PCR method of methylation specific PCR (MSP) as it was described previously (Govorko et al., 2012; Gangisetty et al., 2014), DNA extracted from blood, samples of about 2ug were bisulfite converted using EZ DNA methylation kit (Zymo Research, Orange, CA). Promoter sequences were analyzed for CpG island determination and MSP primers were designed using methyl primer sequence v1.0 program. Primer sequences specific for methylated and unmethylated DNA were listed in supplement Table 2. Human highly methylated and low methylated control DNA (Epigen DX, Worcester MA) were subjected to bisulfite conversion and were used for preparing the standard curve. qRT-PCR was performed using SYBR green master mix with specific primers and bisulfite converted DNA as template. qRT-PCR was performed using a program at 95°C for 5 min followed by 50 cycles of 95°C for 30sec, 60°C for 1min, 72°C for 1 min. Relative quantities of methylated and unmethylated DNA were measured using a standard curve and the ratio of methylated versus unmethylated DNA was determined. Relative DNA methylation level was calculated by normalizing binge and heavy alcohol group values with moderate group average values and presented in the figures and text.
DNA methylation by Pyrosequencing
DNA methylation at specific CpG site was confirmed by pyrosequencing assay. Briefly 1ug of genomic DNA was subjected to bisulfite conversion using EZ DNA methylation kit (Zymo Research, Orange, CA). Region of interest was amplified using bisulfite specific PCR (BSP) primers. Pyromark PCR kit (Qiagen, Valencia, CA) was used with forward and biotin labelled reverse primer as per the instructions from the manufacturer. Biotinylated PCR product was mixed with streptavidin beads and annealed with sequencing primer. Streptavidin bound biotinylated PCR product was captured using a vacuum filtration sample transfer device (Qiagen, Valencia, CA). Sequencing was performed using Pyromark Gold Q96 CDT reagents (Qiagen, Valencia, CA) on a PSQ HS96A model pyrosequencing machine (Qiagen, Valencia, CA) as per the instructions from the manufacturer. In the pyrosequencing study, we analyzed one control C in non CpG background for efficient C→T conversion. The percent C remaining as C in the target CpG was considered % methylation. POMC methylation was confirmed by pyrosequencing using DNA samples of all three groups. We were not able to perform pyrosequencing assay in all the samples employed in this study because many of the samples did not have enough quantity of DNA to do both MSP and pyrosequencing assays.
Data Analysis:
All data were analyzed using SAS. Group differences in demographic and drinking historywere assessed using one-way analyses of variance (ANOVA), frequency differences using chi square and t-tests for group differences. ANOVAs were used for assessing changes between PER2 and POMC gene expression and methylation and linear mixed effects models were used to assess the effects of drinking group and imagery condition on PER2 and POMC gene expression and methylation, subjective craving and alcohol intake amount, with simple effect contrasts presented in the LME models to assess source of the significant main effects and interactions. Pearson product moment correlation analysis was used to assess the association between PER2 and POMC gene expression and DNA methylation effects on alcohol craving and intake responses.
Results
Demographic information and alcohol taste test:
Demographic information on the three groups of subjects is summarized in Table 1. Moderate (MD), binge (BD) and heavy drinking (HD) subjects did not differ significantly by sex, race and age. As expected, the AUDIT score and Calahan total score was the highest in the heavy alcohol users and the scores in heavy and binge drinkers were significantly higher than those in moderate drinkers. Average drinks per occasion, frequency of drinks per week, maximum number of drinks in a drinking occasion, and the maximum number of drinks per week were significantly higher in binge and heavy alcohol users than those in moderate alcohol users. In the laboratory sessions, the binge and heavy alcohol subjects drank more than the moderate alcohol subjects during taste test in each of the test conditions, with a significant main effect of drinking group [F(2, 45) = 18.8, p=.0001], such that across all three imagery conditions, the binge (BD) and heavy (HD) drinkers consumed significantly more beer (A+B amount) during the ATT compared with the moderate (MD) social drinkers with MD<BD<HD< (p’s<.05). (Fig. 1A). No significant main effect of condition or drinking group X condition was obtained for A+B amount consumed in the ATT.
Fig. 1. Changes in alcohol consumption and craving rating in the moderate binge and heavy social drinkers during the laboratory sessions.
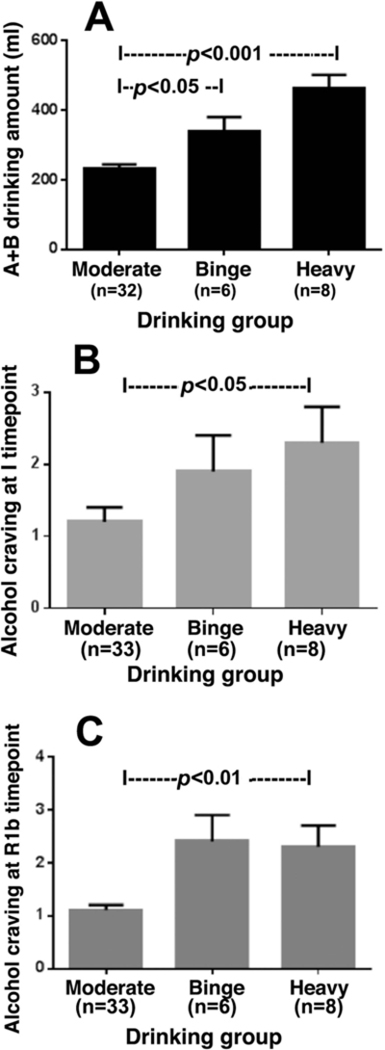
Across all three imagery provocation conditions and after presentation of the discrete alcoholic beer cue on each day, the binge and heavy social drinkers consumed significantly more beer during the alcohol taste test compared with the moderate social drinkers [F(2, 45) = 18.8, p=.0001], with moderate<binge<heavy< (p’s<.05). (Fig. A). Across all three imagery context sessions (stress, alcohol cue and neutral relaxing cue), alcohol craving ratings were significantly higher for the binge and heavy compared to the moderate social drinking groups, immediately following imagery (I) context manipulation [F(2, 45) = 9.01, p=.004; moderate<binge, p<.05; moderate<heavy, p<.01; Fig. B), and following presentation of discrete beer cues (R1b) [F(2, 45) = 11.38, p=.002; moderate<binge, p<.01; moderate<heavy, p<.01; Fig. C).
Alcohol Craving:
Across all three imagery context sessions (stress, alcohol cue and neutral relaxing cue), alcohol craving ratings were significantly higher for the binge and heavy compared to the moderate social drinking groups, immediately following imagery (I) context manipulation [drinking group main effect: F(2, 45) = 9.01, p=.004; MD<BD, p<.05; MD<HD, p<.01; Fig. 1B), and following presentation of discrete beer cues (R1b) [drinking group main effect: F(2, 45) = 11.38, p=.002; MD<BD, p<.01; MD<HD, p<.01; Fig. 1C). A main effect of imagery context for alcohol craving was also observed [F(2,45)=18.08, p<.0001], with significantly higher subjective alcohol craving reported in the stress (S), alcohol cue (AC) relative to neutral (N) condition and in the alcohol cue relative to stress condition immediately following imagery (S>N, p<.0009; AC>N, p<.0001; AC>S, p<.009), and following presentation of discrete alcohol beers and prior to the ATT (AC>N, p<.0001; AC>S, p<.0007, S=N, p=ns).
Per2 and POMC gene expression and DNA methylation differences by drinking group:
Data of PER2 and POMC mRNA expression and differences by drinking groups are shown in Fig. 2A, B. In both the binge and heavy drinking groups, decreased gene expression changes were observed relative to the moderate drinking group [PER2, Fig. 2A, drinking group main effect: F(2, 44) = 7.293, p=.001; MD<BD, p<.05; MD<HD, p<.01; POMC, Fig. 2B. drinking group main effect: F(2, 36) = 4.517, p=.01; MD<BD, p<.05; MD<HD, p<.05). As shown in Fig. 2C and D increased DNA methylation levels of PER2 [PER2, Fig. 2C, drinking group main effect: F(2, 45) = 35.17, p=.001; MD<BD, p<.001; MD<HD, p<.001] and POMC genes [ POMC, Fig. 2D, drinking group main effect: F(2, 43) = 36.45, p=.001; MD<BD, p<.001; MD<HD, p<.001] were observed in the binge and heavy drinking groups which were significantly higher than those in the moderate drinking group. The quantity of POMC DNA methylation was additionally verified by pyrosequencing of the methylated DNA within the promoter area of the gene (Fig. 2E), which shows that POMC DNA methylation of the binge and heavy drinking groups had significantly higher levels at both CpGs than those in the moderate drinking group [CpG1, drinking group main effect: F(2, 20) = 10.22, p=.001; MD<BD, p<.05; MD<HD, p<.001; CpG2, F(2, 20) = 8.13, p=.01; MD<BD, p<.01; MD<HD, p<.01]. Pyrosequencing assay for PER2 was not successful possibly because of high density of CpG residue.
Fig. 2. Changes in period 2 and proopiomelanocortin gene expression and DNA methylation in the moderate, binge and heavy social drinkers.
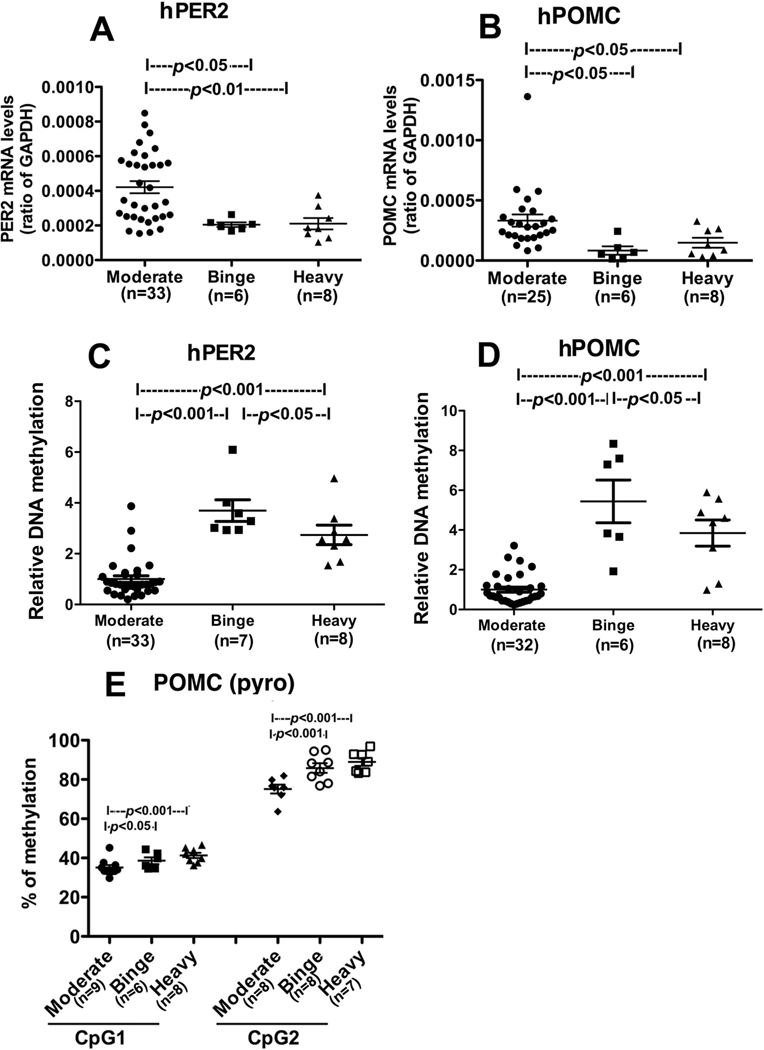
PER2 (A) and POMC gene expression (B) and PER2 (C) and POMC gene methylation (D, E) levels in each of the three drinking groups are shown. Gene expression levels were measured using quantitative reverse transcription polymerase chain reaction (qRT-PCR). Gene methylation levels were measured by methylation specific PCR (MSP) and was represented as relative DNA methylation (C & D). POMC DNA methylation was additionally verified by pyrosequencing of the methylated DNA within the promoter area of the gene (Fig. E), Pyrosequencing assay for PER2 was not successful possibly because of high density of CpG residue. Data are represented as Mean ± SEM. Number of samples in each group is shown between brackets under the group heading on the X axis or within the figures. Statistically significant differences between groups are shown by lines with p values on the top of bar graphs.
Association between Per2 and POMC gene expression and DNA methylation and alcohol craving and intake:
Finally, we tested whether PER2 and POMC gene methylation and expression levels were associated with higher subjective craving and alcohol intake in the ATT after exposure to stress and alcohol cue provocation in the laboratory experiment. Findings indicate that higher the level of hPER2 and hPOMC DNA methylation levels, greater the A+B alcohol amount consumed across conditions (PER2: r=0.42, p<.009; POMC: r=0.41, p<.005) (Fig. 3A-3B) and greater subjective alcohol craving immediately following imagery provocation (r=0.595, p<.0001) and after presentation of beer cues (r=0.588, p<.0001) across all drinking groups (Fig. 3C-3D).
Fig. 3. Correlations between the hPER2 and POMC methylation with the A+B amount of alcoholic beer intake and the level of alcohol craving in the laboratory experiment across drinking groups.
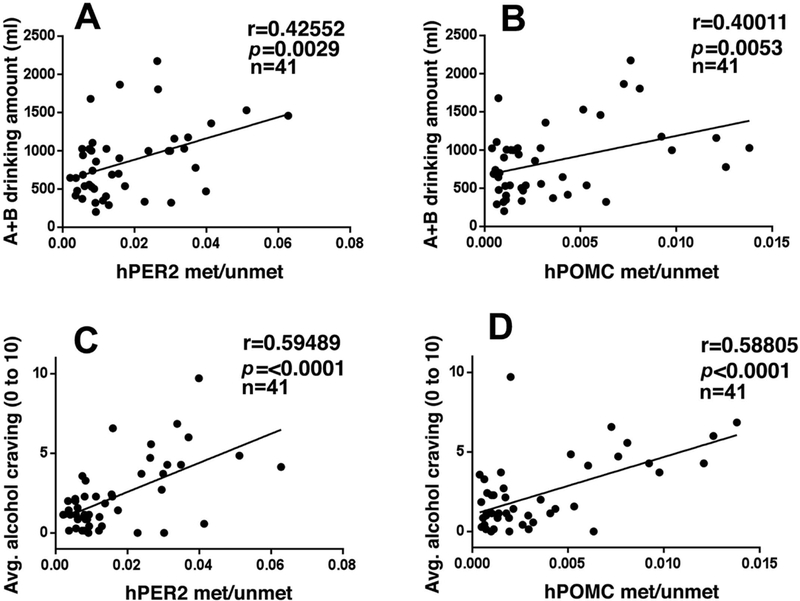
Significant positive correlation of PER2 DNA methylation (met/unmet) (A) and POMC DNA methylation with A+B alcoholic beer intake across subjects (p’s<0.01) (B). Significant positive correlation of PER2 DNA methylation (C) and POMC DNA methylation (D) with provoked alcohol craving across I and R1B timepoints prior to alcohol taste test across all subjects (p’s<0.0001).
DISCUSSION
In this study we determined the gene methylation and expression levels from whole blood in PER2 and POMC gene, two key genes of stress regulation, to identify genes that were differentially expressed in peripheral blood of non-smoking moderate/non-binge, heavy and binge socially drinking subjects. We also assessed their subjective craving and behavioral alcohol motivation (A+B alcohol amount consumed) after provocation of stress, alcohol cue and neutral relaxing contexts and presentation of discrete alcoholic beer cues prior to an alcohol taste test in a well-controlled experiment. The binge and heavy drinkers consumed significantly more beer during the ATT relative to the moderate drinkers. Overall, alcohol craving ratings were also higher for the binge and heavy compared to the moderate social drinking groups. It is important to note that the current sample came from a larger sample of social drinkers who completed the controlled experiment and thus, as expected, the craving and beer intake data are similar to our previously reported findings from the larger cohort (Blaine et al., 2018). We also found that both the binge and heavy drinking groups showed decreased expression changes of PER2 and POMC genes and increased DNA methylation of these genes relative to the moderate drinking group in peripheral blood, suggesting that heavy to binge alcohol drinking may suppress PER2 and POMC gene expression as well as increase methylation of these genes. Furthermore, increased PER2 and POMC DNA methylation was significantly associated with increased levels of subjective alcohol craving and intake in the ATT.
Circadian clock genes and their protein products form a transcriptional-translational feedback loop with a period of approximately 24 h. This molecular oscillation takes place in nearly every cell in the body and exerts control on processes ranging from metabolism to behavior. Clock genes have also been shown to affect the response to alcohol. One clock gene, PER2 has been demonstrated to alter alcohol’s reinforcing effects (Perreau-Lenz et al., 2009) and hypothalamic POMC neuronal response to ethanol (Agapito et al., 2010). Mutation of Per2 is associated with increased alcohol consumption (Spanagel et al., 2005a). Single nucleotide polymorphisms in human PER2 have been associated with variation in self-reported alcohol consumption (Spanagel et al., 2005b). These data are in agreement with the Increased PER2 DNA methylation in association with the increased levels of subjective alcohol craving and alcohol intake that we observed following stress and alcohol cue exposure in heavy and binge alcohol drinkers.
Greater alcohol intake among binge and heavy group was associated with increased POMC gene methylation. POMC is a precursor gene known to produce various peptide hormones including β-endorphin, α-melanocyte-stimulating hormone and adrenocorticotropic hormone. The POMC neuronal system plays key roles in stress regulation and reward motivation. In the CNS, POMC product β-endorphin impacts the functioning of the stress axis by inhibiting the release of corticotropin releasing factor (CRF) in the hypothalamus (Plotsky,1986; Boyadjieva et al., 2006). CRF and POMC neuronal systems play key roles in stress regulation and the reward mechanism (Heilig and Koob, 2007; Roth-Deri et al., 2008; Wynne and Sarkar, 2013). In the CNS, POMC-derived peptide β-endorphin has long been suspected of making a major contribution to the positive reinforcement and motivational properties of several addictive substances. It was demonstrated that microinjection of this peptide to several supraspinal regions of the mesolimbic reward system such as the nucleus accumbens (NAc) produced place preferences (Bals-Kubik et al., 1993). Several studies have shown that repeated administration of alcohol, cocaine, or heroin significantly attenuated β-endorphin expression in various limbic areas (Rasmussen et al., 2002; Jarjour and Gianoulakis, 2009; Sweep et al., 1988). These studies support the notion that β-endorphin may contribute significantly in the development of alcohol abuse and dependence. The CRF and it’s receptor CRF1 systems are also known to increase dopaminergic transmission in the nucleus accumbens, amygdala, and medial prefrontal cortex (Thierry et al., 1975; Rouge-Pont et al., 1993; Inglis and Moghaddam, 1993; Lovenberg et al., 1995). Furthermore, elevation of plasma corticosterone has been associated with increases in alcohol self-administration (Dunn, 1988; Fahlke et al., 1995).
A well characterized experimental approach that utilized individualized imagery to provoke stress, alcohol cues and neutral relaxing contexts along with assessing the effects of discrete alcohol cues (i.e., two beers presented prior to consumption in the ATT) on alcohol craving and intake was implemented as described in previous work (Sinha et al., 2009; 2011; Beech et al., 2014; Milivojevic et al., 2017; Blaine et al., 2018). Consistent with this previous work, binge and heavy alcohol users reported greater alcohol craving and ATT intake relative to moderate drinkers across all three conditions consistent with the notion of higher incentive sensitization among those with greater drinking history (Robinson & Berridge, 2000; Sinha, 2013). However, no significant group X condition effect was observed in the current study, perhaps because although different stress, alcohol cue or neutral contexts were presented on each day of the experiment, the same discrete alcoholic beer tray was presented following imagery on each day and each day included the alcohol taste test as a measure of behavioral motivation. Furthermore, the current sample is limited by including a larger group of moderate non-binging alcohol users and smaller numbers of binge and heavy alcohol users, which may have limited our ability to detect greater craving and alcohol motivation in stress and cue contexts among the binge and heavy users as shown previously (Blaine et al., 2018). Due to the small numbers of women were included in the sample, we were unable to evaluate sex differences in the findings and this needs further assessment in future studies. Also, while the current experimental paradigm assess behavioral motivation for alcohol using the ATT in a controlled setting, whether the hypermethylation of PER2 and POMC in binge and heavy users is predictive of real world drinking levels remains unknown. Another limitation of this study is the use of whole blood as the source of total DNA and RNA. It is possible that changes in DNA methylation and RNA expression involving specific cell-types or blood compartments may have occurred, but were not detected in the current experiments due to dilution by DNA and RNA from other blood compartments. Also, DNA methylation changes associate with alcohol drinking might be cell type – specific and methylation patterns in blood and brain may be different.
Therefore, while DNA methylation and gene expression in blood can be used as biomarkers of alcohol use disorder (AUD) development and progression, these molecular changes do not necessarily reflect changes in brain. Nonetheless, the current findings provide an initial positive signal of altered DNA methylation changes related to binge and heavy alcohol use that may be further developed as a predictive biomarker of alcoholism risk.
Supplementary Material
Acknowledgments
This work was supported by National Institutes of Health Grants U24 AA014811, 5R37 AA08757 and R01-AA013892. All authors reported no financial interests or potential conflicts of interest.
References
- Agapito M, Mian N, Boyadjieva NI, Sarkar DK (2010) Period 2 gene deletion abolishes beta-endorphin neuronal response to ethanol. Alcohol Clin Exp Res 34:1613–1618. [DOI] [PMC free article] [PubMed] [Google Scholar]
- Bals-Kubik R, Ableitner A, Herz A, Shippenberg TS (1993) Neuroanatomical sites mediating the motivational effects of opioids as mapped by the conditioned place preference paradigm in rats. J Pharmacol Exp Ther 264:489–495. [PubMed] [Google Scholar]
- Beech RD, Leffert JJ, Lin A, Hong KA, Hansen J, Umlauf S, Mane S, Zhao H, Sinha R (2014) Stress-related alcohol consumption in heavy drinkers correlates with expression of miR-10a, miR-21, and components of the TAR-RNA-binding protein-associated complex. Alcohol Clin Exp Res 38:2743–2753. [DOI] [PMC free article] [PubMed] [Google Scholar]
- Blaine SK, Nautiyal N, Hart R, Guarnaccia JB, Sinha R. (2018). Craving, cortisol and behavioral alcohol motivation responses to stress and alcohol cue contexts and discrete cues in binge and non-binge drinkers. Addict Biol. August 9. [DOI] [PMC free article] [PubMed] [Google Scholar]
- Boyadjieva N, Advis JP, Sarkar DK (2006) Role of beta-endorphin, corticotropin-releasing hormone, and autonomic nervous system in mediation of the effect of chronic ethanol on natural killer cell cytolytic activity. Alcohol Clin Exp Res 30:1761–1767. [DOI] [PubMed] [Google Scholar]
- Brady KT, Waldrop AE, McRae AL, Back SE, Saladin ME, Upadhyaya HP, Anton RF, Randall PK (2006) The impact of alcohol dependence and posttraumatic stress disorder on cold pressor task response. J Stud Alcohol. 67:700–706. [DOI] [PubMed] [Google Scholar]
- Chen CP, Kuhn P, Advis JP, Sarkar DK (2004) Chronic ethanol consumption impairs the circadian rhythm of proopiomelanocortin and period genes mRNA expression in the hypothalamus of the male rat. Journal of Neurochemistry 88:1547–1554. [DOI] [PubMed] [Google Scholar]
- Colby SM, Lee CS, Lewis-Esquerre J, Esposito-Smythers C, Monti PM (2004) Adolescent alcohol misuse: methodological issues for enhancing treatment research. Addiction 99 Suppl 2: 47–62. [DOI] [PubMed] [Google Scholar]
- Comasco E, Nordquist N, Göktürk C, Aslund C, Hallman J, Oreland L, Nilsson KW (2010) The clock gene PER2 and sleep problems: association with alcohol consumption among Swedish adolescents. Ups J Med Sci 115:41–48. [DOI] [PMC free article] [PubMed] [Google Scholar]
- Cooney NL, Litt MD, Morse PA, Bauer LO, Gaupp L (1997) Alcohol cue reactivity, negative-mood reactivity, and relapse in treated alcoholic men. J Abnorm Psychol 106:243–250. [DOI] [PubMed] [Google Scholar]
- de Wit H, Söderpalm AH, Nikolayev L, Young E (2003) Effects of acute social stress on alcohol consumption in healthy subjects. Alcohol Clin Exp Res 27:1270–1277. [DOI] [PubMed] [Google Scholar]
- Dunn A (1988) Stress related activation of cerebral dopaminergic systems. Annals of the New York Academy of Sciences, pp 188–205. [DOI] [PubMed] [Google Scholar]
- Fahlke C, Hård E, Eriksson CJ, Engel JA, Hansen S (1995) Consequence of long-term exposure to corticosterone or dexamethasone on ethanol consumption in the adrenalectomized rat, and the effect of type I and type II corticosteroid receptor antagonists. Psychopharmacology (Berl) 117:216–224. [DOI] [PubMed] [Google Scholar]
- Fahlke C, Hård E, Thomasson R, Engel JA, Hansen S (1994) Metyrapone-induced suppression of corticosterone synthesis reduces ethanol consumption in high-preferring rats. Pharmacol Biochem Behav 48:977–981. [DOI] [PubMed] [Google Scholar]
- Finegersh A, Rompala GR, Martin DI, Homanics GE (2015) Drinking beyond a lifetime: New and emerging insights into paternal alcohol exposure on subsequent generations. Alcohol. 49:461–470. [DOI] [PMC free article] [PubMed] [Google Scholar]
- Fox HC, Bergquist KL, Hong KI, Sinha R (2007) Stress-induced and alcohol cue-induced craving in recently abstinent alcohol-dependent individuals. Alcohol Clin Exp. Res 31:395–403. [DOI] [PubMed] [Google Scholar]
- Fox HC, Anderson GM, Tuit K, Hansen J, Kimmerling A, Siedlarz KM, Morgan PT, Sinha R (2012) Prazosin effects on stress- and cue-induced craving and stress response in alcohol-dependent individuals: preliminary findings. Alcohol Clin Exp Res 36: 351–360. [DOI] [PMC free article] [PubMed] [Google Scholar]
- Gangisetty O, Bekdash R, Maglakelidze G, Sarkar DK (2014) Fetal alcohol exposure alters proopiomelanocortin gene expression and hypothalamic-pituitary-adrenal axis function via increasing MeCP2 expression in the hypothalamus. PLoS One 9:e113228. [DOI] [PMC free article] [PubMed] [Google Scholar]
- Gianoulakis C, Dai X, Thavundayil J, Brown T (2005) Levels and circadian rhythmicity of plasma ACTH, cortisol, and beta-endorphin as a function of family history of alcoholism. Psychopharmacology (Berl) 181:437–44. [DOI] [PubMed] [Google Scholar]
- Govorko D, Bekdash RA, Zhang C, Sarkar DK (2012) Male germline transmits fetal alcohol adverse effect on hypothalamic proopiomelanocortin gene across generations. Biol Psychiatry 72:378–88. [DOI] [PMC free article] [PubMed] [Google Scholar]
- Heilig M, Koob GF (2007) A key role for corticotropin-releasing factor in alcohol dependence. Trends Neurosci. 30:399–406. [DOI] [PMC free article] [PubMed] [Google Scholar]
- Higgins RL, Marlatt GA (1975) Fear of interpersonal evaluation as a determinant of alcohol consumption in male social drinkers. J Abnorm Psychol 84:644–651. [DOI] [PubMed] [Google Scholar]
- Inglis F, Moghaddam B (1993) Dopamine innervation of the amygdala is highly responsive to stress. Neurochemistry 72:1088–1094. [DOI] [PubMed] [Google Scholar]
- Jarjour S, Bai L, Gianoulakis C (2009) Effect of acute ethanol administration on the release of opioid peptides from the midbrain including the ventral tegmental area. Alcohol Clin Exp Res 33:1033–1043. [DOI] [PubMed] [Google Scholar]
- Junghanns K, Backhaus J, Tietz U, Lange W, Bernzen J, Wetterling T, Rink L, Driessen M (2003) Impaired serum cortisol stress response is a predictor of early relapse. Alcohol Alcohol 38:189–193. [DOI] [PubMed] [Google Scholar]
- Lang AR, Searles J, Lauerman R, Adesso V (1980) Expectancy, alcohol, and sex guilt as determinants of interest in and reaction to sexual stimuli. J Abnorm Psychol 89:644–653. [DOI] [PubMed] [Google Scholar]
- Laudenslager ML, Noonan C, Jacobsen C, Goldberg J, Buchwald D, Bremner JD, Vaccarino V, Manson SM (2009) Salivary cortisol among American Indians with and without posttraumatic stress disorder (PTSD): gender and alcohol influences. Brain Behav Immun 23:658–662. [DOI] [PMC free article] [PubMed] [Google Scholar]
- Lovenberg TW, Chalmers DT, Liu C, De Souza EB (1995) CRF and CRF1receptor mRNAs are differentially distributed between the rat central nervous system and peripheral tissues, Endocrinology 136:4139–4142. [DOI] [PubMed] [Google Scholar]
- Marlatt GA, Kosturn CF, Lang AR (1975) Provocation to anger and opportunity for retaliation as determinants of alcohol consumption in social drinkers. J Abnorm Psychol 84:652–659. [PubMed] [Google Scholar]
- Milivojevic V, Ansell E, Simpson C, Siedlarz KM, Sinha R, Fox HC. (2017) Peripheral Immune System Adaptations and Motivation for Alcohol in Non-Dependent Problem Drinkers. Alcohol Clin Exp Res. March;41(3):585–595. [DOI] [PMC free article] [PubMed] [Google Scholar]
- Mokdad AH, Marks JS, Stroup DF, Gerberding JL (2004) Actual causes of death in the United States, 2000. JAMA 291:1238–1245 [DOI] [PubMed] [Google Scholar]
- Moore-Ede MC (1986) Physiology of the circadian timing system: predictive versus reactive homeostasis. Am J Physiol 250(5 Pt 2):R737–752. [DOI] [PubMed] [Google Scholar]
- Nikulina EM, Arrillaga-Romany I, Miczek KA, Hammer RP Jr (2008) Long-lasting alteration in mesocorticolimbic structures after repeated social defeat stress in rats: time course of mu-opioid receptor mRNA and FosB/DeltaFosB immunoreactivity. Eur J Neurosci. 27:2272–2284. [DOI] [PMC free article] [PubMed] [Google Scholar]
- National Institute of Alcohol Abuse and Alcoholism (2010). Rethinking Drinking: alcohol and Your Health, NIH Publication No:15–3770; Bethesda, MD [Google Scholar]
- Perreau-Lenz S, Zghoul T, de Fonseca FR, Spanagel R, Bilbao A (2009) Circadian regulation of central ethanol sensitivity by the mPer2 gene. Addict Biol 14:253–259. [DOI] [PubMed] [Google Scholar]
- Plotsky PM (1986) Opioid inhibition of immunoreactive corticotropin-releasing factor secretion into the hypophysial-portal circulation of rats. Regul Pept 16:235–242. [DOI] [PubMed] [Google Scholar]
- Rasmussen DD, Boldt BM, Wilkinson CW, Mitton DR (2002) Chronic daily ethanol and withdrawal: 3. Forebrain pro-opiomelanocortin gene expression and implications for dependence, relapse, and deprivation effect. Alcohol Clin Exp Res 26:535–546. [PubMed] [Google Scholar]
- Robinson TE, Berridge KC (2000) The psychology and neurobiology of addiction: an incentive–sensitization view. Addiction 95:91–117. [DOI] [PubMed] [Google Scholar]
- Roth-Deri I, Green-Sadan T, Yadid G (2008) Beta-endorphin and drug-induced reward and reinforcement. Prog Neurobiol 86:1–21. [DOI] [PubMed] [Google Scholar]
- Rouge-Pont F, Piazza P, Kharouby M (1993) Higher and longer stress-induced increase in dopamine concentrations in the nucleus accumbens of animals predisposes to amphetamine self-administration: a microdialysis study. Brain Research 602:169–174. [DOI] [PubMed] [Google Scholar]
- Segall LA, Amir S (2010) Exogenous Corticosterone Induces the Expression of the Clock Protein, PERIOD2, in the Oval Nucleus of the Bed Nucleus of the Stria Terminalis and the Central Nucleus of the Amygdala of Adrenalectomized and Intact Rats. J Mol Neurosci 42:176–182. [DOI] [PubMed] [Google Scholar]
- Segall LA, Milet A, Tronche F, Amir S (2009) Brain glucocorticoid receptors are necessary for the rhythmic expression of the clock protein, PERIOD2, in the central extended amygdala in mice. Neurosci Lett 457:58–60. [DOI] [PubMed] [Google Scholar]
- Sinha R (2008) Chronic stress, drug use, and vulnerability to addiction. Ann N Y Acad Sci 1141:105–130. [DOI] [PMC free article] [PubMed] [Google Scholar]
- Sinha R (2009). Modeling stress and drug craving in the laboratory: Implications for addiction treatment development. Addiction Biology, 14:84–98. [DOI] [PMC free article] [PubMed] [Google Scholar]
- Sinha R, Sinha R, Talih M, Malison R, Cooney N, Anderson GM, Kreek MJ (2003) Hypothalamic-pituitary-adrenal axis and sympatho-adreno-medullary responses during stress-induced and drug cue-induced cocaine craving states. Psychopharmacology (Berl) 170:62–72. [DOI] [PubMed] [Google Scholar]
- Sinha R, Fox HC, Hong KI, Hansen J, Tuit K, Kreek MJ (2011) Effects of adrenal sensitivity, stress- and cue-induced craving, and anxiety on subsequent alcohol relapse and treatment outcomes. Arch Gen Psychiatry 68:942–952. [DOI] [PMC free article] [PubMed] [Google Scholar]
- Sinha R, Fox HC, Hong KA, Bergquist K, Bhagwagar Z, Siedlarz KM (2009) Enhanced negative emotion and alcohol craving, and altered physiological responses following stress and cue exposure in alcohol dependent individuals. Neuropsychopharmacology 34:1198–1208. [DOI] [PMC free article] [PubMed] [Google Scholar]
- Sinha R, Fuse T, Aubin LR, O’Malley SS (2000) Psychological stress, drug-related cues and cocaine craving. Psychopharmacology (Berl) 152:140–148. [DOI] [PubMed] [Google Scholar]
- Sinha R, Krishnan-Sarin S, Farren C, O’Malley S (1999) Naturalistic follow-up of drinking behavior following participation in an alcohol administration study. J Subst Abuse Treat 17: 159–162. [DOI] [PubMed] [Google Scholar]
- Sinha R, Tuit K (2012) Imagery Script Development Procedures Manual. CreateSpace Independent Publishing. [Google Scholar]
- Sinha R (2013). The clinical neurobiology of drug craving. Curr Opin Neurobiol. August;23(4):649–54. [DOI] [PMC free article] [PubMed] [Google Scholar]
- Spanagel R, Pendyala G, Abarca C, Zghoul T, Sanchis-Segura C, Magnone MC, Lascorz J, Depner M, Holzberg D, Soyka M, Schreiber S, Matsude F, Lanthrop M, Schuman G, Albrecht U (2005a) The clock gene Per2 influences the glutamatergic system and modulates alcohol consumption. Nat Med 11:35–42. [DOI] [PubMed] [Google Scholar]
- Spanagel R, Rosenwasser AM, Schumann G, Sarkar DK (2005b) Alcohol consumption and the body’s biological clock. Alcohol Clin Exp Res 29:1550–1557. [DOI] [PubMed] [Google Scholar]
- Sweep CG, Van Ree JM, Wiegant VM (1988) Characterization of beta-endorphin-immunoreactivity in limbic brain structures of rats self-administering heroin or cocaine. Neuropeptides 12:229–236. [DOI] [PubMed] [Google Scholar]
- Thierry AM, Tassin JP, Blanc G, Glowinski J (1976) Selective activation of mesocortical DA system by stress. Nature 263:242–244. [DOI] [PubMed] [Google Scholar]
- World Health Organization (2004) WHO Global Status Report on Alcohol 2004. World Health Organization, Department of Mental Health and Substance Abuse, Geneva: Available at: http://www.faslink.org/WHO_global_alcohol_status_report_2004.pdf [Google Scholar]
- Wynne O, Sarkar DK (2013) Stress and neuroendocrine-immune interaction: a therapeutic role for β-endorphin in Handbook of Psychoneuroimmunology (Kusnecov A and Anisman H eds), pp 198–211. Wiley Blackwell, Oxford, UK. [Google Scholar]
- Yang S, Liu A, Weidenhammer A, Cooksey RC, McClain D, Kim MK, Aguilera G, Abel ED, Chung JH (2009) The role of mPer2 clock gene in glucocorticoid and feeding rhythms. Endocrinology 150:2153–2160. [DOI] [PMC free article] [PubMed] [Google Scholar]
- Young C, Mayson T (2010) The Alcohol Use Disorders Identification Scale (AUDIT) normative scores for a multiracial sample of Rhodes University residence students. J. Child Adolesc Ment Health 22:15–23. [DOI] [PubMed] [Google Scholar]
Associated Data
This section collects any data citations, data availability statements, or supplementary materials included in this article.