Abstract
Static stretching increases flexibility but can decrease muscle strength; therefore, a method that would avoid the latter has been longed for. In this study, a novel stretching modality was developed that provides repetitive small length changes to the plantar flexor muscles undergoing passive static stretching (minute oscillation stretching). We investigated the effects of minute oscillation stretching on muscle strength and flexibility and its continuance. Isometric plantar flexion strength and maximal ankle joint dorsiflexion angle (dorsiflexion range of motion) were measured in 10 healthy young men (22 ± 2 years) before (pre) and immediately after (post) 3 types of stretching: static stretching, minute oscillation stretching at 15 Hz, and no intervention (control). The dorsiflexion range of motion was also measured at 15, 30, and 60 min post-stretching. Elongation of the medial gastrocnemius and Achilles tendon was determined by ultrasonography. Plantar flexion strength significantly decreased by 4.3 ± 3.5% in static stretching but not in minute oscillation stretching. The dorsiflexion range of motion significantly increased both in static stretching (7.2 ± 8.1%) and minute oscillation stretching (11.2 ± 14.6%), which was accompanied by a significantly larger muscle elongation but not tendon elongation. Elevated dorsiflexion range of motion was maintained until 30 min after minute oscillation stretching, while levels returned to baseline (pre-intervention) 15 min after static stretching. All variables remained unchanged in the control condition. In conclusion, minute oscillation stretching improves extensibility of the muscle belly without decreasing strength. Furthermore, the augmented flexibility to a similar extent to static stretching is retained for 30 min in minute oscillation stretching and within 15 min in static stretching.
Key points.
Minute oscillation stretching (MOS) improved extensibility of the muscle belly with the increased flexibility being retained longer than in case of static stretching, and it did not reduce strength.
MOS can accommodate the positive effects of static stretching and dynamic stretching.
The present study only included young healthy male subjects; it remains unknown whether the findings of the current study are applicable to different populations (e.g. females and the elderly).
Key words: Oscillation, joint range of motion, muscle and tendon elongation, flexibility, ultrasonography, acute effect
Introduction
Modalities to improve flexibility (joint range of motion) are divided into static stretching (SS) in which muscles are stretched while holding the joint at a fixed angle, and dynamic stretching (DS) where muscles experience dynamic stretch–shortening within the maximal range of motion (Alter, 2004). Although flexibility can be significantly improved after static stretching, muscle strength and function are often attenuated over 60 seconds per muscle group (Herda et al., 2008; Ryan et al., 2008; Sekir et al., 2010; Mizuno et al., 2013; Behm et al., 2016). The latter outcome has been attributed to the reduction of the neural drive (Fowles et al., 2000; Kay and Blazevich, 2009; Trajano et al., 2017) and a decrease in muscle-tendon unit (MTU) stiffness (Fowles et al., 2000; Morse et al., 2008; Ryan et al., 2008). In contrast, DS generally has a lesser effect on flexibility than static stretching, but it does not attenuate muscle functions (Yamaguchi and Ishii, 2005; Bacurau et al., 2009; Sekir et al., 2010). Possible factors involved in DS include shortening of active muscle contraction induced by DS, which might contribute to muscle functions not being attenuated after DS. This can be due to a retained neural drive and/or a negligible change in MTU stiffness after DS (Sekir et al., 2010; Mizuno and Umemura, 2016).
The DS performs dynamic stretch–shortening of the MTU within the maximal range of motion due to active muscle contraction. Thus, in addition to active muscle contraction, dynamic stretch–shortening of the MTU is also considered as a factor of DS that affects the MTU. Previous animal (Mutungi and Ranatunga, 1998) as well as human (McNair et al., 2001; Avela et al., 2004; Yeh et al., 2007) studies have shown a decrease in MTU or muscle stiffness that underwent repetitive and passive stretch–shortening cycles. In these previous studies, to undergo repetitive and passive stretch–shortening of the plantar flexors, the ankle joint was dorsi-flexed in a large range from the anatomical position or plantar flexion of 20° to around the maximum dorsiflexion range of motion (DFROM) angle (McNair et al., 2001; Yeh et al., 2007). A previous study has reported that MTU stiffness decreases, even if such modalities are performed in a small range of joint movement (the anatomical position to 10° of dorsiflexion) (Avela et al., 2004). Thus, a modality that conditions the MTU by SS combined with dynamic length changes of the plantar flexors by a small range of repetitive and passive plantar- and dorsi-flexion of the ankle joint (likely passive DS) will be effective in improving muscle stiffness while retaining muscle functions. To the best of our knowledge, no study has examined such a stretching maneuver.
In the present study we developed a novel stretching technique which employs the features of DS (in the form of oscillation) added onto SS, allowing for the advantages of both SS and DS. We named this technique minute oscillation stretching (MOS). The present concept of MOS involves giving a large amplitude oscillation (15 mm; ankle joint angle change of approximately 5°) to the forefoot so that the major plantar flexors undergo a longitudinal length change, thereby applying repetitive small length changes to the MTU, like DS, under passive stretching.
The altered flexibility is reported to continue for 10-120 min (Fowles et al., 2000; Power et al., 2004; Ryan et al., 2008; Sekir et al., 2010; Mizuno et al., 2013; Taniguchi et al., 2015) after SS, and at least 10 min after DS (Mizuno and Umemura, 2016). A combination of these interventions may further elongate their after effects, but this idea has not yet been tested.
In the present study, we investigated the MTU of the lower leg for the purpose of verifying the effects of MOS on muscle strength, flexibility, and continuance of altered flexibility. It was hypothesized that MOS would not decrease muscle strength but maintain improvements and flexibility, similar to SS.
Methods
Experimental design and procedures
The present study aimed to clarify the effects of MOS on muscle strength, flexibility, and continuance of altered flexibility, compared to SS. The right ankle joint was tested in all participants under the following 3 conditions: SS intervention, MOS intervention, and no stretching (control). The participants were tested under these conditions in a random order, with an interval of 3 days or longer, after measuring maximal voluntary plantar flexion torque, to determine the basis for DFROM measurements as described later. The following dependent variables were evaluated before and immediately after intervention: isometric maximal voluntary plantar flexion torque, DFROM, and muscle and tendon elongation during DFROM measurements. DFROM was also measured after SS and MOS interventions (Post), and at 15 min (Post 15), 30 min (Post 30), and 60 min (Post 60) post-stretching to examine the continuance of altered flexibility.
Subjects
The participants were 10 recreationally active men without apparent neurological, orthopedic, or neuromuscular problems in their lower legs (age, 22 ± 2 years; body height, 1.70 ± 0.06 m; body weight, 64.3 ± 8.9 kg; mean ± standard deviation [SD]). They all participated in sports activities (ball games [n = 5], running [n = 3], kenjutsu [n = 1], and archery [n = 1]) at least once per week. The details and purpose of this study as well as the benefits and risks associated with participating were explained to each participant in advance, and written consent was obtained thereafter. This study was approved by the Ethics Review Committee on Human Research of Waseda University and performed in accordance with the Declaration of Helsinki.
Measurements of maximal voluntary muscle strength
Isometric maximal voluntary plantar flexion torque was measured using an isokinetic dynamometer (VTF-002, VINE, Japan), with the knee fully extended in a sitting position, and the ankle secured to the foot plate of the dynamometer at 0° (anatomical position). The signal obtained from the dynamometer was amplified (DPM-711B, Kyowa, Japan), then digitally converted to 1 kHz through an A/D converter (PowerLab/16SP, ADInstruments, Australia), connected to a personal computer (FMV Lifebook, Fujitsu, Japan) and recorded using appropriate software (LabChart ver.7, ADInstruments, Australia). Before measurements were taken, the participants were instructed to warm-up, producing force below the maximal strength (80% of maximal effort), twice. After at least a 1 min rest, participants performed 2 maximal voluntary plantar flexion torque exertions with a 1 min rest between trials. The peak torque was analyzed per measurement, and the third measurement was performed when the values differed by 5% in 2 of the measurements. The higher value of the 2 measurements was taken as the maximal voluntary plantar flexion torque. Maximal voluntary plantar flexion torque was measured before and immediately after the intervention.
Measurement of dorsiflexion range of motion
Flexibility was measured as DFROM using the same isokinetic dynamometer used for measuring maximal voluntary plantar flexion torque (Figure 1). The ankle joint was dorsiflexed at 5°/s starting from 30° of plantar flexion, until the passive resistive torque corresponding to 20% of the pre-measured maximal voluntary plantar flexion torque was reached. The participants were instructed to relax during the measurements without resisting the passive dorsiflexion. The right foot region including the distal part of the lower leg was videotaped (Exilim, Casio, Japan) at 30 Hz to obtain the joint angle. For this purpose, reflective markers were attached onto the following four landmarks: the upper and lower side of the foot plate, the medial malleolus, and the tibia (the middle point of the line between the estimated center of the knee joint and the medial malleolus). In the recorded image, the two-dimensional coordinates of those markers were obtained using appropriate software (FrameDIAS4, DKH, Japan). The angle between the vectors parallel to the foot plate and the line from the medial malleolus to the tibia was defined as the ankle joint angle, being 0° at the neutral position and positive values for dorsiflexion. The video was synchronized with other data using a synchronizer (PH-100, DKH, Japan). The measurement was repeated twice, and the higher value was adopted.
Figure 1.
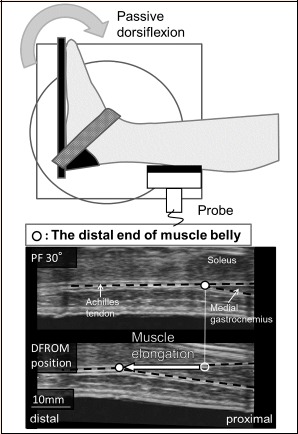
Illustration of DFROM measurements and muscle lengthening (PF: plantar flexion)
Measurement of muscle and tendon elongations
During pre- and post-intervention DFROM measurements, the proximo-distal movement of the distal end of the muscle belly of the medial gastrocnemius was recorded using ultrasonic apparatus (SSD-6500, ALOKA, Japan, connected to a video recorder GV-HD700, SONY, Japan operating at 30 Hz) to represent muscle elongation (Kawakami et al., 2008) (Figure 1). The ultrasonic probe (frequency: 7.5 MHz; scan width: 60 mm; UST-5712, Hitachi Aloka Medical, Japan) with a water bag (MP-2468, Hitachi Aloka Medical, Japan) was fixed onto the skin with double-sided adhesive tape above the distal end of the muscle belly of the medial gastrocnemius. When fixing the ultrasonic probe onto the skin, a custom-made device was used. A series of Velcro straps were affixed to the Styrofoam template to firmly secure the ultrasound probe during DFROM measurement. The videotaped ultrasound images were later analyzed using appropriate software (FrameDIAS4, DKH, Japan) to measure the muscle elongation from 30° of plantar flexion up to DFROM.
The changes in the length of the medial gastrocnemius–Achilles tendon MTU from 30° of plantar flexion to DFROM were estimated using the following formula (Grieve et al., 1978):
| MTU length change (mm) = (-22.18468 + 0.30141 × (90 - AJA) - 0.00061 × (90 - KJA)2 + 6.46251) × L/100 |
(AJA: ankle joint angle (90° = anatomical position), KJA: knee joint angle (0° = full extension position), L: lower leg length (linear distance [mm] from the popliteal fossa to the lateral malleolus of the ankle joint)
The difference between the change in MTU length and muscle elongation was defined as tendon elongation (Kawakami et al., 2008). The analysis was repeated twice per measurement, and the mean value was adopted. The coefficient of variation of muscle elongation was 0.9% in 2 measurements on the same participant. It was not possible to acquire ultrasound images for 1 participant due to unforeseen machine trouble.
Stretching protocol
For both SS and MOS, an isokinetic dynamometer (CON-TREX, CMV-AG, Switzerland) with a DS device (Kenko-yusuri JM-25, TOPRUN, Japan) mounted on the foot plate, was used. The posture of the participants was the same as that for the DFROM measurement. Based on a previous study (Babault et al., 2010), a total stretching duration of 15 min was selected for SS and MOS (15 sets of 1 min stretching, with an interval of 30 sec). The dorsiflexion angle for SS was set as the same angle as in the maximal joint angle during DFROM (subjective of stretching intensity: moderate stretch feeling to a subtle pain sensation) measurements pre- intervention. For MOS, a DS device was used for plantar- and dorsi-flexion of the ankle joint by approximately 5° (Figure 2) at 15 Hz for 1 min, and for 2.5° of plantarflexion from the same position as in SS (in order to make the center ankle joint angle in MOS equal to that in SS). The MOS frequency of 15 Hz was selected in order to reduce discomfort and pain caused by the sole of the forefoot hitting the device, as observed in higher oscillation frequencies in a preliminary experiment. The ankle joint angle was positioned at 0° during the interval between sets of MOS. In the control, participants were instructed to sit at rest on the dynamometer for approximately 25 min, while keeping the right knee and ankle joints lightly flexed and plantar flexed to avoid stretching of the plantar flexors.
Figure 2.
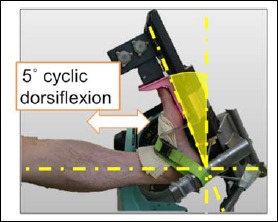
A picture showing the implementation of minute oscillation stretching.
Statistical analyses
All data are presented as means ± SD. For the values of maximal voluntary plantar flexion torque, DFROM, and muscle and tendon elongations pre and post intervention, two-way repeated measures analysis of variance (ANOVA) was performed on the stretching conditions (control, SS, and MOS) × time (pre and immediately post) (SPSS 12.0J, SPSS Japan, Japan). When an interaction or a main effect for time was observed, a paired t-test was performed for each condition. The time course changes in flexibility were compared for each condition. The relative changes in maximal voluntary plantar flexion torque, DFROM, and muscle and tendon elongations before and immediately after intervention were examined for statistical differences using one-way repeated measures ANOVA. When the F value was significant, a Tukey multiple comparison test was performed. For SS and MOS conditions, DFROM values at Post, Post 15, Post 30, and Post 60 were normalized to the pre-measurement values. A two-way repeated ANOVA was performed for the stretching conditions (SS and MOS) × time (Post, Post 15, Post 30, and Post 60). When a significant interaction or a main effect for time was observed, a one-way repeated measures ANOVA with least significant difference (LSD) post-hoc test was performed for each condition. There were no significant differences among values in the three conditions for all parameters at pre-intervention identified by one-way repeated measures ANOVA. As a result of priori statistical power analyses (using G*power 3), it was determined that 9 participants for each of three conditions were required for this particular study deign (repeated measures analysis of variance [ANOVA] within factors; effect size: 0.4, power: 0.8; alpha level: 0.05 [Cohen, 1988]). The effect size (d) was calculated by dividing the difference between the average pre-measurement value and the average post-measurement value by the standard deviation of the pre-measurement value. The effect size was defined as follows: 0.20-0.50 small effect, 0.50-0.80 medium effect, 0.80< large effect (Cohen, 1988). The level of statistical significance was set at p < 0.05.
Results
A significant interaction between the conditions and time was observed in maximal voluntary plantar flexion torque, significantly decreasing after SS intervention (d = -0.26), however no change was observed in control or MOS (Figure 3). The relative change of maximal voluntary plantar flexion torque after intervention in SS (-4.3 ± 3.5%) was significantly different from the control (0.0 ± 2.9%), but no significant difference was observed between MOS (-1.6 ± 3.9%) and control.
Figure 3.
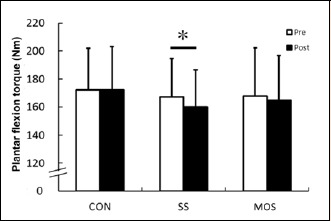
Changes in maximal voluntary isometric plantar flexion torque in each condition. CON: control; SS: static stretching; MOS: minute oscillation stretching. *: significantly changed compared with pre- intervention (p < 0.05). Values are expressed as mean ± standard deviation.
The main effect for time was observed in DFROM, with significant increases both in SS (d = 0.36) and MOS (d = 0.54) but not in control (Figure 4). The relative change of DFROM after intervention in MOS (11.2 ± 14.6%) was significantly higher than the control (-0.7 ± 4.0%), but no significant difference was observed between MOS and SS (7.2 ± 8.1%), or between SS and control.
Figure 4.
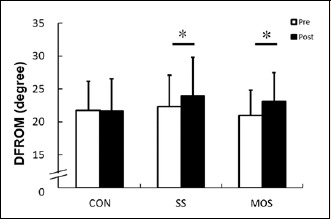
Changes in the dorsiflexion range of motion (DFROM) in each condition. CON: control; SS: static stretching; MOS: minute oscillation stretching. *: significantly changed compared with pre- intervention (p < 0.05). Values are expressed as mean ± standard deviation.
The interaction was observed between conditions and time in muscle elongation, with significant increases both in SS (d = 0.57) and MOS (d = 0.60) but not in control (Figure 5). The relative change of muscle elongation after intervention in MOS (8.5 ± 10.2%) was significantly higher than in control (-0.8 ± 3.2%), but no significant difference was observed between MOS and SS (5.8 ± 6.2%), or between SS and control. For tendon elongation, the main effect for time was not significant, and no change was observed in any of the conditions (Figure 6).
Figure 5.
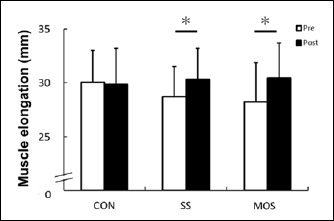
Changes in muscle elongation in each condition. CON: control; SS: static stretching; MOS: minute oscillation stretching. *: significantly changed compared with pre- intervention (p < 0.05). Values are expressed as mean ± standard deviation (n = 9).
Figure 6.
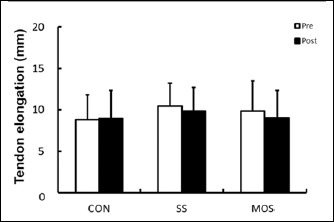
Changes in Achilles tendon elongation in each condition. CON: control; SS: static stretching; MOS: minute oscillation stretching. *: significantly changed compared with pre- intervention (p < 0.05). Values are expressed as mean ± standard deviation (n = 9).
The main effect for time was observed in the change of DFROM relative to the pre-intervention value: in SS, it was significantly smaller at Post 15, Post 30, and Post 60 compared with Post while in MOS, it was significantly smaller at Post 60 compared with Post, Post 15 and Post 30 (Table 1).
Table 1.
Time course of dorsiflexion range of motion in static stretching and minute oscillation stretching.
| Static stretching (%) | Minute oscillation stretching (%) | |
|---|---|---|
| Immediately post-stretching | 7.2 ± 8.1 | 11.2 ± 14.6 |
| 15 min post-stretching | 0.4 ± 7.9 * | 10.7 ± 11.1 |
| 30 min post-stretching | 0.2 ± 10.6 * | 5.5 ± 13.5 |
| 60 min post-stretching | -1.0 ± 9.4 * | -2.0 ± 12.2*†‡ |
*: significantly different compared with immediately post-stretching (p < 0.05).
†: significantly different compared with 15 min post-stretching (p < 0.05).
‡: significantly different compared with 30 min post-stretching (p < 0.05). Values at each time point are the relative changes from the pre-intervention values. Values are expressed as mean ± standard deviation.
Discussion
This study revealed that MOS did not compromise muscle strength, unlike in SS, while DFROM was improved to a similar extent to that observed with SS. In addition, it was shown that the enhanced DFROM associated with MOS continued on for longer than that for SS.
Previous studies reported that muscle functions (e.g. muscle strength and power) declined after SS (Herda et al., 2008; Kay and Blazevich, 2009; Sekir et al., 2010; Behm, and Chaouachi, 2011; Kay and Blazevich, 2012; Behm et al., 2016). Our results for SS coincided with those of these studies. In contrast, maximal voluntary plantar flexion torque was unchanged in MOS, and its relative change in MOS was not different from that in control, unlike in SS. Thus, MOS did not decrease muscle strength. SS is reported to decrease the neuromuscular activity during force production (Kay and Blazevich, 2009; Sekir et al., 2010; Trajano et al., 2017), but it is assumed that MOS does not reduce neuromuscular activity, due to maximal voluntary plantar flexion torque being unchanged. A previous study has shown that the intramuscular blood flow increases after the repetitive and passive stretch–shortening cycles of MTU (passive joint movement) (Hellsten et al., 2008). Therefore, further studies are required to examine the effects of MOS on metabolic responsiveness. In contrast, muscle strength/power can be improved after DS (Yamaguchi and Ishii, 2005; Sekir et al., 2010; Behm, and Chaouachi, 2011; Behm et al., 2016), and this has been attributed to conditioning effects through lengthening and shortening of the MTU and active force production during DS, although their relative contributions are unknown. MOS provided passive and repetitive small length changes to the MTU undergoing SS without active force production, however the muscle strength was not improved. This result suggests that active force produced could be a dominant trigger for improving muscle strength by DS.
DFROM was significantly increased in both SS and MOS. This suggests that DFROM was increased by MOS by a SS-like effect on the plantar flexor MTU by dorsiflexing the ankle into the final ROM, similar to SS. An increase in muscle elongation due to SS has been thought to be caused by a decrease in passive muscle stiffness and changes in neurophysiological properties, including lowered stretch-reflex sensitivity (Weir et al., 2005; Morse et al., 2008; Mizuno et al., 2013; Taniguchi et al., 2015). Muscle elongation was comparable for MOS and SS, suggesting that the muscle was similarly affected by these 2 interventions. However, there was a tendency for the effect size of DFROM in MOS (d = 0.54: medium effect) to be larger than that in SS (d = 0.36: small effect). This could be explained by a greater decrease in musculotendinous stiffness in MOS compared with SS, resulting from passive and repetitive stretch–shortening cycles (Mutungi and Ranatunga, 1998; McNair et al., 2001; Avela et al., 2004; Yeh et al., 2007).
No change was observed in tendon elongation in SS or MOS. The load-elongation relationship of the tendinous tissue is divided into the toe region (larger and nonlinear elongation to a smaller tensile force) and the linear region (stiffer and linear elongation-tension relation) (Jozsa and Kannus, 1997). DFROM measurements in both SS and MOS were performed at the intensity corresponding to 20% of the maximal voluntary plantar flexion torque, which may have been within the toe region of the tendon force-length relationship, where the effect on the tendon of stretching is not influential (Kubo et al., 2001; Kay and Blazevich, 2009). Previous studies have suggested that decreasing tendon stiffness contributes to the reductions in MTU stiffness after SS and DS (Samukawa et al., 2011; Behm et al., 2016). Further studies with different ranges of the tendon force-length relationship are required to clarify the effects of MOS on tendon stiffness.
The improved flexibility subsided after 30 min in MOS, and within 15 min in SS. Previous studies reported the continuance of altered flexibility being between 10-120 min (Fowles et al., 2000; Power et al., 2004; Ryan et al., 2008; Sekir et al., 2010; Mizuno et al., 2013; Taniguchi et al., 2015) after SS, and 10 min after DS (Mizuno and Umemura, 2016). The continuance of altered flexibility in this study differs from these reports. This may be due to the differences in methodology with regards to duration and intensity of interventions. Neurophysiological changes caused by SS can affect the continuance of altered flexibility for ~2 min, and changes in the mechanical properties of muscular and tendinous tissues can keep altered flexibility for 8 min~ (Magnusson et al., 2000). It appears therefore that the continuing effect of MOS on flexibility is due to changes in muscle and tendon mechanical properties. Although further studies are required to clarify this mechanism, the present study indicates that MOS enhanced DFROM which then continued on for longer than enhancements induced by SS.
The MOS developed in this study clearly differs from SS in that it provides repetitive small length changes to the MTU longitudinally, and also differs from typical DS in terms of the lack of active force produced; thus, MOS is a novel stretching technique. Factors not examined in the present study, e.g., combinations of different stroke lengths and frequencies, might lead to the development of more effective applications of MOS on flexibility and exercise performance improvement.
In the present study, muscle activities were not measured; hence the extent of neuromuscular activity during measurements and stretching is unknown and the above argument remains largely speculative. The effects of MOS on neuromuscular activity are worth investigating in future studies. Although the present study involved subjects with a sufficient number to enable statistical analyses, future studies are warranted for a larger population including athletes. The effects of MOS on joint flexibility and muscle strength were not directly compared to the effects of DS as DS intervention was not performed in this study. DS does not sizably attenuate muscle functions, but it provides a smaller effect on flexibility than SS, and the effects of DS have been shown to persist for at least 10 min (Bacurau et al., 2009; Sekir et al., 2010; Mizuno and Umemura, 2016). MOS improves DFROM similarly to SS without decreasing strength, and the increased flexibility was retained until 30 min after MOS in this study. Therefore, it seems that MOS would be a better option for improving flexibility than DS. In the sport and clinical fields, using simple stretching maneuvers is required, and warm-ups are often combined with stretching and active exercises such as running and jumping. Future studies will apply the present findings to these fields, with the development of easier and operational methodologies for MOS, in combination with active exercises.
Conclusion
This study revealed the following effects of a newly developed stretching technique (MOS): first, muscle strength is not compromised compared to SS, and DFROM increased to a similar extent to that observed with SS; second, the improvement of DFROM subsided after 30 min in MOS and within 15 min in SS.
Acknowledgements
We sincerely thank Kohei Akase (former undergraduate student at the School of Sport Science, Waseda University), Wesugi laboratory (Faculty of Science and Engineering, Waseda University) and TOPRUN CO., Ltd. for their cooperations. This study was supported by the JSPS KAKENHI (16H01870; Grant-in-Aid for Scientific Research [A]) and MEXT-Supported Program for the Strategic Research Foundation at Private Universities, 2015-2019 from the Ministry of Education, Culture, Sports, Science and Technology (S1511017). The experiments comply with the current laws of the country in which they were performed. The authors have no conflicts of interests to declare.
Biographies

Naoki IKEDA
Employment
Faculty of Sport Sciences Waseda University, Japan
Degree
PhD
Research interest
Biomechanics, Stretching, Evaluation for physical performance
E-mail: n.ikeda2@kurenai.waseda.jp

Takayuki INAMI
Employment
Institute of Physical Education, Keio University, Japan
Degree
PhD
Research interest
Biomechanics, Sports medicine
E-mail: inamit@keio.jp

Yasuo KAWAKAMI
Employment
Faculty of Sport Sciences, Waseda University, Japan
Degree
PhD
Research interest
Biomechanics, muscle mechanics and exercise physiology
E-mail: ykawa@waseda.jp
References
- Alter M. J. (2004) Science of Flexibility. 3rd edition Champaign: Human Kinetics. [Google Scholar]
- Avela J., Finni T., Liikavainio T., Niemela E., Komi P. (2004) Neural and mechanical responses of the triceps surae muscle group after 1 h of repeated fast passive stretches. Journal of Applied Physiology 96, 2325-2332. [DOI] [PubMed] [Google Scholar]
- Babault N., Kouassi B. Y. L, Desbrosses K. (2010) Acute effects of 15 min static or contract-relax stretching modalities on plantar flexors neuromuscular properties. Journal of Science and Medicine in Sport 13, 247-252. [DOI] [PubMed] [Google Scholar]
- Bacurau R. F. P., Monteiro G. D. A., Ugrinowitsch C., Tricoli V., Cabral L. F., Aoki M. S. (2009) Acute effect of a ballistic and a static stretching exercise bout on flexibility and maximal strength. Journal of Strength and Conditioning Research 23, 304-308. [DOI] [PubMed] [Google Scholar]
- Behm D. G., Chaouachi A. (2011) A review of the acute effects of static and dynamic stretching on performance. European Journal of Applied Physiology 111, 2633-2651. [DOI] [PubMed] [Google Scholar]
- Behm D. G., Blazevich A. J., Kay A. D., McHugh M. (2016) Acute effects of muscle stretching on physical performance, range of motion, and injury incidence in healthy active individuals: A systematic review. Applied Physiology Nutrition and Metabolism 41, 1-11. [DOI] [PubMed] [Google Scholar]
- Cohen J. (1988) Statistical power analysis for the behavioral sciences. 2nd edition Hillsdale: Lawrence Erlbaum Associates. [Google Scholar]
- Fowles J., Sale D., MacDougall J. (2000) Reduced strength after passive stretch of the human plantarflexors. Journal of Applied Physiology, 89, 1179-1188. [DOI] [PubMed] [Google Scholar]
- Grieve D. W., Pheasent S., Cavanagh P. R. (1978) Prediction of gastrocnemius length from knee and ankle joint posture. In: International series on biomechanics-Biomechanics-A. Ed: Assmussen E., Jorgensen K. Baltimore: University Park Press; 405-412. [Google Scholar]
- Hellsten Y., Rufener N., Nielsen J. J., Hoier B., Krustrup P., Bangsbo J. (2008) Passive leg movement enhances interstitial VEGF protein, endothelial cell proliferation, and eNOS mRNA content in human skeletal muscle. American Journal of Physiology-Regulatory Integrative and Comparative Physiology 294, R975-R982. [DOI] [PubMed] [Google Scholar]
- Herda T. J., Cramer J. T., Ryan E. D., McHugh M. P., Stout J. R. (2008) Acute effects of static versus dynamic stretching on isometric peak torque, electromyography, and mechanomyography of the biceps femoris muscle. Journal of Strength and Conditioning Research 22, 809-817. [DOI] [PubMed] [Google Scholar]
- Jozsa L. G., Kannus P. (1997) Human tendons: Anatomy, physiology, and pathology. 1st edition Champaign: Human Kinetics. [Google Scholar]
- Kawakami Y., Kanehisa H., Fukunaga T. (2008) The relationship between passive ankle plantar flexion joint torque and gastrocnemius muscle and achilles tendon stiffness: Implications for flexibility. Journal of Orthopaedic and Sports Physical Therapy 38, 269-276. [DOI] [PubMed] [Google Scholar]
- Kay A. D., Blazevich A. J. (2009) Moderate-duration static stretch reduces active and passive plantar flexor moment but not achilles tendon stiffness or active muscle length. Journal of Applied Physiology 106, 1249-1256. [DOI] [PubMed] [Google Scholar]
- Kay A. D., Blazevich A. J. (2012) Effect of acute static stretch on maximal muscle performance: a systematic review. Medicine and Science in Sports and Exercise 44, 154-164. [DOI] [PubMed] [Google Scholar]
- Kubo K., Kanehisa H., Kawakami Y., Fukunaga T. (2001) Influence of static stretching on viscoelastic properties of human tendon structures in vivo. Journal of Applied Physiology 90, 520-527. [DOI] [PubMed] [Google Scholar]
- Magnusson S., Aagaard P., Nielson J. (2000) Passive energy return after repeated stretches of the hamstring muscle-tendon unit. Medicine and Science in Sports and Exercise 32, 1160-1164. [DOI] [PubMed] [Google Scholar]
- McNair P., Dombroski E., Hewson D., Stanley S. (2001) Stretching at the ankle joint: Viscoelastic responses to holds and continuous passive motion. Medicine and Science in Sports and Exercise 33, 354-358. [DOI] [PubMed] [Google Scholar]
- Mizuno T., Matsumoto M., Umemura Y. (2013) Viscoelasticity of the muscle-tendon unit is returned more rapidly than range of motion after stretching. Scandinavian Journal of Medicine and Science in Sports 23, 23-30. [DOI] [PubMed] [Google Scholar]
- Mizuno T., Umemura Y. (2016) Dynamic stretching does not change the stiffness of the muscle-tendon unit. International Journal of Sports Medicine 37, 1044-1050. [DOI] [PubMed] [Google Scholar]
- Morse C. I., Degens H., Seynnes O. R., Maganaris C. N., Jones D. A. (2008) The acute effect of stretching on the passive stiffness of the human gastrocnemius muscle tendon unit. Journal of Physiology-London 586, 97-106. [DOI] [PMC free article] [PubMed] [Google Scholar]
- Mutungi G., Ranatunga K. (1998) Temperature-dependent changes in the viscoelasticity of intact resting mammalian (rat) fast-and slow-twitch muscle fibres. Journal of Physiology-London 508, 253-265. [DOI] [PMC free article] [PubMed] [Google Scholar]
- Power K., Behm D., Cahill F., Carroll M., Young W. (2004) An acute bout of static stretching: Effects on force and jumping performance. Medicine and Science in Sports and Exercise 36, 1389-1396. [DOI] [PubMed] [Google Scholar]
- Ryan E. D., Beck T. W., Herda T. J., Hull H. R., Hartman M. J., Stout J. R., Cramer J. T. (2008) Do practical durations of stretching alter muscle strength? A dose - response study. Medicine and Science in Sports and Exercise 40, 1529-1537. [DOI] [PubMed] [Google Scholar]
- Samukawa M., Hattori M., Sugama N., Takeda N. (2011) The effects of dynamic stretching on plantar flexor muscle-tendon tissue properties. Manual Therapy 16, 618-622. [DOI] [PubMed] [Google Scholar]
- Sekir U., Arabaci R., Akova B., Kadagan S. M. (2010) Acute effects of static and dynamic stretching on leg flexor and extensor isokinetic strength in elite women athletes. Scandinavian Journal of Medicine and Science in Sports 20, 268-281. [DOI] [PubMed] [Google Scholar]
- Trajano G. S., Nosaka K., Blazevich A. J. (2017) Neurophysiological mechanisms underpinning stretch-induced force loss. Sports Medicine 47, 1531-1541. [DOI] [PubMed] [Google Scholar]
- Taniguchi K., Shinohara M., Nozaki S., Katayose M. (2015) Acute decrease in the stiffness of resting muscle belly due to static stretching. Scandinavian Journal of Medicine and Science in Sports 25, 32-40. [DOI] [PubMed] [Google Scholar]
- Weir D., Tingley J., Elder G. (2005) Acute passive stretching alters the mechanical properties of human plantar flexors and the optimal angle for maximal voluntary contraction. European Journal of Applied Physiology 93, 614-623. [DOI] [PubMed] [Google Scholar]
- Yamaguchi T., Ishii K. (2005) Effects of static stretching for 30 seconds and dynamic stretching on leg extension power. Journal of Strength and Conditioning Research 19, 677-683. [DOI] [PubMed] [Google Scholar]
- Yeh C. Y., Chen J. J., Tsai K. H. (2007) Quantifying the effectiveness of the sustained muscle stretching treatments in stroke patients with ankle hypertonia. Journal of Electromyography and Kinesiology 17, 453-461. [DOI] [PubMed] [Google Scholar]


