Abstract
Over 140,000 transcriptomic studies performed in healthy and diseased cell and tissue types, at baseline and after exposure to various agents, are available in public repositories. Integrating results of transcriptomic datasets has been an attractive approach to identify gene expression signatures that are more robust than those obtained for individual datasets, especially datasets with small sample size. We developed Reproducible Analysis and Validation of Expression Data (RAVED), a pipeline that facilitates the creation of R Markdown reports detailing reproducible analysis of publicly available transcriptomic data, and used it to analyze asthma and glucocorticoid response microarray and RNA-Seq datasets. Subsequently, we used three approaches to integrate summary statistics of these studies and identify cell/tissue-specific and global asthma and glucocorticoid-induced gene expression changes. Transcriptomic integration methods were incorporated into an online app called REALGAR, where end-users can specify datasets to integrate and quickly obtain results that may facilitate design of experimental studies.
Introduction
Gene expression microarrays and RNA-Seq are widely used techniques for transcriptomic profiling. Public repositories, such as the Gene Expression Omnibus (GEO), host transcriptomic data from over 140,000 assays1. The Sequence Read Archive (SRA), whose data is accessible through GEO, hosts RNA-Seq data along with other types of sequencing data2. The accessibility of transcriptomic data has allowed researchers to perform various secondary analyses to answer novel questions and test the reproducibility of published findings3. Integration of transcriptomic studies can also be used to increase statistical power, by virtue of increased sample sizes, to identify significant changes in gene expression as a result of treatment conditions or disease status4, 5. Leveraging existing datasets offers researchers a convenient and cost-effective avenue to identify novel hypotheses and better design experiments to address them. For example, a researcher may be interested in comparing gene expression changes that are shared across cell/tissue types vs. those that are cell and tissue-specific, or in comparing gene expression changes shared by those with a complex disease vs. those that are specific to disease endotypes. Facilitating reproducible analysis of transcriptomic data enables effective integration of heterogeneous transcriptomic studies to explore such questions.
Various methods to perform meta-analyses of summary statistics have been applied to microarray data, including approaches based on integration of effect sizes, p-values and ranks6. Effect size-based integration methods adopt a classic meta-analysis framework, assessing both within- and between-study variation across multiple studies. Generally, study-specific adjusted effect sizes (t statistics) are obtained, and Cochran’s Q statistic is used to test for heterogeneity. Next, a fixed or random effects model is used to combine statistics7. This method outperforms others when there is large between-study variation and small sample sizes, and because it provides an estimated combined effect size and directionality of significance, its results are readily interpretable. The Fisher’s sum of logs method8 is a common and straightforward approach used to obtain a combined statistic from individual p-values that does not require additional analysis, but it is limited in that inflation of p-values from an individual study may drive the combined results, leading to a large number of false discoveries. The rank product9 is a non-parametric statistical method that combines differentially expressed genes from individual studies based on their within-study ranks. Significance is determined based on a permutation procedure that obtains expected rank products and estimates a conservative false discovery rate (FDR). Because it is based on fewer assumptions than other methods, the rank product method is robust for handling noisy datasets. Integration of summary statistics for RNA-Seq data is becoming more common as RNA-Seq data is increasingly made available10. To date, there is no widely accepted method for integrating summary statistics across microarray and RNA-Seq studies because the differential expression methods used for each type of data are developed based on different hypothesized distribution models. The continued proliferation of microarray and RNA-Seq data, however, suggests that proper integration of these akin data types will aid in the discovery of robust gene expression patterns.
Asthma, a complex disease characterized by reversible airflow limitation, is composed of several endotypes11-13 and affects several tissues, including inflammatory eosinophils14, airway epithelium15, and airway smooth muscle16. Glucocorticoids are drugs commonly used for the treatment of asthma, given in inhaler form as maintenance therapy or oral form to alleviate exacerbations or treat severe disease17. Although glucocorticoids are known to act by directly modifying transcription of genes, their tissue and cell-specific effects are poorly understood18. Several asthma-related transcriptomic studies have been performed over the past 10 years spanning various cell and tissue types19, 20. Results from these studies underscore the heterogeneity of gene expression patterns among patients, with no clear signatures that distinguish asthma patients from non-asthma controls.20 Using asthma as a disease model, we developed Reproducible Analysis and Validation of Expression Data (RAVED), a pipeline that adopts several existing informatics tools for analyzing both microarray and RNA-Seq data21-24. Subsequently, we compared effect size-, p-value-, and rank-based methods to integrate summary statistics from 17 asthma and 13 glucocorticoid-response datasets and identify global vs. cell/tissue-specific gene expression changes.
Methods
Reproducible Analysis and Validation of Expression Data (RAVED)
RAVED was created to facilitate analysis of publicly available microarray and RNA-Seq data from GEO or SRA (Figure 1). It is nearly automatic, but human decision-making remains a requirement at key steps (e.g., when selecting relevant phenotype data). RAVED consists of R Markdown25 documents that can be modified to execute analysis steps and create summary reports and result files. Although RAVED can be used on a personal computer, a high performance computing (HPC) environment is necessary for analysis of many microarray samples (typically more than 100 in our experience) and for the initial stages of RNA-Seq data analysis (i.e., read alignment, quality control, and quantification of transcripts/genes). RAVED scripts can be used directly in a single HPC node for analysis of many microarray samples. For RNA-Seq data analysis, RAVED provides sample LSF scripts that users can modify as needed to be compatible with their own workload management systems. Instructions and code are available on GitHub (https://github.com/HimesGroup/raved).
Figure 1.
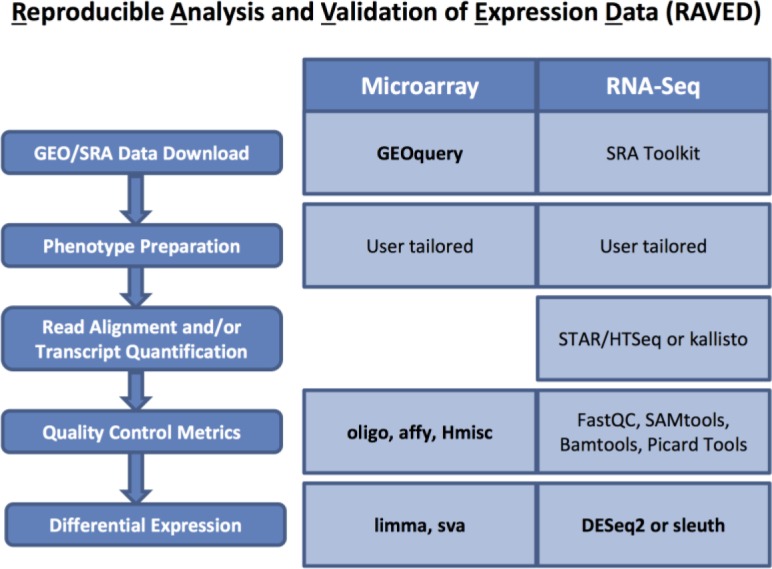
Steps followed by RAVED to analyze microarray and RNA-Seq data are provided on the left. Specific programs and R packages (in bold) used for each step are shown on the right.
Microarray Data Analysis. RAVED downloads GSEMatrix and raw data files from GEO. Phenotype information is extracted from GSEMatrix files, as is probe intensity data when raw data files are not available. Alternatively, users can provide their own microarray intensity files (CEL or matrix format). A phenotype file of standard format is prepared based on user-provided input. A quality control step obtains quality metrics of raw intensity data using methods from arrayQualityMetrics23. Differential analysis is performed for each user-selected two-group comparison as follows: oligo22 and limma24 R packages are used to perform robust multi-array average (RMA) processing of raw probe intensities, fit a linear model to RMA log-intensity values, fit this model to a contrast matrix for the comparison of interest, and apply empirical Bayes smoothing to obtain more precise standard errors. For situations in which batch effects are found or users select to adjust for a specific batch effect, sva26 is used to obtain adjusted statistics. The Benjamini-Hochberg method is used to adjust for multiple comparisons. Probes are annotated to official gene symbols using corresponding R array annotation packages.
RNA-Seq Data Analysis. RAVED downloads RNA-Seq raw data in sra format from SRA and converts it to fastq format using the SRA Toolkit. Alternatively, users can provide their own fastq files. A modified version of taffeta scripts (https://github.com/HimesGroup/taffeta) are used to analyze fastq files27, 28. Briefly, adapters are trimmed using trimmomatic29, and overall quality control metrics are obtained using FastQC30. Trimmed reads are aligned to the hg38 reference genome using STAR31, and HTSeq32 is used to quantify genes based on reads that mapped to hg38 reference files. Bamtools is used to count and summarize the number of mapped reads, while Picard Tools is used to compute the number of bases assigned to various classes of RNA. Gene-level differential expression analysis is performed using DESeq233. The Benjamini-Hochberg method is used to adjust for multiple comparisons. Ensembl gene IDs are annotated to official gene symbols using BioMart34. RAVED also offers the option to compute transcript-level results using kallisto35 to quantify transcripts and sleuth36 to perform differential expression analysis.
Integration of Asthma-Related Transcriptomic Data
Data Sources. Based on searches in GEO using the terms “asthma” and “glucocorticoid,” 23 gene expression microarray and 2 RNA-Seq datasets were selected for analysis. Following review of each dataset, a total of 17 asthma vs. non-asthma and 13 glucocorticoid vs. control comparisons from the transcriptomic studies were selected for integration analyses (Table 1).
Table 1.
Individual differential expression comparisons selected from among asthma and glucocorticoid response datasets for integration analysis.
| Asthma Datasets | ||||
|---|---|---|---|---|
| GEO ID | Tissue/Cell Type | Asthma Endotype | Non-Asthma Samples (N) | Asthma Samples (N) |
| GSE35643 | Airway smooth muscle† | mild asthma | 3 | 3 |
| SRP043162 | Airway smooth muscle† | fatal asthma | 12 | 6 |
| GSE44037 | Bronchial epithelium† | allergic asthma | 6 | 6 |
| GSE4302 | Bronchial epithelium† | asthma | 28 | 42 |
| GSE13396 | Bronchial epithelium† | asthma | 6 | 5 |
| GSE41649 | Bronchial epithelium† | allergic asthma | 4 | 4 |
| GSE22528 | Bronchoalveolar lavage | allergic asthma | 5 | 5 |
| GSE31773 | CD4 cells* | severe asthma | 8 | 7 |
| GSE31773 | CD8 cells* | severe asthma | 8 | 8 |
| GSE15823 | Lung | asthma | 4 | 3 |
| GSE44037 | Nasal epithelium | allergic asthma | 6 | 6 |
| GSE19187 | Nasal epithelium | asthma and rhinitis | 10 | 6 |
| GSE35571 | Peripheral blood mononuclear cells* | asthma | 62 | 57 |
| GSE40889 | Peripheral blood mononuclear cells* | allergic asthma | 13 | 13 |
| GSE40889 | Peripheral blood mononuclear cells* | non-allergic asthma | 13 | 8 |
| GSE27011 | White blood cells* | mild asthma | 18 | 19 |
| GSE27011 | White blood cells* | mild asthma | 18 | 17 |
| Glucocorticoid Response Datasets | ||||
| GEO ID | Tissue/Cell Type | Treatment Description | Control Samples (N) | Treated Samples (N) |
| GSE13168 | Airway smooth muscle† | Fluticasone (10nM; 0.5h) | 4 | 3 |
| SRP033351 | Airway smooth muscle† | Dexamethasone (1uM 18h) | 4 | 4 |
| GSE1815 | Bronchial epithelium† | Dexamethasone (100nM 8h) | 4 | 4 |
| GSE4302 | Bronchial epithelium† | Fluticasone | 13 | 19 |
| GSE3040 | Lens epithelial cells | Dexamethasone (16h) | 3 | 3 |
| GSE55876 | Lymphoblastic leukemia cells* | Dexamethasone (100nM; 6h) | 3 | 3 |
| GSE55877 | Lymphoblastic leukemia cells* | Dexamethasone (100nM; 6h) | 3 | 3 |
| GSE22152 | Lymphoblastic leukemia cells* | Dexamethasone (100nM; 6h) | 6 | 6 |
| GSE44248 | Lymphoblastoid cells* | Dexamethasone (1uM; 16h) | 8 | 8 |
| GSE61880 | Macrophages* | Dexamethasone (100nM;10h) | 3 | 3 |
| GSE4917 | MCF10A-Myc cells* | Dexamethasone (1uM; 24h) | 3 | 3 |
| GSE65401 | Osteosarcoma U20S cells | Dexamethasone 100nM 8h | 4 | 4 |
| GSE22779 | Peripheral blood mononuclear cells* | Dexamethasone (10uM; 6h) | 3 | 3 |
Summary statistics-based integration methods. Differential expression summary statistics were obtained for comparisons of interest using RAVED, with STAR/HTSeq and DESeq2 options for RNA-Seq dataset analysis. Integration was conducted at the gene level. If multiple probe IDs or Ensembl gene IDs were annotated to the same gene symbol, statistics were obtained from the one with the smallest p-value. The following approaches were used:
-
1)
Effect size-based method. A random-effects model was used due to the heterogeneity of selected datasets, which was estimated by DerSimonian and Laird’s method37. Effect sizes, measured as log2 fold change, and standard errors from individual studies were passed to the “meta.summaries” function from the R package rmeta38 to compute combined effect sizes and standard errors. Corresponding p-values were derived from the resultant z-score distribution and converted to q-values using the Benjamini-Hochberg approach.
-
2)P-value-based method. As a post hoc analysis, we converted p-values from two-sided tests to one-sided to take into account differences in effect direction as follows:
The reference study was defined as the study with the largest sample size. P-values from K studies were combined using Fisher’s sum-of-logs method8: , where S followed a χ2 distribution with 2K degrees of freedom under the joint null hypothesis. Meta-analysis p-values were determined based on the joint statistics and converted to q-values using the Benjamini-Hochberg approach.
-
3)
Rank-based method. We adopted the Rank Product method9 and ranked genes present in each individual dataset based on their unadjusted p-values. Tied values were assigned the average of the applicable ranks. The ranks of individual comparisons were scaled by dividing the total number of genes by a rank value. The rank product statistic for gene g in K studies was defined as the geometric mean rank: . The approximate rank product distribution was obtained using 106 permutations, and empirical p-values, E(RPg), were defined based on the proportion of simulated rank products that were smaller than the observed rank product. For each gene g, a FDR-adjusted q-value was conservatively estimated as: .
These three integration methods were incorporated into our previously developed app, REALGAR39, which allows users to select tissue and cell type for a gene of interest and obtain integration results on-the-fly.
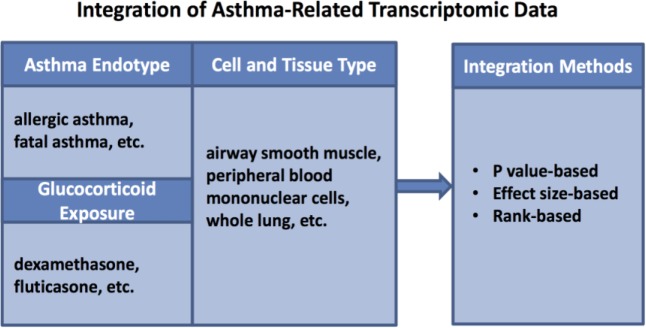
Global and Cell/Tissue-Specific Transcriptomic Result Integration for Asthma and Glucocorticoid Response Datasets. To identify genes that were globally differentially expressed across asthma or glucocorticoid exposure conditions, we integrated studies across all tissue and cell types for 439 samples corresponding to 17 asthma datasets, and 127 samples corresponding to 13 glucocorticoid datasets. To identify cell-specific expression patterns, we performed separate analyses for blood and structural cells. Specifically, 269 samples from seven blood cell studies, and 125 samples from six structural cell studies were integrated to identify asthma-specific expression changes; 58 samples from seven blood cell studies, and 55 samples from four structural cell studies were integrated to identify glucocorticoid-responsive expression changes (Figure 2).
Figure 2.
Overview of the integration analysis. 25 transcriptomic asthma and glucocorticoid datasets, consisting of various asthma endotypes and cell/tissue types, were integrated using three summary statistic-based methods.
Results
RAVED Facilitates Reproducible Analysis of Transcriptomic Data
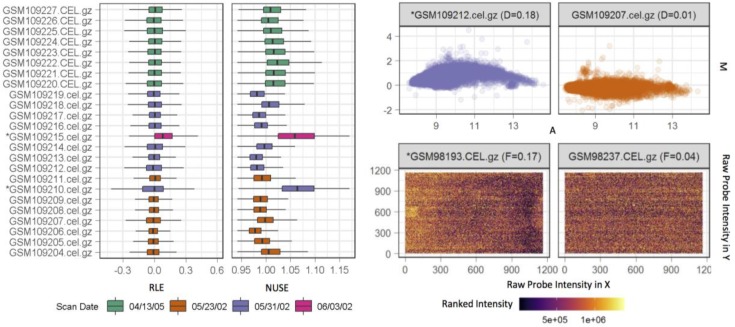
We created RAVED and used it to analyze 25 publicly available transcriptomic datasets, which included extensive quality control checks for each study of interest (Figure 3). Differential expression results for individual comparisons as listed in Table 1 were obtained. Corresponding code for individual comparisons and integration results for significant genes are available at https://github.com/HimesGroup/Asthma Transcriptomic Analysis.
Figure 3.
Sample of RAVED quality control outputs. Boxplots of relative log expression (RLE) and normalized unscaled standard error (NUSE) (left), MA plots (top right) and spatial plots (bottom right) are generated during the microarray data quality control procedure.
Integration of Asthma-Related Transcriptomic Data
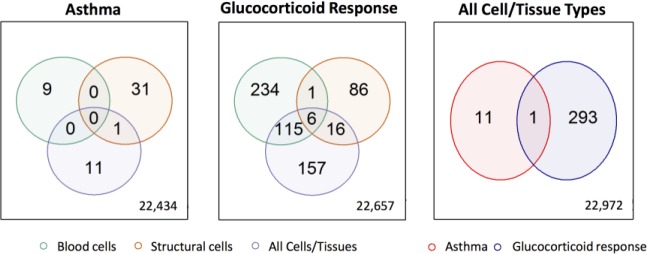
Global and Cell-Specific Asthma and Glucocorticoid Response Expression Signatures. F or each phenotype and cell/tissue group of interest, genes with q-value <0.05 obtained by at least two integration methods were considered significant. More significant glucocorticoid responsive genes were found compared to asthma vs. non-asthma significant genes (9 vs. 356 in blood cell studies, 32 vs. 109 in structural cell studies, and 12 vs. 294 in studies of all cell/tissue types) (Figure 4). The majority of significant genes were Asthma Glucocorticoid ResponseAll Cell/Tissue Types cell-specific: no significant asthma genes were shared between blood and structural cells, and only seven significant glucocorticoid responsive genes were shared between blood and structural cells. Interesting observations among the significant asthma vs. non-asthma genes, included the finding that ITPR3 was significantly upregulated in asthma structural cells, as this gene’s variants were associated with allergic diseases in a large genome-wide association study (GWAS) (p-value <5 × 10⁻⁸).40 SPICE1 was downregulated in structural cells of individuals with asthma, and across all cell/tissue types according to p-value and effect size-based methods, suggesting it is a novel asthma candidate gene that may have a broad role in asthma pathobiology. Twice as many significant glucocorticoid responsive genes were identified in blood cells vs. structural cells (356 vs. 109), a finding that may reflect the fact that more blood cell studies were available or that glucocorticoids had a greater effect on immune cell gene expression. Robust glucocorticoid-induced gene expression changes identified in blood cells, structural cells and across all cell/tissue types include well-known glucocorticoid responsive genes (TSC22D327,41,42, FKBP527, 41, GLUL27, KLF943 as well as less investigated genes (ASTE1, CELF2 and DDIT4). Of note, CELF2 variants were significantly associated with asthma in a recent meta-analysis GWAS of 23,948 asthma cases and 118,538 controls.44 One of these variants was predicted to be a distal regulator of GATA3, a gene encoding a transcription factor that mediates the differentiation of Th2 cells.44 Additionally, a zebrafish study found that CELF2 expression was increased in embryos with knocked-down glucocorticoid receptors.45 Other known glucocorticoid responsive genes, such as DUSP127,46 were significant in blood cells and across all cell/tissue types, but not in structural cells, while other genes, such as PERl27,43, CEBPD27 and CRISPLD227 were significant in all cell/tissue types, but not when considering blood or structural cells alone. Although biased because they are based on the availability of publicly available datasets, which do not evenly represent all tissues/cells, these results warrant further investigation as they offer potential insights into tissue/cell-specific mechanisms of action.
Figure 4.
Comparison of genes with significant expression changes across cell/tissue types for asthma studies (left) and glucocorticoid response studies (center), and in asthma vs. glucocorticoid response datasets across all cell/tissue types (right). The total number of genes available for each comparison is shown on the bottom right of the corresponding diagram.
Overlap of Asthma vs. Non-Asthma and Glucocorticoid Response Differentially Expressed Genes. Integration of results across all cell/tissue types identified one gene, NSFL1C, that was significant in both the asthma and glucocorticoid studies. NSFL1C was significant according to the p-value- and rank-based integration methods of asthma studies, and according to effect size- and p-value-based integration methods of glucocorticoid studies (Figure 5A). The overall asthma effect size showed a global and structural cell-specific upregulation trend, while the global and cell-specific effect in glucocorticoid-treated cells was downregulation (Figure 5B), consistent with the expectation that glucocorticoids act to reverse asthma-specific changes. Although direct involvement of NSFL1C in asthma or glucocorticoid response mechanisms has not been reported, the cytoplasmic protein NSFL1 cofactor p47, which is a product of the NSFL1C gene, was found to interact with IL-7 receptor (IL7R) in IL7-induced CD4 T cell response initiation47. No shared cell-specific significant genes were found between the asthma and glucocorticoid studies.
Figure 5.
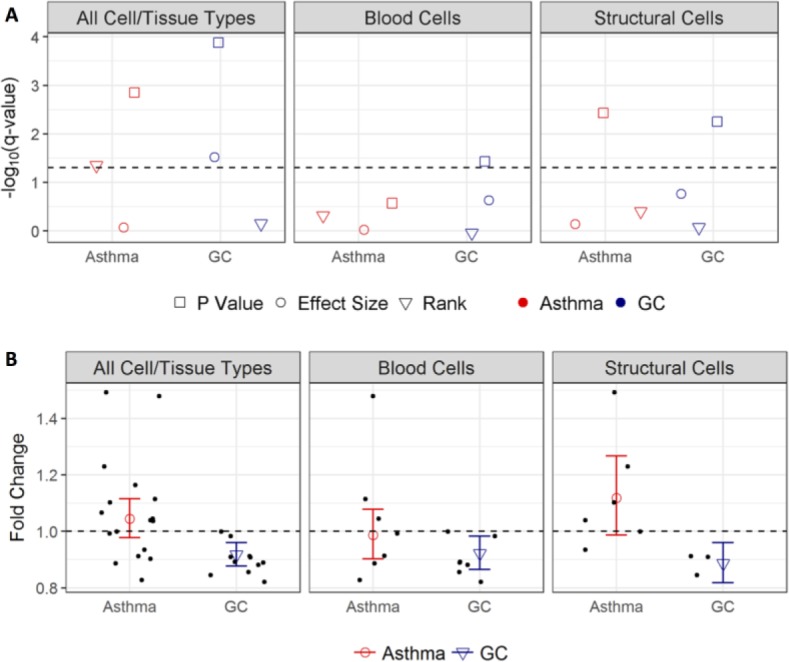
Integration results for NSFL1C. A) Q-values corresponding to integration of all cell/tissue types, blood cells, and structural cells for asthma and glucocorticoid (GC) datasets obtained via three methods. Dashed line indicates q-value=0.05. B) Overall fold changes from effect size-based integration (circles and triangles) and fold changes from individual studies (dots). Bars represent 95% confidence intervals. Dashed line indicates fold change=1.
Discussion
We developed and applied RAVED, a pipeline for reproducible analysis of transcriptomic data, to analyze publicly available asthma-related transcriptomic datasets. Subsequently, we performed summary statistics-based integration analyses to (1) compare differentially expressed genes in blood cells, structural cells, and across all tissue and cell types for asthma vs non-asthma and integration of all cell/tissue types, blood cells, and structural cells,and across all tissue and cell types for asthma vs. non-asthma and glucocorticoid response datasets and (2) compare differentially expressed genes across all tissue/cell types in asthma vs. non-asthma to those that were glucocorticoid responsive. Although there are various published microarray meta-analysis studies and a lot of publicly available transcriptomic data, much work remains to maximize the ability of transcriptomic data to inform human pathobiology by presenting results to wet-lab researchers. We selected integration methods that can be performed on summary statistics because these could be incorporated into an app that end-users without a computational background can utilize to test their own hypothesis. For example, experimental researchers can gain useful insights from integrated gene- and disease-specific transcriptomic data to design functional validation studies in support of genetic associations, but most experimental researchers do not have the time or resources to analyze publicly available transcriptomic data. Meta-analyses of publicly available data are limited in that available data does not cover all relevant cells/tissues. While this is a concern, our integration study showed that the limitation does not diminish our ability to create hypotheses and guide planned experimental studies.
As summary statistics-based integration methods rely on having properly and consistently obtained statistics for individual studies, RAVED was created to streamline and standardize transcriptomic data analysis. Additionally, it produces well-documented reports for quality control and result visualization of publicly available datasets that are easy to customize and allow users to include other methods. Although RAVED is nearly automatic, researchers are required to manually inspect the quality control metrics and plots to identify sample outliers and batch effects, and use these results to guide differential expression analyses. To remove inter-dataset batch effects, in contrast to using a normalization method like COCONUT that normalizes individual studies simultaneously5, RAVED employs study-specific normalization methods at each stage of analysis. Microarray data is pre-processed using RMA22 prior to differential expression analysis; for RNA-Seq data, gene-level read counts are normalized using the approach in DESeq221, 33. Scan date information, which RAVED extracts from raw data, is used for batch effect adjustment. To avoid confounding factors that arise from cross-platform integration, for any given comparison, samples from the same platform undergo quality control and differential expression analysis together.
There is no gold standard for transcriptomic data integration, as real-world gene expression data are biologically and technically complex48. A systematic guideline suggests renormalizing and log2-transforming chosen datasets, performing effect size-based meta-analyses for discovery while applying stringent effect size thresholds with relaxed significance thresholds (e.g., log2 fold change >1.3 and FDR <0.01-0.05), and then performing validation in fully independent cohorts48. There are many practical examples of integrating microarray data based on these guidelines4, 5 49. In our asthma and glucocorticoid studies, the sample sizes were not large enough to meaningfully split into testing and validation portions. We included all studies available in the integration analysis to discover potentially robust asthma-related signatures. We used three summary statistics-based methods that rely on different hypotheses, and defined significant genes on the basis of passing the significance threshold of at least two of these methods to capture the most robust gene expression signatures. Specifically, this approach attempted to reduce potential false positives from the p-value-based method, which can occur as a result of inflated p-values from individual studies, and potential false negatives arising from conservative FDR used in the rank-based method. We provided overall estimates of effect size and directionality obtained via the effect size-based method, as providing these values is helpful for functional validation studies.
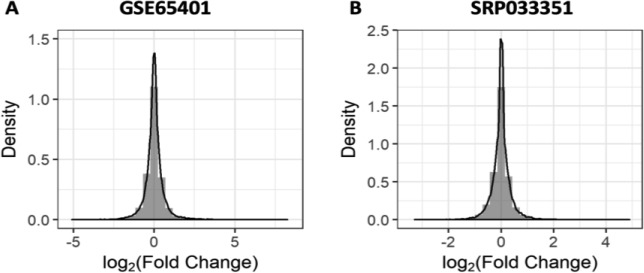
There is no consensus on the ideal method to integrate microarray and RNA-Seq data. A salient problem is that the raw data obtained via each technique are hypothesized to follow different distributions. The distribution of effect sizes from individual microarray and RNA-Seq studies we used was normally distributed (Figure 6). Thus, although the effect size distribution for each gene was unknown, we assumed it would follow a normal distribution across studies, and thus, integration of summary statistics from the selected microarray and RNA-Seq studies was appropriate. We identified several previously known glucocorticoid responsive genes in structural cells, supporting the notion that our integration was reliable for the current datasets. It should be noted that only two RNA-Seq studies (one asthma study and one glucocorticoid study) were included in the integration analyses, and both were conducted in airway smooth muscle cells. In future work, inclusion of more RNA-Seq datasets will be helpful to assess whether the integration strategy used is generalizable. We added the integration methods to our previously developed cloud-based app REALGAR (http://realgar.org/), which allows users to select phenotypes and/or tissue and cell types of interest for integration. As the computation in REALGAR is done for an individual gene of interest, p-values from the p-value-based and effect size-based methods are not adjusted for multiple corrections. We suggest that users apply a stringent threshold of multiple corrections corresponding to 25,000 genes (i.e. 0.05/25,000 = 2 ×10⁻⁶) and note this in the app. For the rank-based method, an analytic rank product is provided instead of the permutated empirical p-value, so we suggest users refer to the rank score when prioritizing the genes for functional validation.
Figure 6.
Representative distribution of effect sizes from an individual microarray study GSE65401 (left) and an RNA-Seq study SRP033351 (right).
In addition to the limitations mentioned thus far, there are others worth noting. Despite being nearly automatic, RAVED requires human decision-making during QC steps and input regarding analysis strategies, and tailoring of scripts to specific HPC environments. Due to the heterogeneity of experimental designs and complexity of biological questions researchers pose with seemingly simple microarray and RNA-Seq studies, we have minimized non-automated tasks to the extent we think is reasonable. Further studies could develop and validate automated approaches to identify and process publicly available datasets using phenotypes and meta-data extracted from GEO/SRA entries, as well as linked publications. We did not observe robust asthma gene expression signatures, which is likely due to the heterogeneity of asthma itself. We were underpowered to restrict the analysis to specific asthma endotypes (e.g. severe asthma), but as more asthma studies become available, clearer disease-specific signatures may arise. Meanwhile, extending our integration efforts to other complex diseases and drug-response traits will likely identify other robust gene expression signatures.
Conclusion
We created RAVED, a user-friendly pipeline for the analysis of microarray and RNA-Seq data, and used it to analyze 25 publicly available asthma and glucocorticoid transcriptomic datasets. Differential expression results from individual datasets were integrated using three summary statistics-based methods that have been integrated into an online app that allows users to quickly obtain results for their own selection of datasets. Comparison of global vs. cell/tissue specific gene expression patterns among asthma and glucocorticoid datasets identified novel asthma-related genes that warrant further study.
Acknowledgements
This work was supported by NIH R01 HL133433 and R01 HL141992.
References
- 1.Barrett T, Suzek TO, Troup DB, Wilhite SE, Ngau WC, Ledoux P. NCBI GEO: mining millions of expression profiles--database and tools. Nucleic Acids Res. 2005;33(Database issue):D562–6. doi: 10.1093/nar/gki022. [DOI] [PMC free article] [PubMed] [Google Scholar]
- 2.Leinonen R, Sugawara H, Shumway M. International Nucleotide Sequence Database C. The sequence read archive. Nucleic Acids Res. 2011;39(Database issue):D19–21. doi: 10.1093/nar/gkq1019. [DOI] [PMC free article] [PubMed] [Google Scholar]
- 3.Ioannidis JP, Khoury MJ. Improving validation practices in “omics” research. Science. 2011;334(6060):1230–2. doi: 10.1126/science.1211811. [DOI] [PMC free article] [PubMed] [Google Scholar]
- 4.Kodama K, Horikoshi M, Toda K, Yamada S, Hara K, Irie J. Expression-based genome-wide association study links the receptor CD44 in adipose tissue with type 2 diabetes. Proc Natl Acad Sci U S A. 2012;109(18):7049–54. doi: 10.1073/pnas.1114513109. [DOI] [PMC free article] [PubMed] [Google Scholar]
- 5.Sweeney TE, Wong HR, Khatri P. Robust classification of bacterial and viral infections via integrated host gene expression diagnostics. Sci Transl Med. 2016;8(346):346ra91. doi: 10.1126/scitranslmed.aaf7165. [DOI] [PMC free article] [PubMed] [Google Scholar]
- 6.Hong F, Breitling R. A comparison of meta-analysis methods for detecting differentially expressed genes in microarray experiments. Bioinformatics. 2008;24(3):374–82. doi: 10.1093/bioinformatics/btm620. [DOI] [PubMed] [Google Scholar]
- 7.Choi JK, Yu U, Kim S, Yoo OJ. Combining multiple microarray studies and modeling interstudy variation. Bioinformatics. 2003;19(Suppl 1):i84–90. doi: 10.1093/bioinformatics/btg1010. [DOI] [PubMed] [Google Scholar]
- 8.Fisher RA. 1925. Statistical Methods For Research Workers: Cosmo Publications. [Google Scholar]
- 9.Breitling R, Armengaud P, Amtmann A, Herzyk P. Rank products: a simple, yet powerful, new method to detect differentially regulated genes in replicated microarray experiments. FEBS Lett. 2004;573(1-3):83–92. doi: 10.1016/j.febslet.2004.07.055. [DOI] [PubMed] [Google Scholar]
- 10.Rau A, Marot G, Jaffrezic F. Differential meta-analysis of RNA-seq data from multiple studies. BMC Bioinformatics. 2014;15:91. doi: 10.1186/1471-2105-15-91. [DOI] [PMC free article] [PubMed] [Google Scholar]
- 11.Akinbami L, Moorman J, Bailey C, Zahran H, King M, Johnson C. Hyattsville, MD: National Center for Health Statistics; 2012. Trends in asthma prevalence, health care use, and mortality in the United States, 2001–2010. [PubMed] [Google Scholar]
- 12.Wenzel SE. Asthma phenotypes: the evolution from clinical to molecular approaches. Nat Med. 2012;18(5):716–25. doi: 10.1038/nm.2678. [DOI] [PubMed] [Google Scholar]
- 13.Lotvall J, Akdis CA, Bacharier LB, Bjermer L, Casale TB, Custovic A. Asthma endotypes: a new approach to classification of disease entities within the asthma syndrome. J Allergy Clin Immunol. 2011;127(2):355–60. doi: 10.1016/j.jaci.2010.11.037. [DOI] [PubMed] [Google Scholar]
- 14.Loza MJ, Penn RB. Regulation of T cells in airway disease by beta-agonist. Front Biosci (Schol Ed) 2010;2:969–79. doi: 10.2741/s113. [DOI] [PMC free article] [PubMed] [Google Scholar]
- 15.Lambrecht BN, Hammad H. The airway epithelium in asthma. Nat Med. 2012;18(5):684–92. doi: 10.1038/nm.2737. [DOI] [PubMed] [Google Scholar]
- 16.Prakash YS. Airway smooth muscle in airway reactivity and remodeling: what have we learned? Am J Physiol Lung Cell Mol Physiol. 2013;305(12):L912–33. doi: 10.1152/ajplung.00259.2013. [DOI] [PMC free article] [PubMed] [Google Scholar]
- 17.Fanta CH. Asthma. N Engl J Med. 2009;360(10):1002–14. doi: 10.1056/NEJMra0804579. [DOI] [PubMed] [Google Scholar]
- 18.Rhen T, Cidlowski JA. Antiinflammatory action of glucocorticoids--new mechanisms for old drugs. N Engl J Med. 2005;353(16):1711–23. doi: 10.1056/NEJMra050541. [DOI] [PubMed] [Google Scholar]
- 19.Berube JC, Bosse Y. Future clinical implications emerging from recent genome-wide expression studies in asthma. Expert Rev Clin Immunol. 2014;10(8):985–1004. doi: 10.1586/1744666X.2014.932249. [DOI] [PubMed] [Google Scholar]
- 20.Kan M, Shumyatcher M, Himes BE. Using omics approaches to understand pulmonary diseases. Respir Res. 2017;18(1):149. doi: 10.1186/s12931-017-0631-9. [DOI] [PMC free article] [PubMed] [Google Scholar]
- 21.Love MI, Anders S, Kim V, Huber W. RNA-Seq workflow: gene-level exploratory analysis and differential expression. F1000Res. 2015;4:1070. doi: 10.12688/f1000research.7035.1. [DOI] [PMC free article] [PubMed] [Google Scholar]
- 22.Carvalho BS, Irizarry RA. A framework for oligonucleotide microarray preprocessing. Bioinformatics. 2010;26(19):2363–7. doi: 10.1093/bioinformatics/btq431. [DOI] [PMC free article] [PubMed] [Google Scholar]
- 23.Kauffmann A, Gentleman R, Huber W. arrayQualityMetrics--a bioconductor package for quality assessment of microarray data. Bioinformatics. 2009;25(3):415–6. doi: 10.1093/bioinformatics/btn647. [DOI] [PMC free article] [PubMed] [Google Scholar]
- 24.Ritchie ME, Phipson B, Wu D, Hu Y, Law CW, Shi W. limma powers differential expression analyses for RNA-sequencing and microarray studies. Nucleic Acids Res. 2015;43(7):e47. doi: 10.1093/nar/gkv007. [DOI] [PMC free article] [PubMed] [Google Scholar]
- 25.Allaire J, Cheng J, Xie Y, McPherson J, Chang W, Allen J. 2017. rmarkdown: Dynamic Documents for R. R package version 16. [Google Scholar]
- 26.Leek JT, Johnson WE, Parker HS, Jaffe AE, Storey JD. The sva package for removing batch effects and other unwanted variation in high-throughput experiments. Bioinformatics. 2012;28(6):882–3. doi: 10.1093/bioinformatics/bts034. [DOI] [PMC free article] [PubMed] [Google Scholar]
- 27.Himes BE, Jiang X, Wagner P, Hu R, Wang Q, Klanderman B. RNA-Seq transcriptome profiling identifies CRISPLD2 as a glucocorticoid responsive gene that modulates cytokine function in airway smooth muscle cells. PLoS One. 2014;9(6):e99625. doi: 10.1371/journal.pone.0099625. [DOI] [PMC free article] [PubMed] [Google Scholar]
- 28.Himes BE, Koziol-White C, Johnson M, Nikolos C, Jester W, Klanderman B. Vitamin D Modulates Expression of the Airway Smooth Muscle Transcriptome in Fatal Asthma. PLoS One. 2015;10(7):e0134057. doi: 10.1371/journal.pone.0134057. [DOI] [PMC free article] [PubMed] [Google Scholar]
- 29.Bolger AM, Lohse M, Usadel B. 2014. Trimmomatic: a flexible trimmer for Illumina sequence data. Bioinformatics. [DOI] [PMC free article] [PubMed] [Google Scholar]
- 30.Andrews S. FastQC A Quality Control tool for High Throughput Sequence Data. Available from: http://www.bioinformatics.babraham.ac.uk/projects/fastqc/
- 31.Dobin A, Davis CA, Schlesinger F, Drenkow J, Zaleski C, Jha S. STAR: ultrafast universal RNA-seq aligner. Bioinformatics. 2013;29(1):15–21. doi: 10.1093/bioinformatics/bts635. [DOI] [PMC free article] [PubMed] [Google Scholar]
- 32.Anders S, Pyl PT, Huber W. HTSeq--a Python framework to work with high-throughput sequencing data. Bioinformatics. 2015;31(2):166–9. doi: 10.1093/bioinformatics/btu638. [DOI] [PMC free article] [PubMed] [Google Scholar]
- 33.Love MI, Huber W, Anders S. Moderated estimation of fold change and dispersion for RNA-seq data with DESeq2. Genome Biol. 2014;15(12):550. doi: 10.1186/s13059-014-0550-8. [DOI] [PMC free article] [PubMed] [Google Scholar]
- 34.Durinck S, Moreau Y, Kasprzyk A, Davis S, De Moor B, Brazma A. BioMart and Bioconductor: a powerful link between biological databases and microarray data analysis. Bioinformatics. 2005;21(16):3439–40. doi: 10.1093/bioinformatics/bti525. [DOI] [PubMed] [Google Scholar]
- 35.Bray NL, Pimentel H, Melsted P, Pachter L. Near-optimal probabilistic RNA-seq quantification. Nat Biotechnol. 2016;34(5):525–7. doi: 10.1038/nbt.3519. [DOI] [PubMed] [Google Scholar]
- 36.Pimentel H, Bray NL, Puente S, Melsted P, Pachter L. Differential analysis of RNA-seq incorporating quantification uncertainty. Nat Methods. 2017;14(7):687–90. doi: 10.1038/nmeth.4324. [DOI] [PubMed] [Google Scholar]
- 37.DerSimonian R, Laird N. Meta-analysis in clinical trials. Control Clin Trials. 1986;7(3):177–88. doi: 10.1016/0197-2456(86)90046-2. [DOI] [PubMed] [Google Scholar]
- 38.Lumley T. 2012. rmeta: Meta-analysis. R package version 216. [Google Scholar]
- 39.Shumyatcher M, Hong R, Levin J, Himes BE. Disease-Specific Integration of Omics Data to Guide Functional Validation of Genetic Associations. AMIA Annu Symp Proc. 2017;2017:1589–96. [PMC free article] [PubMed] [Google Scholar]
- 40.Ferreira MA, Vonk JM, Baurecht H, Marenholz I, Tian C, Hoffman JD. Shared genetic origin of asthma, hay fever and eczema elucidates allergic disease biology. Nat Genet. 2017;49(12):1752–7. doi: 10.1038/ng.3985. [DOI] [PMC free article] [PubMed] [Google Scholar]
- 41.Kelly MM, King EM, Rider CF, Gwozd C, Holden NS, Eddleston J. Corticosteroid-induced gene expression in allergen-challenged asthmatic subjects taking inhaled budesonide. Br J Pharmacol. 2012;165(6):1737–47. doi: 10.1111/j.1476-5381.2011.01620.x. [DOI] [PMC free article] [PubMed] [Google Scholar]
- 42.Eddleston J, Herschbach J, Wagelie-Steffen AL, Christiansen SC, Zuraw BL. The anti-inflammatory effect of glucocorticoids is mediated by glucocorticoid-induced leucine zipper in epithelial cells. J Allergy Clin Immunol. 2007;119(1):115–22. doi: 10.1016/j.jaci.2006.08.027. [DOI] [PubMed] [Google Scholar]
- 43.Reddy TE, Pauli F, Sprouse RO, Neff NF, Newberry KM, Garabedian MJ. Genomic determination of the glucocorticoid response reveals unexpected mechanisms of gene regulation. Genome Res. 2009;19(12):2163–71. doi: 10.1101/gr.097022.109. [DOI] [PMC free article] [PubMed] [Google Scholar]
- 44.Demenais F, Margaritte-Jeannin P, Barnes KC, Cookson WOC, Altmuller J, Ang W. Multiancestry association study identifies new asthma risk loci that colocalize with immune-cell enhancer marks. Nat Genet. 2018;50(1):42–53. doi: 10.1038/s41588-017-0014-7. [DOI] [PMC free article] [PubMed] [Google Scholar]
- 45.Nesan D, Vijayan MM. The transcriptomics of glucocorticoid receptor signaling in developing zebrafish. PLoS One. 2013;8(11):e80726. doi: 10.1371/journal.pone.0080726. [DOI] [PMC free article] [PubMed] [Google Scholar]
- 46.Shipp LE, Lee JV, Yu CY, Pufall M, Zhang P, Scott DK. Transcriptional regulation of human dual specificity protein phosphatase 1 (DUSP1) gene by glucocorticoids. PLoS One. 2010;5(10):e13754. doi: 10.1371/journal.pone.0013754. [DOI] [PMC free article] [PubMed] [Google Scholar]
- 47.Rose T, Pillet AH, Lavergne V, Tamarit B, Lenormand P, Rousselle JC. Interleukin-7 compartmentalizes its receptor signaling complex to initiate CD4 T lymphocyte response. J Biol Chem. 2010;285(20):14898–908. doi: 10.1074/jbc.M110.104232. [DOI] [PMC free article] [PubMed] [Google Scholar] [Retracted]
- 48.Sweeney TE, Haynes WA, Vallania F, Ioannidis JP, Khatri P. Methods to increase reproducibility in differential gene expression via meta-analysis. Nucleic Acids Res. 2017;45(1):e1. doi: 10.1093/nar/gkw797. [DOI] [PMC free article] [PubMed] [Google Scholar]
- 49.Sweeney TE, Shidham A, Wong HR, Khatri P. A comprehensive time-course-based multicohort analysis of sepsis and sterile inflammation reveals a robust diagnostic gene set. Sci Transl Med. 2015;7(287):287ra71. doi: 10.1126/scitranslmed.aaa5993. [DOI] [PMC free article] [PubMed] [Google Scholar]


