Abstract
Non-alcoholic fatty liver disease (NAFLD) is the leading cause of chronic liver disease worldwide. NAFLD patients have excessive liver fat (steatosis), without other liver diseases and without excessive alcohol consumption. NAFLD consists of a spectrum of conditions: benign steatosis or non-alcoholic fatty liver (NAFL), steatosis accompanied by inflammation and fibrosis or nonalcoholic steatohepatitis (NASH), and cirrhosis. Given a lack of clinical biomarkers and its asymptomatic nature, NASH is under-diagnosed. We use electronic health records from the Optum Analytics to (1) identify patients diagnosed with benign steatosis and NASH, and (2) train machine learning classifiers for NASH and healthy (non-NASH) populations to (3) predict NASH disease status on patients diagnosed with NAFL. Summarized temporal lab data for alanine aminotransferase, aspartate aminotransferase, and platelet counts, with basic demographic information and type 2 diabetes status were included in the models.
Introduction
Non-alcoholic fatty liver disease (NAFLD) is one of the most common chronic liver diseases globally, with an estimated prevalence of around 25%1-3. NAFLD is marked by the presence of excessive hepatic steatosis (5% or more liver fat by weight) in patients with limited alcohol consumption and without other liver disease etiologies2. From a benign stage of excessive hepatic steatosis or non-alcoholic fatty liver (NAFL), patients can progress to non-alcoholic steatohepatitis (NASH), cirrhosis, and hepatocellular carcinoma (liver cancer)2,4,5. NAFL is defined as the presence of ≥ 5% steatosis without evidence of hepatocellular injury in the form of hepatocyte ballooning, whereas NASH is defined as the presence of ≥ 5% steatosis and inflammation with hepatocyte injury (e.g. ballooning), with or without any fibrosis. Upon development of advanced fibrosis, up to one third of NASH patients may progress to liver cirrhosis and other liver-related complications, such as liver cancer2,4,5. NASH has been recognized as one of the leading causes of cirrhosis in adults in the United States, and NASH-related cirrhosis is currently the second indication for liver transplants in the United States2,4,5. NASH is also linked to increased risk of mortality from cardiovascular diseases and cancers, likely due to its multi-system involvement, including a strong association with the metabolic syndrome2,5-7.
Despite the significant health burden of NASH, this disease is under-diagnosed due to lack of clear patient symptoms and lack of reliable biomarkers. Elevated alanine aminotransferase (ALT) and aspartate aminotransferase (AST) levels are the predominant finding in patients with NAFLD/NASH, but they do not correlate very well with disease progression.8 Several fibrosis and steatosis scoring techniques combine various laboratory-based parameters to facilitate the identification of NASH. The NAFLD fibrosis score (NFS) and the fibrosis-4 index (FIB-4) - recommended by the American Association for the Study of Liver Diseases, 2017 - are two widely accepted fibrosis scoring techniques and are often used to identify NASH patients with advanced fibrosis.2 Amongst the array of composite scores available to the clinician, the NFS and FIB-4 stand out in having a high diagnostic ability for advanced fibrosis (Area Under the Receiver Operating Characteristic Curve or AUROC of 80-85%), as compared to the other scoring systems, and have the advantage of using readily available clinical and biochemical parameters8. However, there is a need to intervene early and identify NASH patients with less extent of fibrosis, as various lifestyle changes can reverse the course of fatty liver disease9. Additionally, NAFLD takes place over a long period of time and none of these scores utilizes any longitudinal information for laboratory parameters in assessment of this liver condition. As a consequence, these scores are potentially missing valuable longitudinal disease signals and could be prone to erratic changes in considered lab values due to events such as medications and acute infections.
Increased access to patients’ electronic health records (EHRs) for research purposes has facilitated large-scale observational and machine learning studies in different disease areas, including NAFLD5,7,10-14. EHR databases contain records of patients’ basic demographic information, diagnoses codes and procedures, lab values and medication prescriptions, and can provide access to longitudinal history of patients’ biomarkers. While several studies have utilized patients’ longitudinal history for prediction of different outcomes15-17, there is a lack of machine learning (including deep learning) studies utilizing temporal characteristics of patients to gain insights into NAFLD.
In this study, we use one of the largest United States-based electronic health records resources, provided by Optum Analytics, to (i) create class-balanced cohorts of patients diagnosed with NASH and patients without liver-related diseases (‘Healthy’), (ii) perform supervised classification of NASH and Healthy cohorts by including as features basic demographic characteristics, type 2 diabetes status, and statistical summaries of temporal lab data (e.g. temporal mean) for ALT, AST, and platelet counts, and (iii) use the top performing model (see Table 3) to predict actual health status of a third cohort of patients, with benign fatty liver (NAFL).
Table 3:
Performance metrics of all the models reported as the mean (± standard error) obtained from a 5-fold cross validation technique. LR: Logistic Regression, DT: Decision Tree, RF: Random Forests, and XGB: XGBoost (a gradient boosted tree model)
 |
Methods
Cohort Selection
Healthcare Data: Optum’s Integrated Claims-Clinical dataset combines administrative claims and clinical data from providers across the continuum of care. Optum’s longitudinal clinical repository is derived from more than 50 healthcare provider organizations in the United States, that include more than 700 hospitals and 7000 clinics, treating more than 80 million patients receiving care in the United States. Optum’s dataset is statistically de-identified under the Expert Determination method consistent with HIPAA and only de-identified Electronic Health Record (EHR) data was provided by Optum for this research. The Optum EHR database contains information of labs, medication and diagnoses from general practitioners, specialty care and hospitalizations in the years of 2007-2017; medical conditions are recorded using International Classification of Diseases, Ninth and Tenth Revision (ICD-9 and ICD-10) codes.
Our analyses were limited to adult patients with availability of at least 3 and at most 200 observations of alanine aminotransferase, aspartate aminotransferase, and platelet counts each in their lab records; 200 is an arbitrary cut-off to exclude patients with long-term hospitalizations and extreme cases of NAFLD. For each patient, in each of their reported observation (3 ≤ nobs ≤ 200), the ALT, AST and PLT had to be taken on the same date to be included in our study. Patients with a diagnosis code of alcohol abuse (e.g ICD-10: F10.*, ICD-9: 305.*), alcoholic liver disease or other confounding liver diseases (such as hepatitis, autoimmune diseases) were excluded based on expert clinical guidance. We also excluded 2,300 patients with the most severe form of NAFLD, Cirrhosis, given by the ICD-9 code ‘571.5’ (described as NAFLD/Cirrhosis & Cirrhosis of liver without mention of alcohol). The final analytical sample and details on the inclusion/exclusion criteria for patients in our study are described in Figure 1. As seen in Table 1, there are specific ICD codes that describe various stages of NAFLD; the ICD-10 codes are specific to NAFL (K76.0) and NASH (K75.81), whereas the ICD-9 codes are more ambiguous and could represent either NAFL or NASH. Based on the ICD codes outlined in Table 1, the cohort labels were obtained as
Cases, ‘NASH’ (N = 17,359): Patients with at least 1 instance of the NASH specific code (K75.81) and one instance of any NAFLD code from Table 1
Controls, ‘Healthy’ (N = 6,891,092): Patients with zero occurrence of liver related diagnosis codes - healthy is only in the context of liver related conditions
At Risk, ‘NAFL’ (N = 73,190): Patients diagnosed with at least one instance of the ICD-10 code for benign fatty liver NAFL (K76.0), but none for NASH.
Figure 1:
Cohort preparation from United States-based electronic health records (EHRs) provided by Optum
Table 1:
International Classification of Diseases, Ninth and Tenth Revision (ICD-9 and ICD-10) codes specific to NAFL & NASH
 |
Since there are only 5% positive samples of NASH in our population of interest, and models trained on such im-balanced populations tend to achieve poor predictive accuracy in the minority class18, we randomly sub-sampled the healthy cohort to approximately match the number of NASH cases.
Feature Selection and Preparation
Statistical summaries of temporal lab data (e.g. temporal mean) for ALT, AST, and PLT were included in the classifiers, together with basic demographics information and type 2 diabetes status.
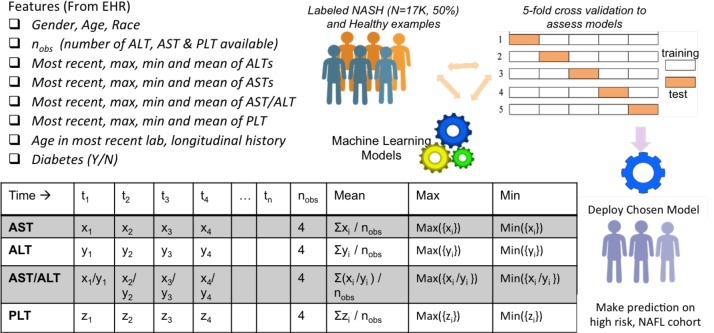
For each patient, we included their age, gender (male/female), race (available as Caucasians, African Americans, Asians and Others in the database), as well as their type 2 diabetes status (Y/N) (obtained using the diagnostic codes e.g. ICD-9: 250.00 and ICD-10: E11.9). These features were chosen based on prior epidemiological studies that noted their effect on prevalence and incidence of NAFLD.1,2 Remaining features for training the machine learning models were obtained by considering laboratory parameters routinely used in assessing NAFLD, and by considering their prevalence and quality in our database. Specifically, we considered two non-invasive fibrosis scores available for NAFLD/NASH, NAFLD Fibrosis Score (NFS) and fibrosis-4 index (FIB-4)2. Based on a regression formula, the NFS uses six variables, including age, hyperglycemia, body mass index (BMI), platelet count, albumin and the AST/ALT ratio. In its original study, with dual cut-offs, the NFS score was able to discriminate patients with advanced fibrosis (stage 3) from patients without (stages 0-2), with an area under the receiver operating characteristic curve (AUROC) of 0.82 (95%, CI 0.76-0.88)19. Despite employing only the AST, ALT and platelet counts, the FIB-4 is known to provide AUROC comparable to the NFS, but higher than various other scoring systems8. Except for BMI and albumin values, which were only available for approximately 70% of the study population, all other components used in the NFS and FIB-4 scores (ALT, AST, PLT, age, AST/ALT ) were readily available in our database. Additionally, we had access to over 8 million patients with multiple observations, nobs ≥ 3, of AST, ALT and platelet counts (See Figure 1). For each patient, valid observations required availability of AST, ALT and PLT on the same day; if multiple observations of a lab were available on the same day, the one with the latest timestamp was picked. To keep the machine learning models and features clinically interpretable, we incorporated temporality by utilizing the statistical summaries of lab values as features, as opposed to feeding entire temporal sequences to the model. For each patient, we employed the following features (total of 23) to the machine learning models (see Figure 2):
Demographics: Age, gender and race
Type 2 diabetes status: Y/N
Temporal Summaries: Number of valid observations (nobs), mean, minimum, maximum and most recent of ALT, AST, AST/ALT and PLT values available for each patient, Age_latest (Age in most recent lab result) and Longitudinal-history (≡ age in most recent lab result - age in oldest lab record).
Figure 2:
Features employed in supervised machine learning models for NASH
Due to the high prevalence of all selected features in the cohort, there were no missing values present in our data. We employed the popular ‘standard normalization’ to all the non-categorical features (all features except gender, race and diabetes status); standard normalization makes the values of each feature in the data have zero-mean and unit-variance.
Data Analytics and Machine Learning Infrastructure
The EHR data obtained from Optum are de-identified and stored in the Teradata format. We used an Amazon Web Services Elastic Compute Cloud (AWS EC2) instance of Dataiku (version 4.1.1) running a MapR distribution (D2.8x large, 36 cores). The pre-processing and cleaning of data were done using Apache Impala and Spark. All the machine learning models were implemented through scikit-learn (version 0.19.1), an open source machine learning library for the Python programming language.
Supervised Machine Learning Model Selection
We employed 4 popular machine learning models, Logistic Regression20, Decision Tree21, Random Forest22, and XG-Boost,23 to create NASH classifiers. The classifiers learnt functions that mapped features of a patient (Figure 2) to the probability that a given patient belonged to the class NASH. The top performing classifier was then used for mapping new examples from the NAFL cohort into NASH/Healthy categories. A classifier’s evaluation is most often based on its prediction accuracy, the percentage of correct predictions divided by the total number of predictions. This accuracy needs to be obtained with examples the classifier was not trained on (usually referred to as out-of sample accuracy). One of the commonly used practices in reporting a model’s performance is the train-test split method: split the data randomly to create a training set (usually 70-80%) for model training and a test set for reporting the model’s performance or accuracy.20,24,25 However, with this approach, the model’s evaluation can have a high variance, as it heavily depends on how the split was performed and on sampling biases.
K-fold Cross Validation: In a more robust technique, known as k-fold cross-validation, the training set is divided into k mutually exclusive and equally-sized subsets, and for each subset the classifier is trained on the union of all other subsets.24 The average of the error rate of each subset is, therefore, an estimate of the error rate of the classifier. Every data point gets to be in a test set exactly once, and gets to be in a training set k-1 times. The variance of the resulting estimate is reduced as k is increased. We employed the k-fold cross validation technique, using 5 folds to report accuracies and for comparing multiple supervised machine learning models.
Performance Metrics: A classifier produces a probability that a given object belongs to a class (e.g. that NASH is true). The threshold (or “cut-off”) is the specified probability (often 0.5), beyond which the prediction is considered positive; if set too low, it may predict true too often, if set too high, too rarely. Based on the threshold, if the instance is positive and it is classified as positive, it is counted as a true positive (TP), and if it is classified as negative, it is counted as a false negative (FN). If the instance is negative and it is classified as negative, it is counted as a true negative (TN); if it is classified as positive, it is counted as a false positive (FP). There are well established performance metrics that can be used to compare models using the above 4 possibilities in comparing actual values to the predicted values (TP, FN, TN and FP)23. Note that a performance metric should ideally be obtained on a test set (containing data the model is not trained on) and in case of k-fold cross validation, the average of a metric from each test set is reported. We employed frequently used performance measures, described below (the subscript c represents that it is a cut-off dependent measure):
Accuracy: Proportion of correct predictions (positive and negative) in the test set,
Precision: Proportions of positive predictions that were indeed positive,
Recall or Sensitivity: Proportion of actual positive values found by the classifier,
F-measure: Harmonic mean between Precision and Recall,
Matthews Correlation Coefficient (MCC): Correlation coefficient between actual and predicted values (+1 = perfect, 0 = no correlation, -1 = perfect anti-correlation),
Receiver Operating Characteristic (ROC) curve: The true positive rate versus the false positive rate resulting from different cutoffs in the predictive model. The area under ROC curve, AUROC, is a widely used metric for performance evaluation, as it is cut-off independent.
Logarithmic-loss (Log loss): Quantification for the accuracy of a classifier, computed by penalizing false classifications. It is a cut-off independent metric given by: . Here, N is the number of training samples, and, for a training instance, is a binary indicator for the correct label (1 = NASH), and pi is the model’s predicted probability for NASH.
Results and Discussion
Performance of Supervised Machine Learning Models
This study focused on creating machine learning classifiers for NASH and healthy (non-NASH) populations, with the goal to predict actual health status in patients with benign fatty liver (the NAFL cohort). We were interested in evaluating the contribution of each model feature for NASH prediction, especially for features with longitudinal signals (e.g. longitudinal mean of ALT values). Therefore, we included in our study interpretable models, such as Logistic Regression and Decision Tree, together with less interpretable ensemble models, such as Random Forrest and Gradient Boosted Trees, which can usually perform better on various metrics.20,23 The performance metrics from 4 popular machine learning classifiers, Logistic Regression20, Decision Tree21, Random Forest22, and XG-Boost23 are included in Table 3. From Table 3, it is clear that while all classifiers perform well at classifying positive and negative examples of NASH, we gain performance boost at the cost of interpretability with the XGBoost model, which shows an AUROC of 88%.
Logistic Regression Model: Since the Logistic Regression model is a linear classifier (i.e. it computes the target feature as a linear combination of input features), it may miss out on non-linearity inherent to the classification task and hence, has the least impressive AUROC of 83.5%. The Logistic Regression model picks diabetes status as one of the most important features, with highest (negative) predictive value for NASH. This finding corroborates with prior EHR-based studies that found bi-directional association of NASH with type 2 diabetes2,5. Consistent with the widely popular NFS-score, the most important laboratory-based parameter identified from this model is the mean value of longitudinal AST/ALT ratio2,8.
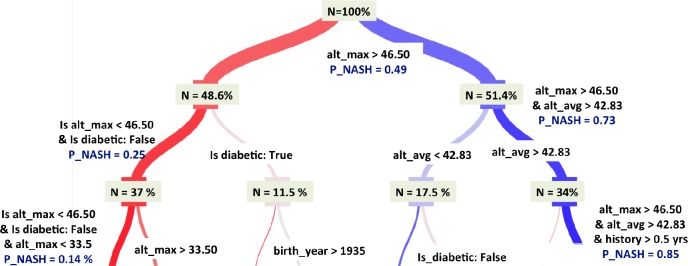
Decision Tree (DT) Model: Decision tree is arguably one of the simplest and most interpretable non-parametric algorithms21. It predicts the value of the target by learning simple decision rules inferred from the data features; the rules then form a tree, with the leaves of the tree carrying the predicted class. We performed hyperparameter tuning for the tree-depth through grid search; a tree depth of 5 gave the best performance and was selected for this study. Figure 3 highlights the decisions made in the top three branches of this tree and the relative importance of all the features. Specifically, the tree selects the longitudinal maximum of ALT values as the most important feature, followed by diabetes status and ALT_mean. While the importance of ALT_mean may lie in mitigating the effect of erratic values, the fact that ALT_max is equally or more important, indicates the importance of temporal trends in NASH classification.
Figure 3:
The top three branches of the Decision Tree model (with tree-depth = 5) highlights the decision making process and the relative importance of the various variables.
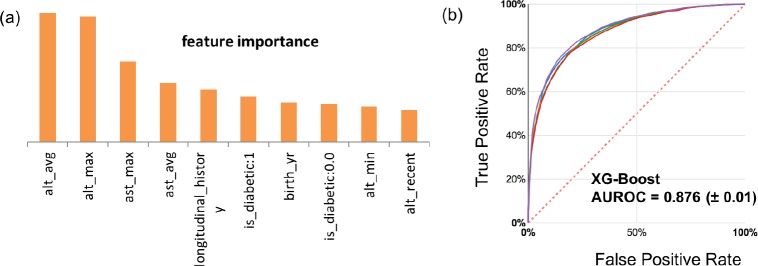
Random Forest (RF) Model: As seen from Table 3, Random forest outperforms both logistic regression and decision tree in all metrics; however, the decision-making process is not as interpretable as for the single decision tree. A random forest is a meta estimator that fits a number of decision tree classifiers on various sub-samples of the dataset and uses averaging to improve the predictive accuracy and control over-fitting. When training a tree, it can be computed how much each feature decreases the weighted impurity in a tree. For a forest, the impurity decrease from each feature can be averaged and the features are ranked according to this measure22. Figure 4(a) includes the list of most important features from the random forest model.
Figure 4.
(a) Top 10 features obtained from the “mean decrease impurity” method of feature ranking from the Random Forest model. (b)The Receiver Operator Characteristic (ROC) curves for the 5 test-folds for the best performing XGBoost classifier.
XGBoost (XGB) Model: Gradient boosting is a technique which produces a prediction model in the form of an ensemble of “weak” prediction models (small decision trees); XGBoost is an advanced gradient tree boosting algorithm with support for parallel processing, regularization and early stopping, which makes it a fast, scalable and accurate algorithm23. The hyperparameters of the XGBoost model were tuned using a grid search optimization on 100 combinations of 5 parameters. As seen in Table 3, XGBoost outperforms other machine learning models in each metric. The ROC curve for the XGBoost model is included in Figure 4(b).
Results using alternative Healthy group: We repeated the classification task on a different set of healthy controls (N=17,500 randomly selected from the population without any NAFLD ICD codes described in Figure 1). The 5-fold cross-validation AUROCs of various models on this second control group were: LR (0.835±0.011), DT (0.842±0.011), RF (0.87 ± 0.01), and, XGBoost (0.88 ± 0.01). As seen from Table 3, the performance of none of the models is affected by selecting a different control group.
Performance of Models upon Excluding Longitudinal Features: We assessed the performance of various machine learning models upon exclusion of longitudinal features (e.g. statistical summaries of AST, ALT, AST/ALT and PLT). To predict NASH from a cohort of NASH and Healthy patients, these models were trained on the most recent values of AST, ALT, AST/ALT and platelet counts, along with demographic information (Gender, Age, Race, Diabetic (Y/N)). As seen in Figure 5, the performance (cross-validated AUROC) of all supervised machine learning models in classifying NASH versus Healthy declined (by 5%) upon exclusion of longitudinal features (red bars). Whereas, upon only retaining temporal summaries of ALT (mean, min and max) along with demographic features, the classifiers only slightly underper-form (blue bars) relative to the models containing all features (green bars); the choice of ALT for this analysis was made based on top performing features in Figure 4a. Figure 5 indicates that temporal summaries of a single lab, ALT, provide more information than only the recent values of multiple lab values.
Figure 5.
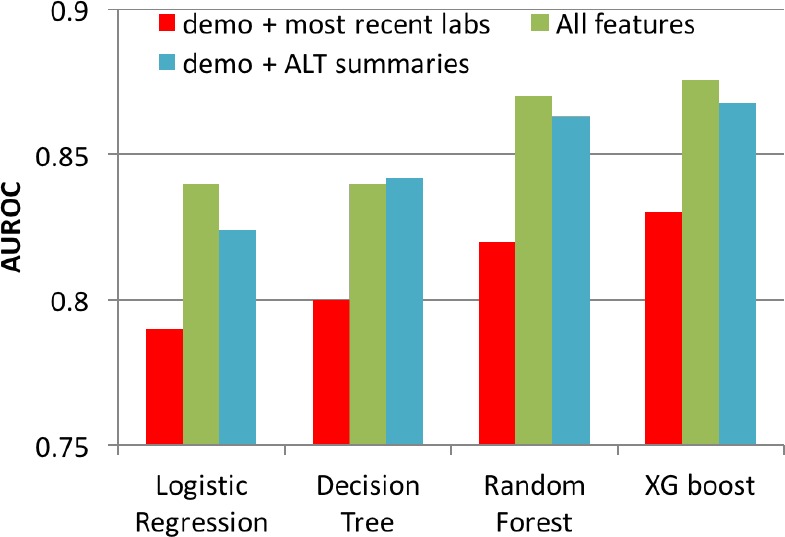
AUROC of machine learning models by including and excluding longitudinal features. Demographic features (Demo: Gender, Age, Race, Diabetic (Y/N) were included as features in all models).
Prediction on NAFL cohort
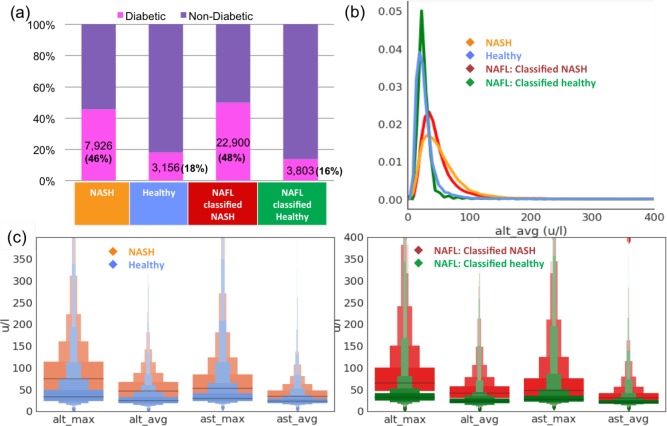
As summarized in Table 3, the best performing model for NASH, XGBoost, had an out-of-sample (cross-validated) AUROC of 88%; this value is higher than most of the available scoring techniques in identifying NASH patients. In this section, we use the XGBoost model on a third cohort diagnosed with benign fatty liver (NAFL), to identify those patients with a high probability of being at a more advanced disease stage (NASH). We used a cut-off of 0.5 while making predictions; however, different cut-offs can be used to improve sensitivity and specificity. For instance, a cut-off of 0.25 increases the sensitivity to 92% at the expense of precision (at 68%). Out of 73,190 patients identified as NAFL, 45,797 (62.57%) were classified as NASH, while 27,393 (37.43 %) were classified as healthy (not NASH). In figure 6, we compare the characteristics of NAFL patients classified as NASH versus NAFL patients classified as healthy. As shown in Figure 6(a), the prevalence of type 2 diabetes is extremely high and comparable (> 45%) between the actual NASH cohort and the NAFL cohort tagged as NASH via the classifier. This is consistent with the reported prevalence of type 2 diabetes in NASH in multiple studies2,5-7. Similarly, the reported prevalence of type 2 diabetes in the general population is around 10-15%, consistent with prevalence of 16% in the NAFL cohort tagged as healthy via the classifier. Since the temporal average and max of the ALT and AST values were identified as the most important features by the classifier (Figure 4(a)), we also compared their histograms for the NAFL cohorts identified as NASH or healthy in Figure 6(b). Figure 6(c) includes distributions of relevant lab-based longitudinal parameters, summarized in the ‘Letter Value’ box-plots26 indicating the various quartiles of the distribution.
Figure 6:
XGBoost classifier’s predictions on the Optum EHR NAFL cohort (a) Prevalence of diabetes in the NAFL cohort classified as NASH is significantly higher than in the NAFL cohort classified as Healthy. (b) The distributions of longitudinal average of ALT values (most important lab-based feature learnt from classifier), ‘alt avg’, for the NASH patients is similar to the distribution in NAFL patients classified as NASH. (c) Distributions of relevant labbased longitudinal parameters are summarized in the Letter Value box-plots26 indicating the various quartiles of the distribution (grey lines correspond to the middle-quartiles or the medians).
Study Limitations and Future Directions
Complete data regarding patients’ alcohol intake is unlikely to be available in EHR-based resources; therefore, the NASH cohort described in this study may include patients with a history of alcohol consumption inaccurately diagnosed with NASH. Since NASH is often under-diagnosed in electronic health records, there could be additional incorrectly labeled examples in our training data, affecting the performance of the classifiers. Patient characteristics, such as BMI (Body Mass Index) and waist circumference, are known to have associations with NAFLD2. Nonetheless, we have not included either of these in our current study due to heterogeneity of these variables (e.g. lack of timely data given used lab dates, amount of data cleaning required to ensure accurate values). As opposed to using temporal raw inputs of various labs, we used temporal summaries. This approach helped keep the features clinically interpretable, while still demonstrating the value of EHR based resources in disease classification. This study does not include more powerful aspects of temporality, such as slow versus fast progression of NASH, which will be part of future studies. Finally, it would be ideal to confirm performance of our top classifier through liver biopsies, considered the gold-standard for NAFLD identification, as ICD codes may not be as specific and sensitive2. However, to achieve this goal, we would need access to biopsy data, which is not available for the Optum EHR resource and would require access to other resources.
Conclusion
Given the suboptimal diagnostic performance of isolated biomarkers (e.g. serum AST orALT levels) fordistinguishing NASH from simple steatosis, several algorithms that combine different parameters have been developed. However, these algorithms rely on lab-based parameters taken at a single point in the patient’s history, potentially missing valuable longitudinal disease signals and are prone to erratic changes in the lab values due to medications or acute infections. Electronic health records provide a unique opportunity for employing multiple observations recorded in the patient’s longitudinal history. We employed one of the largest US-based EHR resources (provided by Optum Analytics) to better understand NAFLD patients. We used ICD diagnostic codes to identify NASH and Healthy (no liver related etiology) cohorts with more than two observations of AST, ALT and platelet counts. We utilized longitudinal statistical properties of lab-based parameters (e.g. mean of all ALT values) to create supervised machine learning models trained on NASH and Healthy patients; the cross-validated AUROC of various models ranged from 83%-88%. Despite using fewer biomarkers, our classifiers perform better than most of the non-invasive techniques currently in practice for diagnosing NASH2. The performance of each of our classifiers significantly declined upon omitting the longitudinal summaries of lab values as input features, highlighting the importance of longitudinal features in the prediction of NASH. As an application of our classifier, we employed the top classifier (XGBoost with AUROC of 88%) to make prediction of NASH on a third cohort of benign fatty liver (NAFL) patients. Once all patients in a database are tagged as likely to be NASH, clinicians may choose to have more frequent interactions with these patients, confirm diagnosis via biopsy, and, when appropriate, raise awareness on upcoming treatments. Consistent with recorded prevalence of diabetes5, the NAFL cohort classified as NASH using our model had significantly higher prevalence of diabetes (48%) when compared to those classified as Healthy (18%).
Table 2:
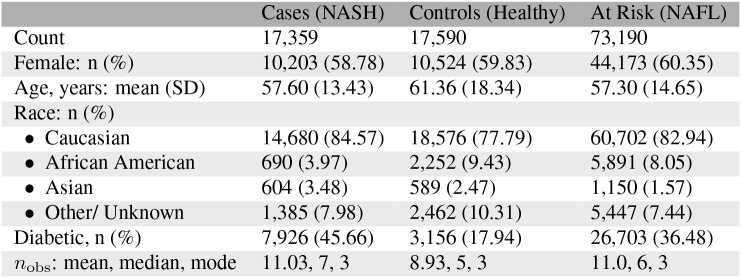
Cohort Characteristics
 |
References
- 1.Younossi Zobair M., Koenig Aaron B., Abdelatif Dinan, Fazel Yousef, Henry Linda, Wymer Mark. Global epidemiology of nonalcoholic fatty liver disease-meta-analytic assessment of prevalence, incidence, and outcomes. Hepatology. 2016 Feb;64(1):73–84. doi: 10.1002/hep.28431. [DOI] [PubMed] [Google Scholar]
- 2.Chalasani Naga, Younossi Zobair, Lavine Joel E., Charlton Michael, Cusi Kenneth, Rinella Mary, Harrison Stephen A., Brunt Elizabeth M., Sanyal Arun J. The diagnosis and management of nonalcoholic fatty liver disease: Practice guidance from the american association for the study of liver diseases. Hepatology. 2017 Sep;67(1):328–357. doi: 10.1002/hep.29367. [DOI] [PubMed] [Google Scholar]
- 3.Kaikkonen Jari E., Würtz Peter, Suomela Emmi, Lehtovirta Miia, Kangas Antti J., Jula Antti, Mikkila Vera, Viikari Jorma S.A., Juonala Markus, Ronnemaa Tapani, et al. Metabolic profiling of fatty liver in young and middle-aged adults: Cross-sectional and prospective analyses of the young finns study. Hepatology. 2016 Dec;65(2):491–500. doi: 10.1002/hep.28899. [DOI] [PMC free article] [PubMed] [Google Scholar]
- 4.Wong Robert J., Cheung Ramsey, Ahmed Aijaz. Nonalcoholic steatohepatitis is the most rapidly growing indication for liver transplantation in patients with hepatocellular carcinoma in the u.s. Hepatology. 2014 Apr;59(6):2188–2195. doi: 10.1002/hep.26986. [DOI] [PubMed] [Google Scholar]
- 5.Anstee Quentin M, Targher Giovanni, Day Christopher P. Progression of nafld to diabetes mellitus, cardiovascular disease or cirrhosis. Nat Rev Gastroenterol Hepatol. 2013 Jun;10(6):330–344. doi: 10.1038/nrgastro.2013.41. [DOI] [PubMed] [Google Scholar]
- 6.Yang Kuen Cheh, Hung Hui-Fang, Lu Chia-Wen, Chang Hao-Hsiang, Lee Long-Teng, Huang Kuo-Chin. Association of non-alcoholic fatty liver disease with metabolic syndrome independently of central obesity and insulin resistance. Scientific Reports. 2016 Jun;6(1) doi: 10.1038/srep27034. [DOI] [PMC free article] [PubMed] [Google Scholar]
- 7.Corey Kathleen E, Kartoun Uri, Zheng Hui, Chung Raymond T, Shaw Stanley Y. Using an electronic medical records database to identify non-traditional cardiovascular risk factors in nonalcoholic fatty liver disease. The American Journal of Gastroenterology. 2016 Mar;111(5):671–676. doi: 10.1038/ajg.2016.44. [DOI] [PMC free article] [PubMed] [Google Scholar]
- 8.Cheah Mark CC, McCullough Arthur J, Goh George Boon-Bee. Current modalities of fibrosis assessment in non-alcoholic fatty liver disease. Journal of Clinical and Translational Hepatology. 2017 Jun;5(261-271):1–11. doi: 10.14218/JCTH.2017.00009. [DOI] [PMC free article] [PubMed] [Google Scholar]
- 9.Ekstedt Mattias, Hagstrom Hannes, Nasr Patrik, Fredrikson Mats, Stal Per, Kechagias Stergios, Hultcrantz Rolf. Fibrosis stage is the strongest predictor for disease-specific mortality in nafld after up to 33 years of follow-up. Hepatology. 2015 Mar;61(5):1547–1554. doi: 10.1002/hep.27368. [DOI] [PubMed] [Google Scholar]
- 10.Loomis A. Katrina, Kabadi Shaum, Preiss David, Hyde Craig, Bonato Vinicius, Louis Matthew St., Desai Jigar, Gill Jason M. R., Welsh Paul, Waterworth Dawn, et al. Body mass index and risk of nonalcoholic fatty liver disease: Two electronic health record prospective studies. The Journal of Clinical Endocrinology & Metabolism. 2016 Mar;101(3):945–952. doi: 10.1210/jc.2015-3444. [DOI] [PMC free article] [PubMed] [Google Scholar]
- 11.Corey Kathleen E., Kartoun Uri, Zheng Hui, Shaw Stanley Y. Development and validation of an algorithm to identify nonalcoholic fatty liver disease in the electronic medical record. Digestive Diseases and Sciences. 2015 Nov;61(3):913–919. doi: 10.1007/s10620-015-3952-x. [DOI] [PMC free article] [PubMed] [Google Scholar]
- 12.Goldstein Benjamin A, Navar Ann Marie, Pencina Michael J, Ioannidis John P A. Opportunities and challenges in developing risk prediction models with electronic health records data: a systematic review. Journal of the American Medical Informatics Association. 2016 May;24(1):198–208. doi: 10.1093/jamia/ocw042. [DOI] [PMC free article] [PubMed] [Google Scholar]
- 13.Yip T. C.-F, Ma A. J, Wong V. W.-S, Tse Y.-K, Chan H. L.-Y, Yuen P.-C, Wong G. L.-H. Laboratory parameter-based machine learning model for excluding non-alcoholic fatty liver disease (nafld) in the general population. Alimentary Pharmacology & Therapeutics. 2017 Jun;46(4):447–456. doi: 10.1111/apt.14172. [DOI] [PubMed] [Google Scholar]
- 14.Perveen Sajida, Shahbaz Muhammad, Keshavjee Karim, Guergachi Aziz. A systematic machine learning based approach for the diagnosis of non-alcoholic fatty liver disease risk and progression. Scientific Reports. 2018 Feb;8(1) doi: 10.1038/s41598-018-20166-x. [DOI] [PMC free article] [PubMed] [Google Scholar]
- 15.Singh Anima, Nadkarni Girish, Gottesman Omri, Ellis Stephen B., Bottinger Erwin P., Guttag John V. Incorporating temporal ehr data in predictive models for risk stratification of renal function deterioration. Journal of Biomedical Informatics. 2015;53:220–228. doi: 10.1016/j.jbi.2014.11.005. [DOI] [PMC free article] [PubMed] [Google Scholar]
- 16.Lasko Thomas A., Denny Joshua C., Levy Mia A. Computational phenotype discovery using unsupervised feature learning over noisy, sparse, and irregular clinical data. PLoS ONE. 2013 Jun;8(6):e66341. doi: 10.1371/journal.pone.0066341. [DOI] [PMC free article] [PubMed] [Google Scholar]
- 17.Mani Subramani, Chen Yukun, Elasy Tom, Clayton Warren, Denny Joshua. AMIA Annual Symposium Proceedings. 2012 2012. Type 2 diabetes risk forecasting from emr data using machine learning; pp. 606–615. [PMC free article] [PubMed] [Google Scholar]
- 18.Batista Gustavo E. A. P. A., Prati Ronaldo C., Monard Maria Carolina. A study of the behavior of several methods for balancing machine learning training data. SIGKDD Explor. Newsl. 2004 Jun;6(1):20–29. [Google Scholar]
- 19.Angulo Paul, Hui Jason M, Marchesini Giulio, Bugianesi Ellisabetta, George Jacob, Farrell Geoffrey C, Enders Felicity, Saksena Sushma, Burt Alastair D, Bida John P, Lindor Keith, Sanderson Schuyler O, Lenzi Marco, Adams Leon A, Kench James, Therneau Terry M, Day Christopher P. The nafld fibrosis score: a noninvasive system that identifies liver fibrosis in patients with nafld. Hepatology. 2007 Apr;45(4):846–854. doi: 10.1002/hep.21496. [DOI] [PubMed] [Google Scholar]
- 20.Kotsiantis Sotiris B, Zaharakis I, Pintelas P. Supervised machine learning: A review of classification techniques. Emerging artificial intelligence applications in computer engineering. 2007;160:3–24. [Google Scholar]
- 21.Safavian S Rasoul, Landgrebe David. A survey of decision tree classifier methodology. IEEE transactions on systems, man, and cybernetics. 1991;21(3):660–674. [Google Scholar]
- 22.Breiman Leo. Random forests. Machine Learning. 2001 Oct;45(1):5–32. [Google Scholar]
- 23.Chen Tianqi, Guestrin Carlos. CoRR. 2016. Xgboost: A scalable tree boosting system. abs/1603.02754. [Google Scholar]
- 24.Kohavi Ron, et al. Ijcai. volume 14. Canada: Montreal; 1995. A study of cross-validation and bootstrap for accuracy estimation and model selection; pp. 1137–1145. [Google Scholar]
- 25.Nasrabadi Nasser M. Pattern recognition and machine learning. Journal of electronic imaging. 2007;16(4):049901. [Google Scholar]
- 26.Hofmann Heike, Wickham Hadley, Kafadar Karen. Letter-value plots: Boxplots for large data. Journal of Computational and Graphical Statistics. 2017;26(3):469–477. [Google Scholar]


