Abstract
This study assessed the feasibility of automating the generation of the outpatient encounter summary. We reviewed screen tracking video and log-file metadata from electronic health record (EHR) interactions based on two simulated encounters. We mapped the sequence of metadata to key concepts in the video to assess the precision with which the log files aligned with user activity and to generate the Breadcrumbs encounter summary (BES). The BES captured all interactions documented in clinical notes with the exception of the physical exam. The videos addressed all Evaluation and Management (E/M) requirements, while the log files did not contain the physical exam. The BES was as comprehensive as the gold standard visit summary. The BES offers a promising method for the collection and compilation of necessary elements of outpatient clinical documentation. The combination of log files and video could provide evidence of EHR activity satisfying documentation requirements.
Introduction
Clinical documentation remains a time-consuming task for many providers, with one recent study indicating that providers spend an average of two hours working in the electronic health record (EHR) for every hour of direct patient contact. This amounts to about forty-nine percent of total work time and thirty-seven percent of exam room time. In addition, some physicians claim they spend one to two hours of personal time working on the EHR.1 The onerous processes associated with physician documentation contribute to provider burnout.2
While providers may be inclined to abbreviate their documentation to improve their overall efficiency, the accuracy and completeness of a provider’s documentation become particularly impactful when viewing clinical documentation in light of the False Claims Act (FCA). Under the FCA, lawsuits can be filed on behalf of the government against physicians, based on a “preponderance of the evidence,” or proof of probable violation if a physician’s note does not accurately reflect services that have been billed. A physician may risk severe penalties unless sufficient evidence refuting these claims can be produced. Clinical notes are vital sources of evidence in these situations.3
Several approaches have been employed to improve the efficiency of clinical documentation. The first approach, copy and paste, is the practice of copying text from a section in the EHR and pasting it verbatim in another. Sixty-six to ninety percent of clinicians use copy and paste to complete documentation.4 However, this practice is associated with unnecessary detail, internal inconsistencies, and error propagation.4 Another method is the dictation of clinical notes. Although speech recognition has increased productivity, foreign accents and background noise have presented challenges for its successful implementation. When words are misunderstood, additional time is required to correct these errors.5 Finally, some practices employ scribes to assist the physician with documentation. Working with a scribe may enable a provider to complete their documentation more efficiently and see more patients, but disputes over the scribe’s role in computerized patient order entry raise critical questions concerning physician accountability for a scribe’s actions. The scribe industry is projected to rapidly grow to one scribe for every nine physicians by 2020, but the costs of hiring and training scribes will also continue to increase.6 While each of these approaches can facilitate clinical documentation, each also increases the risk of creating unreliable documentation.
One strategy that has not been well studied involves using the metadata that is a byproduct of EHR activity, and that is commonly generated by these systems. In the EHR, metadata stored in log files include key click information, records of user input, and headers of user interface pages. Timestamps and usernames that correspond to activities performed and items selected can be used to describe user activity. Recent studies of clinical score automation using EHRs and workflow analysis using telephone records have strongly implicated a role for metadata as an information resource.7,8 Software that collects metadata can provide numerous clues about users. We sought to understand how metadata generated in the course of a clinical encounter might be utilized to construct an encounter summary. Our hypothesis was that these “breadcrumbs” created a roadmap that could be used to recapitulate the relevant components of the clinical encounter.
Objectives
This study assessed the feasibility of automating the outpatient encounter summary. Specifically, we aimed to (1) determine how well log files captured EHR interactions, (2) extract, interpret, and map those log file entries that correspond to key EHR interactions related to billing concepts, and (3) compare the generated Breadcrumbs concepts to concepts in a standard clinical note created by a physician based on the same encounter.
Methods
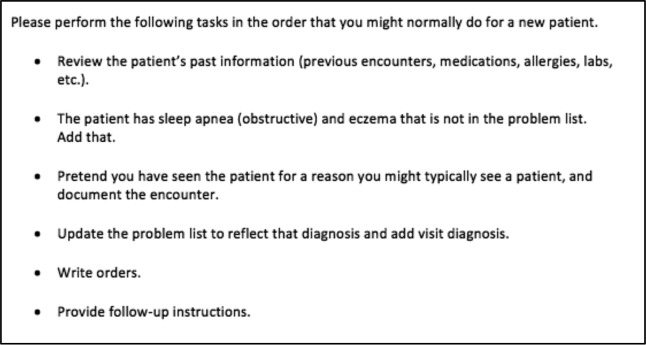
We used data collected from the Vanderbilt University Medical Center (VUMC) EHR test system, powered by Epic©. These data were previously generated to test the training materials designed to familiarize providers with the new EHR. Two VUMC providers followed training scripts during a simulated outpatient encounter in a usability lab. The providers performed tasks and verbalized their thought processes using a think-aloud method.9 Video and audio of their computer screens and interactions were recorded. The training script encouraged providers to follow their typical workflow for ambulatory office visits (Figure 1). Activity was logged in the EHR’s test environment.
Figure 1.
Training script for outpatient encounters. Participants were encouraged to perform the indicated tasks as they generally would in practice.
We reviewed the screen tracking videos alongside corresponding metadata from log files. We used R (version 3.4.1) and Python (version 2.7.10) to extract and process information from these log files. This study received exemption from the IRB.
The log files contain only the information that the EHR is designed to record as metadata. This metadata describes user activity in terms of clicks and items accessed in the EHR. We compiled data from three of the vendor’s logging tools: the User Action Log (UAL), the Clinical Audit Trail, and Clarity tables. Each tool logs the user, date, and timestamp associated with each action.
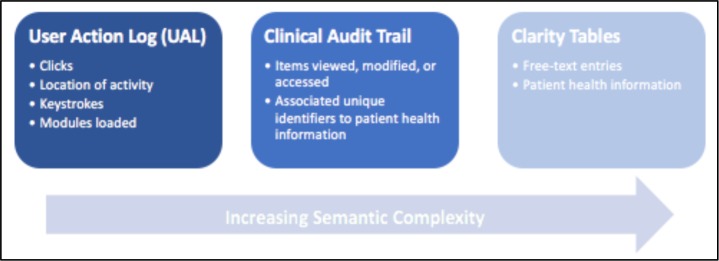
The primary difference among these tools is their inherent semantic complexity, or comprehensiveness in conveying information (Figure 2). Semantic complexity describes the extent to which the specific EHR interaction is intelligibly captured. Entries of higher semantic complexity provide context for a more understandable and detailed description of the interaction, whereas those of lower semantic complexity contain click-level information that is not unique to the interaction. We observed semantic complexity ranging from single words indicating the types of actions taken in the UAL to short sentences explaining the results of these actions in the Clinical Audit Trail to several sentences of patient health information in Clarity tables.
Figure 2.
Three sources of EHR metadata. From the least to the most semantically complex, the UAL describes click-level activity using single words, the Clinical Audit Trail explains the results of EHR interactions using short sentences, and the Clarity tables store multiple sentences containing patient health information.
The least semantically complex logging tool we used is the UAL, which was designed as a troubleshooting tool for EHR developers. The UAL records click-level data as different types of actions. The actions we found particularly useful included workspace (revealed if the user was looking at the patient chart or appointment schedule screen), mouse click (indicated mouse button and coordinates of click), keystroke (pinpointed key type: data entry, number pad, navigation, etc.), and activity (corresponded to the user interface header).
More semantically complex is the Clinical Audit Trail tool, which was developed for tracking activity within patient charts. The Clinical Audit Trail interprets click-level information about important events in encounters (e.g. items viewed or modified during chart review) and provides details about them (e.g. names and unique identifiers of items). It records encounter-specific information such as patient reports viewed, items modified, notes signed, and orders placed.
The most semantically complex are the Clarity tables. These tables contain information that is extracted nightly from the EHR. These tables elaborate on the content of items the Clinical Audit Trail merely references by name (e.g. the actual free-text of a clinical note, rather than simply its unique identifier).
1. Construction of the Breadcrumbs encounter summary from metadata in log files
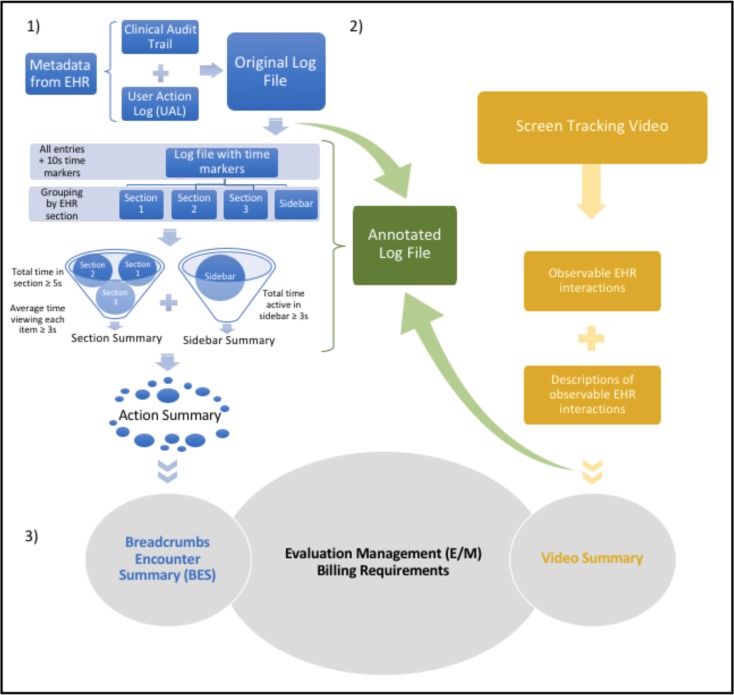
Figure 3.1 illustrates the steps for constructing the Breadcrumbs encounter summary (BES) from metadata. We combined the Clinical Audit Trail data with the UAL data to create a log file. We added two seconds to the timestamps in the UAL to account for the two-second time discrepancy between the server (the Clinical Audit Trail and Clarity tables) and client system (UAL) times. In addition to recording the more passive interactions that the Clinical Audit Trail did not include, the UAL provided a clearer indication of the EHR section in which the user was engaging.
Figure 3.
Steps for generating the Breadcrumbs encounter summary. 1) Construction of the BES from metadata in log files. The original log file was compiled from metadata in the Clinical Audit Trail and UAL. Ten- second time markers and time spent in each EHR section were utilized to evaluate the continuity and significance of recorded interactions. Relevant EHR interactions were extracted into the action summary and integrated into the BES. 2) Mapping observed EHR interactions to those recorded in the log-file metadata. The screen tracking video was referenced to create the annotated log file, which described observable interactions that were linked to metadata in the original log file. Significant EHR interactions that were visible in the video were outlined in the gold standard visit summary, which was created by a physician who had viewed the video. 3) Comparison of E/M billing requirements satisfied by the log file and video. The billing requirements satisfied by the BES and the gold standard visit summary respectively were compared.
We grouped entries by the instant each activity section had been accessed (as defined by the Activity column of the UAL), since users often moved back and forth among sections. The activity sections generally matched the EHR tab selected (e.g. Chart Review, Notes, Plan). We included an additional group to track the sidebar activity logged.
Accurately measuring the time spent in each EHR section entailed accounting for lapses in EHR activity throughout the clinical encounter. Gauging activity continuity from our metadata was a feature we recognized to be particularly important for our BES to capture, since physicians might intermittently interact with patients before returning to the EHR during encounters. To establish temporal and contextual criteria per the UAL for sustained activity, we incremented ten-second markers spanning from the instant the user logged in until the moment the user logged out. These markers indicated whether or not the user provided any signs of EHR activity during the preceding ten seconds, including the upper bound of the interval. The user was deemed active if the previous ten seconds of the UAL logged any mouse clicks, keystrokes, or closing of modals, which are subordinate pop-up windows. If a modal was left open from a previous ten-second time interval, the user was given a maximum of thirty seconds to log one of the aforementioned activities before the marker reflected inactivity. The total time spent in each section was calculated and adjusted for any idleness reflected by the ten-second markers.
We delineated criteria for extracting only the purposeful, noteworthy interactions within individual EHR sections into the BES. In each activity section, the user had to (1) remain in the section for at least five seconds and (2) spend at least an average of three seconds viewing each item. Total time spent in each section was recalculated for every period the section was reopened. For (2), we assumed that the user spent, on average, an equal amount of time viewing each item. Entries that met these criteria were extracted into our action summary.
We executed multiple string searches to extract pertinent entries from the action summary to their respective locations in the BES. To extract items accessed during chart review, we searched for the keywords viewed, reviewed, displayed, and accessed in the columns describing the actions. Likewise, we used the keywords modified, selected, and accepted to pinpoint the items modified during chart review. The keywords actions taken, note, diagnoses modified, order, follow-up, and sign were used to find entries about Best Practice Advisories, the note, new diagnoses, orders, follow-up instructions, and the signing of the encounter, respectively. When information in the log file was insufficient (e.g., if an entry claimed an item had been modified but did not elaborate on the modification itself), we extracted details from Clarity tables.
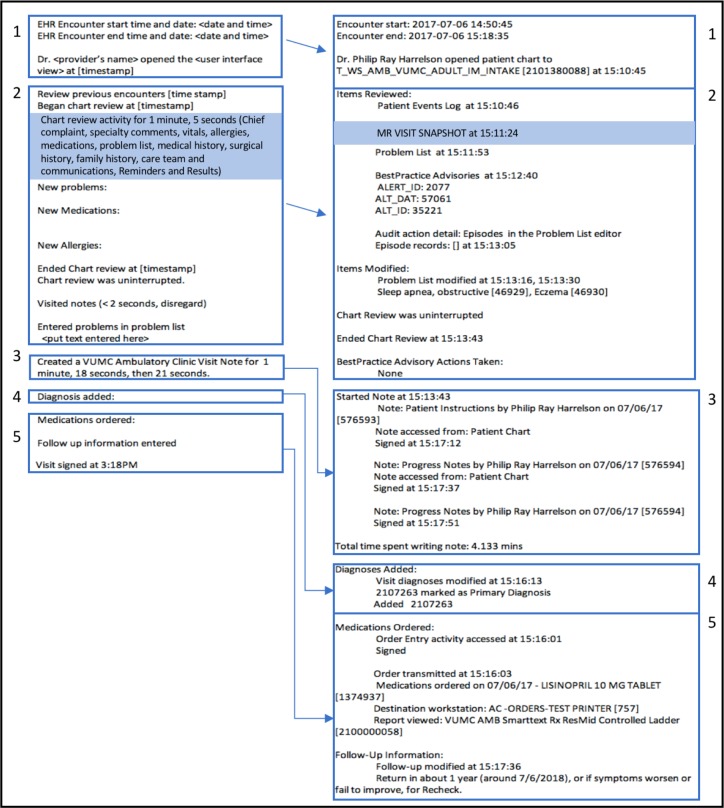
Our BES recorded the start and end times of the encounter and the moment the patient’s chart had been opened. The items viewed during chart review were listed, followed by those items (e.g., a problem list entry) that had been modified. The BES also indicated whether or not chart review had been interrupted and any actions taken to address Best Practice Advisories. We showed the times at which the clinician started and finished writing the clinical note. Diagnoses added, medications ordered, and follow-up information entered were all included, along with their corresponding identifiers at the end of the BES.
2. Mapping observed EHR interactions to those recorded in the log-file metadata
To map the EHR interactions in the screen tracking videos to the log-file metadata, we reviewed the videos and manually annotated each log file entry with the specific EHR interaction. We named this document our annotated log file (Figure 3.2). We referenced our annotated log file to fine-tune and validate the temporal criteria that we previously intuitively estimated in (1) for the extraction of interactions from our log file to our BES. Our goal was to incorporate all of the relevant EHR interactions that were supported by the video into our BES: namely, to ensure that the BES captured all significant interactions from the video and did not describe any activity that did not appear in the video.
We used two standards of comparison to verify that the BES captured relevant EHR interactions. The first was the test subject’s clinical note, which provided a benchmark for the documentation typically performed for encounters. The second was the gold standard visit summary, which was constructed by a physician who had reviewed the screen tracking video from the clinical encounter. The gold standard summary included information that would generally be documented in a clinic note to communicate the care performed and to address billing requirements, such as additions to the problem list and chart items reviewed.
3. Comparison of Evaluation and Management billing requirements satisfied by the log file and video
To determine the feasibility of using only metadata from the log file to document the billing requirements satisfied during a clinical encounter, we referenced the specific billing requirements for clinical outpatient documentation detailed in the 1997 Evaluation and Management (E/M) guide.10 We pinpointed the billing requirements satisfied by the EHR interactions captured by the log file and video respectively to determine the potential utility of using log files for billing (Figure 3.3).
Results
1. Breadcrumbs encounter summary did not capture the physical exam
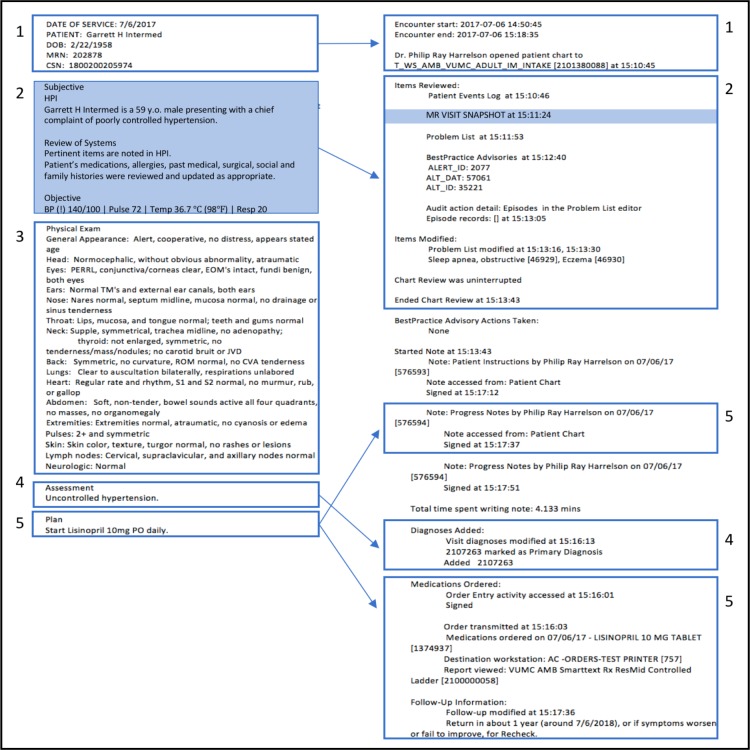
Figure 4 summarizes the comparison between the BES and the test subject’s clinical note. All components of the encounter, with exception of the physical exam portion of the clinical notes, could be mapped to a corresponding section in the BES. The chief complaint and review of systems (ROS) were displayed in sidebar reports that were marked as viewed in the log file. These items were therefore not explicitly included in our BES, but details can be extracted from Clarity tables. The BES also included timestamps, whereas the provider generated note did not.
Figure 4.
Clinical note (left) vs. Breadcrumbs encounter summary (right), family medicine provider. The BES contained information about all sections described in the clinical note except for the physical exam (3). The sidebar report in the BES and its corresponding contents in the clinical note are highlighted in blue.
2. Significant EHR interactions from the screen tracking video aligned with those in the log file
The gold standard visit summary highlighted the significant EHR interactions in the screen tracking video. Each item in the gold standard summary corresponded to a section of the BES (Figure 5). Since the metadata in the log files did not describe the contents of sidebar reports, not all items were explicitly listed in the BES. All items from the screen tracking video were represented in the BES, and the BES did not document any activity that was unsupported by the video. The BES provided more detail than the gold standard summary by also listing unique identifiers for locating pertinent patient health information.
Figure 5.
Gold standard visit summary (left) vs. Breadcrumbs encounter summary (right), family medicine provider. The sidebar report and the information it contained are highlighted in the BES and gold standard summary respectively. Each item in the gold standard summary corresponded to a section in the BES.
3. Evaluation Management billing requirements could be assessed using metadata in the log file
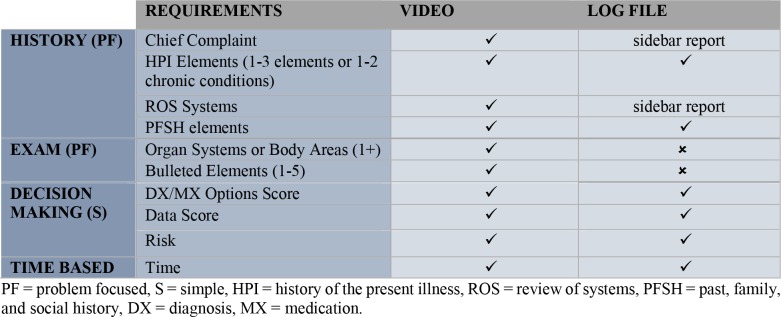
The metadata in the log files corresponded to EHR interactions that could be used for assessing E/M billing requirements. Examined independently of the video and annotated log file, the metadata in the log file was sufficient for an E/M evaluation. Metadata in the log file did not satisfy the exam component of the billing requirements (Table 1). The chief complaint and ROS requirements were implicitly captured in sidebar reports in the log file. The screen tracking video fulfilled all E/M requirements.
Table 1.
Summary of Evaluation and Management requirements satisfied by data from the videos and log files respectively. Requirements are taken from the 1997 E/M guidelines for Level of Service 99201.10 The video provided sufficient evidence for completion of each requirement listed. The log file did not explicitly include the chief complaint and ROS. Review of the screen tracking video indicates these details were visible in sidebar reports that the log file marked as viewed. Information about the physical exam was not in the log file.
 |
Discussion
In this study, we matched log file entries to EHR interactions, extracted entries corresponding to billable actions, and automated the encounter summary based on encounter-specific gold standards. The log files contain sufficient traces of relevant EHR interactions for automating several key components of the clinical encounter summary. Although our log file and BES do not currently contain all the information required for a clinical note, the chief complaint and ROS can be extracted from Clarity tables. Once these items are added, the log file and BES will better address the main components of E/M guidelines: history, physical exam, and decision making. Our BES’s closely resembled our gold standard visit summaries. Our BES does not explicitly list all items viewed in chart review, but this information is available in the EHR vendor’s documentation of items contained in sidebar reports. Automating the outpatient encounter summary is therefore feasible.
The BES has the potential to make medical billing more efficient and accurate. By passively collecting information about the encounter from metadata, the BES is unaffected by the human error that is often associated with copy and paste, dictation, and scribing. The reliability of BES is derived from the inherent accuracy and comprehensiveness of the metadata used to construct it. The BES has the potential to supersede the clinical note as a more credible account of EHR interactions that are relevant for billing. While the BES does not currently capture the physical exam, advances in computer vision technology might enable information about this part of the encounter to be passively collected in the future.
By including timestamps next to each action and unique identifiers next to entries concerning patient health information, the BES provides a more complete picture of the EHR interactions than both the clinical note and gold standard visit summary. One main caveat is that the BES does not explicitly list the specific items viewed in sidebar reports.
Compiling the log file from the UAL in addition to the Clinical Audit Trail was essential for obtaining a more complete picture of the EHR interactions during the clinical encounter. The Clinical Audit Trail marked all reports that were visible on the screen as viewed, even if the user had quickly scrolled past them in search of other items or had been working in another pane altogether. This was particularly problematic for sidebar reports, which were frequently visible in the rightmost pane. For extended periods of time, the Clinical Audit Trail often did not record intermediate steps such as scrolling through panes, and instead seemed to focus only on reporting the results of EHR interactions. The UAL filled in these gaps by providing click-level detail that also enabled activity continuity to be measured.
Analyzing screen tracking video alongside the log files proved critical for understanding the metadata in the context of the EHR and the user’s intentions. In addition to showing the location of activity in the EHR, the screen tracking video unveiled clues about the Clinical Audit Trail’s criteria for marking an item as viewed. In the study, the audio of think-aloud was invaluable in its disclosure of the user’s reasons for navigating through the EHR. Although providers might not practice think-aloud in actual encounters, this research method guided us towards baseline values. The combination of the screen tracking video and audio enabled us to gauge when the user was inactive in the EHR. These strengths from our research method are worth incorporating into future studies that might explore criteria for extracting significant EHR interactions from metadata.
Our study has several limitations. First, we obtained a convenience sample of two physicians to act as study participants and one physician to create the gold standard. Owing to variations in reading speed among users, the role-specific layouts of the EHR, and the multitude of cases that users might encounter, larger, more diverse samples and use cases must be studied for additional generalizability. More gold standards are necessary for developing the BES methodology such that billing is effectively facilitated. Second, we did not consider variations in physician workflow. While we have already aggregated information from disjoint EHR sessions to account for technical issues that might interrupt chart review, assessing the continuity of activity recorded before and after encounters may require the incorporation of additional temporal constraints. Third, the logging tools themselves were limited. The UAL did not log all activity within modals, so determining if the user was active while working in a modal was difficult without video. In this workflow, logging is dependent on a fully functioning computer. In a real-world scenario, consideration for computer downtime might include videotaping the exam room during visits to account for technical issues that compromise logging.
We made several assumptions while creating our BES. We assumed that the encounter begins the moment the provider logs in to the EHR and ends when the provider logs out. Likewise, we assumed that chart review begins when the patient’s chart is selected and ends when the user definitively selects the Note tab (i.e. the user remains in the section for at least five seconds) or loads a note template to the navigator. From this moment until the instant the note is signed, the provider is assumed to be writing the note. In reality, though, a provider might sporadically record and reference information in various parts of the EHR during the encounter. Future models might consider accounting for these intermittent diversions.
In further collaboration with an EHR vendor, it should be possible to coordinate larger studies, more easily locate metadata and pertinent information, generalize our algorithm to other types of patient encounters, and consider potential modifications to their logging tools to successfully implement software that automates the encounter summary. In these future investigations, it may also be interesting to explore the role metadata from nursing documentation can further contribute to the picture of the clinical care provided.
Automated encounter summaries and corresponding video have the potential to facilitate a provider workflow. Implementing this technology could substantially relieve providers of stress related to clinical documentation and allow providers to focus on patient care.
Conclusion
Using metadata from log files, we constructed BES’s that are comparable to gold standards created by a physician. Our screen tracking video provides strong support for claims made in our BES. However, future studies are necessary to establish criteria for accurately extracting true positives. Our study has demonstrated that automating the encounter summary is feasible. This functionality has the potential to minimize the miscellaneous work associated with clinical documentation and enable physicians to focus wholly on providing exceptional patient care.
Acknowledgements
We would like to thank the Epic© and VUMC Health IT team members who helped make this study possible.
References
- 1.Sinsky C, Colligan L, Li L, Prgomet M, Reynolds S, Goeders L, et al. Allocation of physician time in ambulatory practice: A time and motion study in 4 specialties. Ann Intern Med. 2016 Sep 6;165(11):753–760. doi: 10.7326/M16-0961. [DOI] [PubMed] [Google Scholar]
- 2.Rosenstein AH. Physician stress and burnout: prevalence, cause, and effect. AAOS Now. 2012;6(8) [Google Scholar]
- 3.Vogel RL. The false claims act and its impact on medical practices. J Med Pract Manage. 2010 Jul-Aug;26(1):21–24. [PubMed] [Google Scholar]
- 4.Tsou AY, Lehmann CU, Michel J, Solomon R, Possanza L, Gandhi T. Safe practices for copy and paste in the EHR. systematic review, recommendations, and novel model for health it collaboration. Applied Clinical Informatics. 2017;8(1):12–34. doi: 10.4338/ACI-2016-09-R-0150. [DOI] [PMC free article] [PubMed] [Google Scholar]
- 5.Johnson M, Lapkin S, Long V, Sanchez P, Suominen H, Basilakis J, et al. A systematic review of speech recognition technology in health care. BMC Medical Informatics and Decision Making. 2014;14(1):94. doi: 10.1186/1472-6947-14-94. [DOI] [PMC free article] [PubMed] [Google Scholar]
- 6.Gellert GA, Ramirez R, Webster S. The rise of the medical scribe industry: Implications for the advancement of electronic health records. JAMA. 2015;313(13):1315–1316. doi: 10.1001/jama.2014.17128. [DOI] [PubMed] [Google Scholar]
- 7.Aakre C, Dziadzko M, Keegan MT, Herasevich V. Automating clinical score calculation within the electronic health record. a feasibility assessment. Applied Clinical Informatics. 2017;8(2):369–380. doi: 10.4338/ACI-2016-09-RA-0149. [DOI] [PMC free article] [PubMed] [Google Scholar]
- 8.Rucker DW. Using telephony data to facilitate discovery of clinical workflows. Applied Clinical Informatics. 2017;8(2):381–395. doi: 10.4338/ACI-2016-11-RA-0191. [DOI] [PMC free article] [PubMed] [Google Scholar]
- 9.Jaspers MW, Steen T, Van den Bos C, Geenen M. The think aloud method: a guide to user interface design Int. J. Med. Inf. 73(2004):781–795. doi: 10.1016/j.ijmedinf.2004.08.003. [DOI] [PubMed] [Google Scholar]
- 10.U.S. Centers for Medicare & Medicaid Services. 2017. Evaluation and Management Services. American Medical Association. [Google Scholar]


