

Abstract
Cancer stage is rarely captured in structured form in the electronic health record (EHR). We evaluate the performance of a classifier, trained on structured EHR data, in identifying prostate cancer patients with metastatic disease. Using EHR data for a cohort of 5,861 prostate cancer patients mapped to the Observational Health Data Sciences and Informatics (OHDSI) data model, we constructed feature vectors containing frequency counts of conditions, procedures, medications, observations and laboratory values. Staging information from the California Cancer Registry was used as the ground-truth. For identifying patients with metastatic disease, a random forest model achieved precision and recall of 0.90, 0.40 using data within 12 months of diagnosis. This compared to precision 0.33, recall 0.54 for an ICD code-based query. High-precision classifiers using hundreds of structured data elements significantly outperform ICD queries, and may assist in identifying cohorts for observational research or clinical trial matching.
Introduction
Clinical stage is one of the most fundamental parameters in oncology, helping to define a patient’s treatment options, evaluate response to therapy, and inform prognosis. Clear documentation of cancer stage, specifically the presence of metastases, in the electronic health record (EHR) has been identified as a key quality metric by the National Quality Forum [1]. However, stage is not routinely captured as a structured data element in many EHRs [2]. Instead, stage is typically recorded in unstructured form in clinical notes, pathology or radiology reports, making it difficult to extract staging information at a population level. State and national registries manually extract stage from health system EHRs; however this is a labor-intensive process, there is often a significant delay in acquiring these data, and it is prone to human error [3]. Having the ability to quickly and efficiently identify patients by stage would not only streamline data collection for registries, but also enable health systems to conduct observational research, evaluate quality improvement initiatives, and match patients to clinical trials.
A number of previous studies have attempted to extract stage from clinical notes using natural language processing (NLP), commonly focusing on pathology reports [3-6]. These systems typically require a large corpus of manually-labelled notes to train the algorithm and may not generalize across different kinds of clinical notes, cancer types, or hospital systems [7]. Our hypothesis is that other structured data elements within the healthcare record can likely signal advanced disease. However, limited work exists to classify cancer stage using only structured data elements within the EHR.
The Observational Health Data Sciences and Informatics (OHDSI) initiative is an international effort to standardize the format of EHR data and create scalable analytical tools that can be used across different health systems [8]. There are currently over 140 collaborating sites across more than 20 countries. The Observational Medical Outcomes Partnership (OMOP) common data model (CDM) used by the OHDSI consortium facilitates electronic phenotyping within the EHR i.e. identifying patients with particular clinical features. The standard approach to phenotyping involves rule-based queries using the OMOP vocabulary; however machine learning methods, using a wider input of structured EHR data, can deliver superior performance [9]. To our knowledge, these methods have not been applied to phenotyping tasks in oncology.
In this paper, we use an OHDSI feature vector framework to classify patients based on stage, using prostate cancer as a use-case [10]. Prostate cancer is the commonest noncutaneous malignancy in men and while relative 5 year survival for localized prostate cancer is above 99%, metastatic disease has a 5-year survival of only 29% [11,12]. Screening an EHR for cases of metastatic prostate cancer is clinically relevant because this subpopulation is the subject of active research, eligible for numerous clinical trials, and responsible for the highest healthcare expenditure within prostate cancer. We present a proof-of-concept of how to use the APHRODITE feature vector to train algorithms for differentiating prostate cancer patients with distant metastases at the time of diagnosis, from those with localized or regional disease. This classification is based only on the pattern of structured data (laboratory tests, medications, procedures and diagnoses) within the EHR. We benchmark the performance against an ICD (International Classification of Diseases) code-based search for identifying metastatic cases.
Methods
Dataset
We identified a cohort of 5,861 patients in the Stanford prostate cancer research database with ground-truth staging information at the time of diagnosis based on linked records from the California Cancer Registry (CCR) [13]. The EHR records of these patients have previously been mapped to version 5 of the Observational Medical Outcomes Partnership (OMOP) CDM. The CDM uses a predefined vocabulary and a standardized relational table structure including tables for conditions, procedures, medication exposures, observations and laboratory values. The OMOP-mapped EHR extract contained data from 1994 to 2016, with most complete data from 2009 onwards following installation of a new EHR platform.
Staging information was based on the Summary Stage attribute in the CCR, which is derived by the registry through manual chart review including both structured data and clinical notes. Summary Stage reflects the clinical stage of the cancer, based on the Surveillance, Epidemiology and End Results (SEER) classification. Patients with unknown stage were excluded from the cohort. In the cohort, 75.3% of cases were localized, 19.1% regional and 5.6% metastatic at the time of diagnosis. Dates of diagnosis ranged from 2005-2015.
ICD code search
Within the above cohort, we initially conducted an ICD code search to identify patients with metastatic disease at the time of diagnosis. Patients were deemed positive if any of the following ICD-9 codes were present: 196, 197, 198, 199.1 (conditioned on the presence of “metastatic” within the diagnosis name). Codes 196.2, 196.5, 196.6 and 198.82 were excluded as they typically identified patients with regional spread of prostate cancer. In addition, the following ICD-10 terms were also used to define positive cases: C77, C78, C79. Precision and recall were calculated based on CCR stage labels. Performance was first assessed in the absence of any temporal information about the date of staging, using the presence of the above ICD codes at any point in a patient’s record. Subsequently, performance was evaluated based on the presence of a code within 6, 12, 24 and 36 months of the known date of diagnosis. Date of diagnosis was obtained from CCR records.
Feature vectors
Figure 1 shows a flow-chart of the classifier model-building pipeline. The cohort was split into training and test sets balancing for the prevalence of metastatic cases. In the training set, the APHRODITE package was used to construct a feature vector for each patient containing frequency counts of the following structured data elements: conditions, procedures, observations, medication exposures, and laboratory values. Unlike in previous studies, no noisy labelling was used. Each data element has an associated OHDSI concept ID, and lab values may be associated with a secondary ID to denote whether the measurement is low, normal or high. For example, high prostate-specific antigen (PSA) is considered a distinct feature to low PSA. Concepts present in less than 1% of the cohort were excluded from the feature vector. Feature vectors typically contained 700-1100 variables, depending on the time window used (see below).
Figure 1.
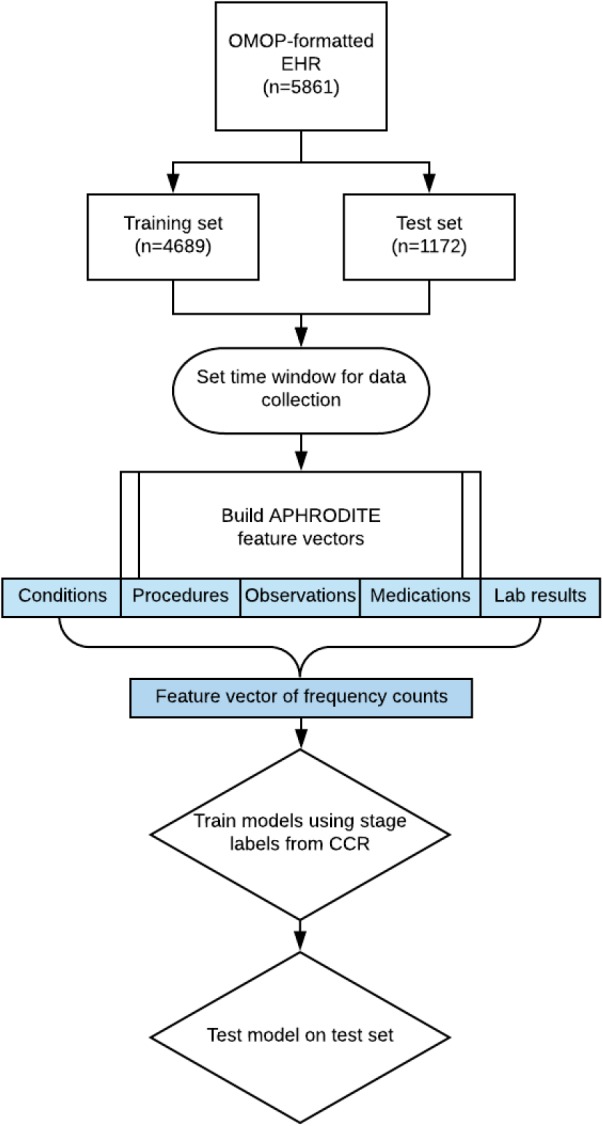
Flow chart showing the creation of feature vectors and training of a classifier to identify metastatic subjects.
Classifier selection
The following models were trained on the feature vectors of patients within the training set using CCR metastatic labels as the ground truth: logistic regression with the LASSO penalty (LASSO), random forest (RF), gradient boosted trees (GBM), and extreme gradient boosting (XGB). These classifiers were selected because tree-based methods showed optimal performance during preliminary experiments. Frequency counts were standardized prior to LASSO model building. Models were tested on the held-out test set (70 metastatic cases, 1102 non-metastatic cases).
Time windowing
Initially, no temporal information about the time of diagnosis was used, with feature vectors constructed using all available data. Subsequently, we used variable time windows around the date of diagnosis (6, 12, 24, 36 months pre-and post-diagnosis), in each case building new feature vectors and retraining the above classifiers.
Results
ICD code search
Based on CCR labels, there were 327 metastatic cases at the time of initial diagnosis within the cohort of 5,861 subjects. When no time constraints were applied, the ICD code search had precision 0.28 and recall 0.57 across the entire cohort. Using information about the date of diagnosis and restricting codes within variable time windows around that date yielded an increase in precision with concomitant drop in recall. Restricting the query to codes within a 12 month window on either side of diagnosis had precision 0.44 and recall 0.35.
Model selection
Figure 2 shows the performance of different classifiers compared to the ICD code queries with no time constraints (all available data), and based on a 12 month time window pre- and post-diagnosis. While the ICD query was tested on the full cohort, model performance is reported based on the test set of 1172 cases. The GBM model had precision and recall of 0.70, 0.27 for all data; and 0.85, 0.33 using a 12-month window on either side of diagnosis. Random forest had precision and recall of 0.59, 0.31 for all data; and 0.90, 0.40 with time restriction. Synthetic Minority Oversampling Technique (SMOTE) was used on the training set to mitigate the class imbalance; however no significant performance improvement was observed. Specifically, for the highest performing model (RF on time-restricted data) the precision and recall dropped from 0.90,0.40 to 0.38/0.50 using SMOTE. Additionally, we trialed dimensionality reduction using principal component analysis, retraining the classifiers with the first 50 principal components, with consistent performance reductions.
Figure 2.

Comparative performance of ICD code search and machine learning models in detecting metastatic cases using all EHR data (left) or only data within 12 months of diagnosis date (right).
The following OHDSI concepts were the top five predictor variables in the time-restricted RF model: 78097 (“Secondary malignant neoplasm of bone”), 200962 (“Primary malignant neoplasm of prostate”), 3035995:45876384 (“Alkaline phosphatase - high”), 3024171 (“Measurement of respiratory rate”), 3008893:45881666 (“Serum testosterone - low”). Other clinically relevant concepts in the top 20 included “leuprolide”, “lymphocyte count - high”, and “serum globulin - high”.
Discussion
Identifying cohorts of patients within an EHR based on clinical stage is important for epidemiological surveys, observational research, and clinical trial matching. For the majority of cancer centers where EHR data is not linked to registries, the best approach for identifying the stage of patients involves ICD code-based queries, which may have low performance, missing many eligible cases. NLP approaches are emerging as a useful method for extracting stage from unstructured data, however they are often not generalizable across sites. Here we use all available structured data to build vectors to identify patients with metastatic disease, which had higher performance than ICD-only queries.
This proof of concept study demonstrates the use of the OMOP CDM to construct feature vectors for training a classifier that identifies cases of metastatic prostate cancer at initial diagnosis. This approach, using hundreds of structured data elements as predictor variables, outperformed a simple ICD code search and is likely more generalizable than NLP-based approaches. Information about the date of diagnosis significantly improved classification accuracy, with the best performance achieved by a random forest classifier using 12 months of data pre-and post-diagnosis. Although we focus on identifying metastatic disease among prostate cancer patients, this approach may be transferable to other phenotyping questions at other sites using the OMOP CDM.
Although the classification models achieved precision of up to 0.9, the recall was low. These high-precision classifiers may have still utility in identifying eligible patients for observational studies or clinical trials, where finding even a small number of patients who meet inclusion criteria is extremely valuable. However, in the current form, they are not a practical method for automatic extraction of staging information from EHRs to populate registries. Multiple factors may have contributed to the poor recall. There was significant heterogeneity in the content of EHRs between patients, with some subjects having Stanford as their primary treatment center while others were only referred sporadically for specialist procedures, with no clear label to distinguish the two. There may also have been variability between clinics and staff members in what data elements were routinely captured, with critical data elements not represented in the EHR. Interestingly, neither class imbalance techniques nor dimensionality reduction enhanced performance, suggesting that the key limitation may be the quality and completeness of the training dataset.
Previous efforts to extract staging information from EHRs have predominantly used natural language processing (NLP). Strauss et al. categorized prostate cancer pathology reports by malignancy status with over 95% precision and recall, while 94% accuracy has been achieved by NLP systems for extracting M stage from lung cancer pathology reports [4,5]. The challenge of NLP is that these models may not generalize well to other types of clinical notes, or other institutions [7]. Furthermore, full pathology or radiology reports may not always be available - especially if patients have had some investigations performed as outpatients. The results of this study demonstrate that using structured data alone can provide comparable precision to NLP approaches for certain phenotyping tasks. Our hypothesis is that these structured data models may be able to generalize better across sites which have EHR data mapped to the OMOP CDM. Ultimately, we suspect that a combined phenotyping pipeline that integrates both structured data elements and NLP would deliver optimal performance.
This study was limited in only seeking to identify metastatic cases, rather than imputing full clinical stage, and doing so within a cohort of patients with known prostate cancer. This methodology could be extended to a range of other phenotyping tasks, such as recurrence following primary treatment, or resistance to hormone therapy. Furthermore, the models were only evaluated on data from a single site. Future studies to evaluate classifier performance on other OMOP-formatted datasets would be valuable. It would also be useful to determine the boost in classifier performance by combining structured data with features derived from text notes.
In conclusion, this is a proof of concept for using frequency counts of structured data elements derived from the OMOP CDM to identify more sophisticated phenotypes than ICD code-based queries are capable of. There may be particular utility in scenarios where high precision phenotyping is required, such as identifying cohorts for clinical trials or observational research.
Acknowledgements
The research was supported by the National Cancer Institute of the National Institutes of Health under Award Number R01CA183962. The content is solely the responsibility of the authors and does not necessarily represent the official views of the National Institutes of Health.
References
- 1.National Quality Forum. 2008. NQF 0386 Oncology: Cancer Stage Documented - Measure Submission and Evaluation Worksheet. [Google Scholar]
- 2.Evans TL, Gabriel PE, Shulman LN. Cancer Staging in Electronic Health Records: Strategies to Improve Documentation of These Critical Data. J Oncol Pract. 2016;12:137–139. doi: 10.1200/JOP.2015.007310. [DOI] [PubMed] [Google Scholar]
- 3.Warner JL, Levy MA, Neuss MN, Warner JL, Levy MA, Neuss MN. ReCAP: Feasibility and Accuracy of Extracting Cancer Stage Information From Narrative Electronic Health Record Data. J Oncol Pract. 2016;12:157–8. e169–7. doi: 10.1200/JOP.2015.004622. [DOI] [PubMed] [Google Scholar]
- 4.Strauss JA, Chao CR, Kwan ML, Ahmed SA, Schottinger JE, Quinn VP. Identifying primary and recurrent cancers using a SAS-based natural language processing algorithm. J Am Med Inform Assoc. 2013;20:349–355. doi: 10.1136/amiajnl-2012-000928. [DOI] [PMC free article] [PubMed] [Google Scholar]
- 5.Nguyen AN, Lawley MJ, Hansen DP, Bowman RV, Clarke BE, Duhig EE. Symbolic rule-based classification of lung cancer stages from free-text pathology reports. J Am Med Inform Assoc. 2010;17:440–445. doi: 10.1136/jamia.2010.003707. [DOI] [PMC free article] [PubMed] [Google Scholar]
- 6.Coden A, Savova G, Sominsky I, Tanenblatt M, Masanz J, Schuler K. Automatically extracting cancer disease characteristics from pathology reports into a Disease Knowledge Representation Model. J Biomed Inform. 2009;42:937–949. doi: 10.1016/j.jbi.2008.12.005. [DOI] [PubMed] [Google Scholar]
- 7.Yim W-W, Yetisgen M, Harris WP, Kwan SW. Natural Language Processing in Oncology: A Review. JAMA Oncol. 2016;2:797–804. doi: 10.1001/jamaoncol.2016.0213. [DOI] [PubMed] [Google Scholar]
- 8.Hripcsak G, Duke JD, Shah NH, Reich CG, Huser V, Schuemie MJ. Observational Health Data Sciences and Informatics (OHDSI): Opportunities for Observational Researchers. Stud Health Technol Inform. 2015;216:574–578. [PMC free article] [PubMed] [Google Scholar]
- 9.Banda JM, Halpern Y, Sontag D, Shah NH. AMIA Jt Summits Transl Sci Proc. 2017. Electronic phenotyping with APHRODITE and the Observational Health Sciences and Informatics (OHDSI) data network; pp. 48–57. [PMC free article] [PubMed] [Google Scholar]
- 10.APHRODITE. In: Observational Health Data Sciences and Informatics [Internet] Available: https://github.com/OHDSI/Aphrodite.
- 11.Siegel RL, Miller KD, Jemal A. Cancer statistics, 2018. CA Cancer J Clin. 2018;68:7–30. doi: 10.3322/caac.21442. [DOI] [PubMed] [Google Scholar]
- 12.Survival Rates for Prostate Cancer. In: American Cancer Society [Internet] 2017. Dec 18, Available: https://www.cancer.org/cancer/prostate-cancer/detection-diagnosis-staging/survival-rates.html.
- 13.Seneviratne MG, Seto T, Blayney DW, Brooks JD, Hernandez-Boussard TM. Architecture and Implementation of a Clinical Research Data Warehouse for Prostate Cancer. eGEMS. 2018;6(1) doi: 10.5334/egems.234. [DOI] [PMC free article] [PubMed] [Google Scholar]