Abstract
Disease-symptom relation is an important biomedical relation that can be used for clinical decision support including building medical diagnostic systems. Here we present a study on mining disease-symptom relation from massive biomedical literature and constructing biomedical knowledge graph from the relation. From 15,970,134 MEDLINE/PubMed citation records, occurrences of 8,514 disease concepts from the Human Disease Ontology and 842 symptom concepts from the Symptom Ontology and their relation were analyzed and characterized. We improve previous disease-symptom relation mining work by: (1) leveraging the hierarchy information of concepts in medical entity association discovery; and (2) including more exquisite relationship with weights between entities for knowledge graph construction. A medical diagnostic system for severe disease diagnosis was implemented based on the constructed knowledge graph and achieved the best performance compared to all other methods.
Introduction
Symptoms are the most sensible phenotypic manifestation of diseases. Disease-symptom relation is thus an important relation in healthcare applications including building clinical decision support systems1. A major application of disease-symptom relation is to build medical diagnostic systems that provide potential diagnoses for patients based on their symptoms, for both patients seeking clinical information and general practitioners seeking decision support. Symptom checkers are diagnostic systems for self-diagnosis. Great efforts have been made to develop symptom checkers1-5. Such efforts are two-folds: (1) biomedical knowledge acquisition and encoding; and (2) computational inference algorithms. For computational inference algorithms inferring disease diagnoses from symptoms, three main categories of methods are commonly used: rule-based, bipartite graph-based, and Bayesian inference-based. Though good algorithms can improve inference performance, the effect is lesser when compared with the medical knowledge the algorithm is built upon. Biomedical knowledge acquisition can be fulfilled in two ways: knowledge-based and data-driven. Knowledge-based knowledge acquisition is to compile medical knowledge manually, which is often accurate, but requires both domain expertise as well as tremendous time. Moreover, such knowledge is more qualitative than quantitative. For example, for a disease, experts can determine a symptom as frequent, occasional, or rare, but can hardly determine its frequency. Data-driven approaches, on the other hand, can address the problems by automating the information acquisition process with minimal human time and effort, and can be highly quantitative. Data-driven approaches, however, suffers from two major drawbacks. First, such approaches rely heavily on co-occurrence of concepts without special focus on mining their relationship, thus may confuse correlation with causation and bring artifacts. Next, results from such approaches are statistically but not clinically significant and are thus best suited for statistical inference models instead of clinical reasoning. For data-driven knowledge acquisition, data comes from different sources. Some sophisticated applications like IBM’s WatsonPaths2 and Isabel3 use information from medical textbooks, journals, and trusted websites, where the contents are formal and trustworthy. As electronic medical record (EMR) data has been widely used for biomedical data mining, studies have also been conducted on extracting knowledge from narrative reports in EMR6-10. EMR data has the advantage of reflecting the actual clinical practice rather than the information presented in textbooks and journals, but is more difficult to interpret due to its less formal, less definitive, more complicated and more biased11 nature. Another data source that has been used is biomedical literature12, which includes abundant research articles and reviews. It has the advantage of being formal, trustworthy, and reflect the trend of clinical research. Different from EMR data, which have legal and ethical restrictions to data access, most biomedical literature reports can be openly accessed.
In this paper, we present a study on mining disease-symptom relation from massive biomedical literature and using the extracted information for severe disease diagnosis. For disease-symptom relation mining, we followed the typical process of biomedical knowledge acquisition research utilizing text, which includes two steps: discovering associations between medical entities, and knowledge base construction. We have two main differences from previous researches. First, for medical entity association discovery, we leveraged the hierarchy information in the biomedical ontology to enable concept extraction at different levels and more accurate medical entity recognition. As an example, as ‘influenza’ is a ‘viral infectious disease’ in the ontology, a text mentioning of ‘influenza’ is also marked as mentioning ‘viral infectious disease’. Second, for knowledge graph construction, we included more exquisite relationship between entities, as well as providing weight for each entity and relationship for easy quantification. For disease diagnosis, we used Bayesian inference approach with naïve independence assumptions. Our major difference from other symptom checkers is that, since we extract knowledge from biomedical literature, our knowledge has more focus on complex or severe disease, or common diseases with more severe conditions, thus enabling more accurate diagnosis of severe diseases.
Methods
Ontology. For disease term extraction, we used the Human Disease Ontology (DO) database13 (http://disease-ontology.org) for the following reasons: (1) it provides abundant inclusion and cross-mapping of concepts from many standard medical terminologies (MeSH, ICD, OMIM, and NCI), and is thus an integrated ontological classification of disease; (2) it provides synonyms for concepts, thus facilitating extracting and combining concepts from texts; and (3) it provides disease hierarchy information to manage disease of different levels and to enable automatic tracing of a disease to its ancestors for accurate counting. At the time of download, the Human Disease Ontology includes 10,897 concepts, among which 8,514 are non-obsolete. For symptom term extraction, we used Symptom Ontology (SYMP) developed at TIGR and University of Maryland (http://symptomontologywiki.igs.umaryland.edu/mediawiki/index.php/Main_Page) since it provides both synonyms and hierarchical information, brining benefits as mentioned above. At the time of download, the Symptom Ontology includes 938 concepts, among which 842 are non-obsolete.
Biomedical literature data source. All MEDLINE/PubMed citation records in XML format provided by NLM as of Jan. 9th, 2018 were downloaded. Literature records without title or abstract were excluded, resulting in 15,970,134 records for disease-symptom relation mining.
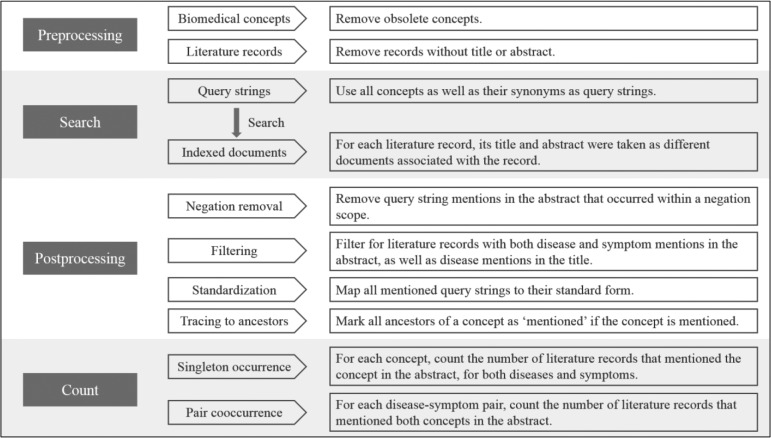
Information extraction workflow. To characterize the relation between diseases and symptoms, two kinds of information were extracted: concept occurrence count (singleton occurrence count) and disease-symptom cooccurrence count (pair cooccurrence count). To achieve the goal, we designed a four-step information extraction workflow: preprocessing, search, postprocessing, and count, which is shown in Figure 1. In the preprocessing step, both biomedical concepts and literature records were processed. Concepts marked as ‘obsolete’ in two ontologies were excluded. Literature records without title or abstract were excluded for lack of necessary information. In the search step, all concepts and their synonyms were used as query strings. For each literature record, the title and abstract were taken as two separate documents associated with the literature, which were then indexed for later search. Search of the query strings against the indexed documents were performed using the Whoosh package in Python, and the results were query string mentions in each document. In the postprocessing step, a series of actions were taken. Mentions within a negation scope (determined using ‘NegEx’14) were removed to distinguish disease or symptom denials from positive mentions. With the target of characterizing disease-symptom relation, we filtered for only those literature records that have both disease and symptom mention(s) in the abstract. From the resulting records, we further filtered for records that have disease mention(s) in the title in the hope of keeping only records with a disease-related topic. Standardization was then performed to map all string mentions to their standard concept form. Each mentioned concept was then traced all the way up to all its ancestors, intending to reflect that mentioning of a concept is also mentioning of its ancestors. After this, unique positive concept mentions in each of the remaining literature records were used for the last step: count. Concept occurrence count was achieved by counting the number of literature records that mentioned the concept in the abstract, respectively for diseases and symptoms. For each disease-symptom pair, the cooccurrence count was achieved by counting the number of literature records that mentioned both concepts in the abstract.
Figure 1.
Information extraction workflow. There are four steps in the information extraction workflow: preprocessing, search, postprocessing, and count. Sub-steps in each step and explanations are also described.
Building biomedical knowledge graph. Here, we characterize disease-symptom relation by building a biomedical knowledge graph based on the results from the information extraction workflow. Each concept is regarded as an entity. Each entity has an attribute that can be ‘disease’ or ‘symptom’ based on the ontology it is from, and has a weight attached, which is calculated as the percentage of records that mentioned the concept. Relationships are built between entities with the same attribute to reflect the hierarchy information. The ‘is_a’ relationship is a reflection that the former concept is a child of the latter. Relationships are also built between entities with different attributes to reflect the relation between diseases and symptoms. There are two kinds of such relationships: ‘symptom_of’ and ‘disease_of, each of which is accompanied by a weight defined below. For ‘symptom_of’, the weight is defined as the probability of having the disease conditioned by having the symptom as calculated from the singleton occurrence counts and pair cooccurrence counts:
For ‘disease_of’, the weight is defined similarly, as the probability of having the symptom conditioned by having the disease, also calculated from the counts:
Disease diagnosis methodology. In this work, disease diagnosis is defined similarly as in symptom checkers such as Symcat (http://www.symcat.com/), which is to infer possible diseases based on a list of symptoms and rank possible diseases based on their probability. Statistically, given a list of symptoms present in a patient ([s1, s2, …, sn]) and a list of all possible diseases ([D1, D2, …, Dm]), we need to calculate conditional probabilities like p(Di|s1, s2, …, sn) for each disease and rank all diseases based on descending probabilities. We thus calculate the conditional probabilities based on the idea of Naïve Bayes, assuming independence of symptoms conditioned by a disease, which is a common assumption in such disease diagnosis methods. Specifically,
Using knowledge from the knowledge graph:
To avoid multiplication of many small numbers, we took the logarithm during the process by calculating:
We thus rank the values of for i in 1, 2, …, m in descending order, and the top ones are included as possible diseases.
Disease diagnosis performance evaluation. Disease diagnosis performance was evaluated based on previous reports15. In the paper, 45 standardized patient vignettes were compiled with a severity spectrum of three categories of triage urgency: emergent care required (15), non-emergent care reasonable (15), and self-care reasonable (15), with both common and uncommon conditions. To evaluate our method’s performance in severe disease diagnosis, we used the 15 patient vignettes that require emergent care. Based on the vignettes, symptoms were extracted, from which probable diseases were inferred. The main outcomes were whether the correct diagnosis was listed first or within the first 20 potential diagnoses. In our case, where we have hierarchy of concepts, when talking about the rank of a diagnosis, we compare with disease concepts of the same level for fair comparison.
Results
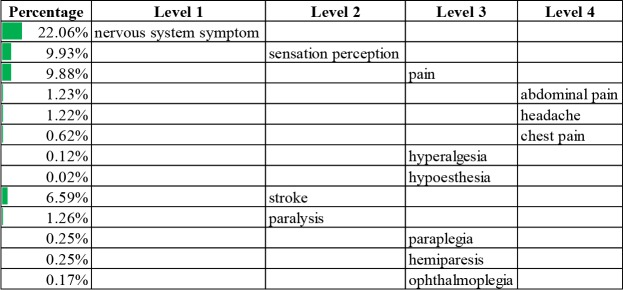
Information extraction summary. We went through the information extraction workflow in our experiment. After the preprocessing step, 8,514 non-obsolete concepts remained in the Human Disease Ontology and 842 non-obsolete concepts remained in the Symptom Ontology. For biomedical literature records, 15,970,134 records have both title and abstract. After the search step, 7,535 out of the 8,514 non-obsolete concepts in the Human Disease Ontology (88.5%) appeared at least once in the biomedical literature investigated. Out of the 842 non-obsolete concepts in the Symptom Ontology, 699 (83.0%) appeared at least once. Among the 15,970,134 records, 7,649,951 (47.9%) mentioned at least one disease, and 3,616,701 (22.6%) mentioned at least one symptom. After the postprocessing step, 1,346,608 out of the 15,970,134 (8.4%) literature records remained for having both disease and symptom mentions in the abstract, as well as disease mentions in the title. In the count step, we counted the number of literature records that mentioned each concept, as well as the number that mentioned each disease-symptom concept pair. The most common diseases and symptoms were listed in Table 1 and Table 2, respectively, and organized in hierarchical form to illustrate the results from the information extraction workflow. The most common disease identified was cardiovascular system disease, its descendants were listed with their percentages in Table 1. The most common symptom was nervous system symptoms (Table 2). To keep concise, a maximum of four levels of concepts are shown and a maximum of three sub-concepts were listed on each level based on descending percentage.
Table 1.
Common cardiovascular system diseases and percentages.
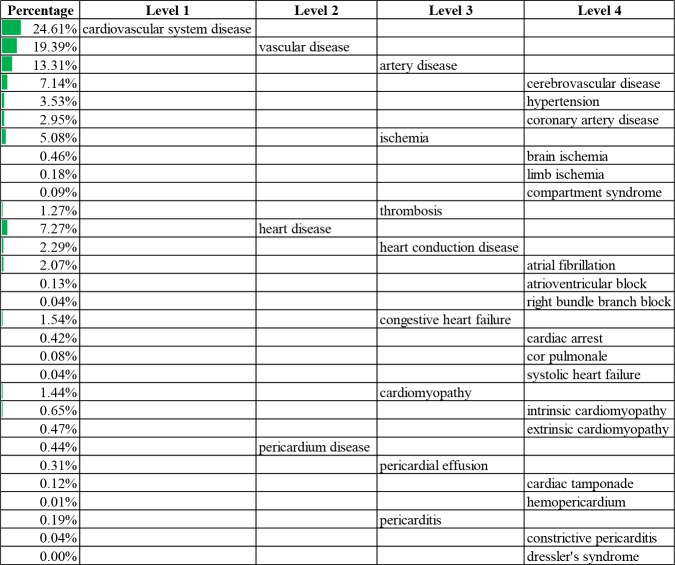 |
Table 2.
Common nervous system symptoms and percentages.
 |
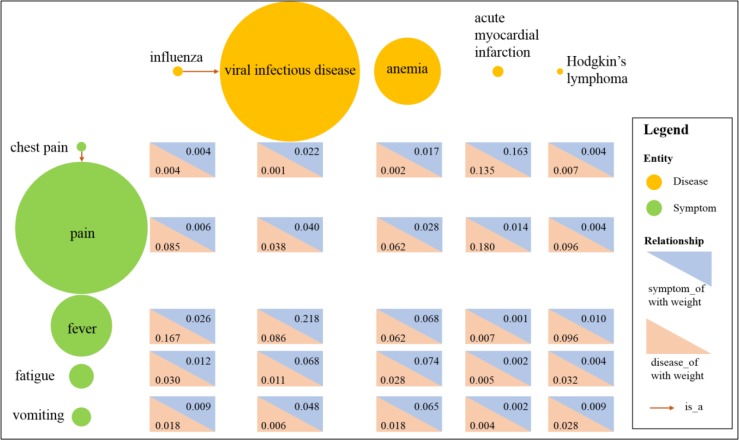
Biomedical knowledge graph. Built upon the information extraction results, the biomedical knowledge graph had entities with attributes of either ‘diseases’ or ‘symptoms’. The ‘is_a’ relationship was used to reflect the child-parent relationship between entities of the same attribute. For entities with different attributes, two kinds of relationships were included: ‘symptom_of’ and ‘disease_of, associated with weights as defined in the methodology section. For illustration, we extracted five diseases (viral infectious disease, influenza, anemia, acute myocardial infarction, and Hodgkin’s lymphoma) and five symptoms (pain, fever, fatigue, vomiting, and chest pain) and their relationships as an example visualization in Figure 2. From the figure, different diseases or symptoms have very different weights. The ‘is_a’ relationships were built between children and their parents. The disease-symptom relationships (‘symptom_of’ and ‘disease_of’) were built between each disease-symptom pair. A large weight of the ‘symptom_of’ relationship indicate the disease is an important source of the symptom. For example, acute myocardial infarction is an important cause of chest pain. A large weight of the ‘disease_of’ relationship indicate the symptom is an important manifestation of the disease. For example, fever is an important symptom of influenza.
Figure 2.
Illustration of the biomedical knowledge graph. Each circle denotes an entity with its color showing its attribute, and its size proportional to its weight. The relationships are also illustrated, with red arrows denoting the ‘is_a’ relationship, blue triangle denoting the ‘symptom_of relationship with the number denoting its weight, and red triangles denoting the ‘disease_of’ relationship with the number denoting its weight.
Bias of disease-symptom relation mined from biomedical literature. Since the disease-symptom relation was extracted from biomedical literature, it is sometimes biased toward complex or severe diseases or diseases having severe conditions compared to the general population visiting doctors’ offices. A comparison with the results on the Symcat website provides evidence for this. As an example, when looking at the diseases associated with the symptom ‘fever’, Symcat ranks ‘common cold’ (27%), ‘otitis media’ (12%), and ‘pneumonia’ (5%) as the three most common associated diseases. However, when looking at our knowledge mined from biomedical literature, cancer is the disease most commonly associated with ‘fever’ (18%), which is an exaggeration of the real circumstances since more research articles are about serious and complex diseases like cancer rather than common cold. In out mined relationship, the corresponding diseases ranked differently from Symcat with different associated probability: ‘common cold’ (less than 1%), ‘otitis media’ (less than 1%), and ‘pneumonia’ (5%). On the one hand, a same symptom tends to be associated with more severe or complex diseases, on the other hand, a same disease tends to be associated with more severe symptoms. As an example, in our mined result, ‘influenza’ is more frequently associated ‘necrosis’, ‘weight loss’, ‘respiratory failure’ compared to less severe symptoms like ‘sore throat’ or ‘nasal congestion’ as in Symcat. However, data bias is always present regardless of the data source. Our results, which are mined from biomedical literature, are more biased towards severe and complex conditions, and it thus a best suit for severe and complex disease diagnosis. Symcat, with data from doctors’ offices and ER visits, are ‘sicker than those just searching on the Internet’, as quoted from their website, and is thus suited to be used by general practitioners for decision support. If we have labeled data from Internet searches, it would have similar condition distribution to those searching the Internet and would thus be more applicable for self-diagnosis purpose. We should thus leverage application purposes for such disease-symptom relation extraction processes.
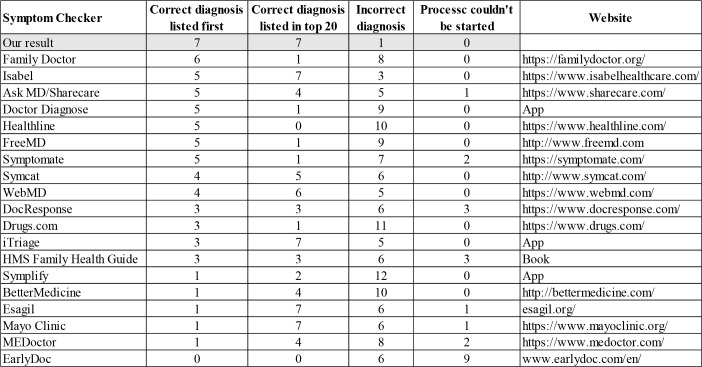
Application in severe disease diagnosis. An example disease diagnosis output (a part) was shown in Figure 3 for illustration of the result, and how hierarchical information was used and displayed. The actual disease is asthma with symptoms of ‘shortness of breath’, ‘wheezing’, ‘cough’, and ‘drowsiness’. When deciding whether the diagnosis is accurate, we compare weights of other diseases on the same level. As in Figure 3, we compared the weight of asthma with bronchiectasis, bronchitis, obstructive lung disease, and so on, and it is the largest among all such weights. We applied the disease diagnosis methodology to the 15 standardized vignettes that requires emergent care using the disease-symptom relation from biomedical literature. Performance was evaluated against other symptom checkers as reported in the publication15 and is reported in Table 3. We highlighted our results with gray shade. Compared to all other symptom checkers, our result has the highest number where correct diagnosis was listed first, the highest number where correct diagnosis was listed in top 20, as well as the lowest number where incorrect diagnosis was made. The results proved the method’s capability in diagnosing severe disease, enabled by the disease-symptom relationship extracted.
Figure 3.
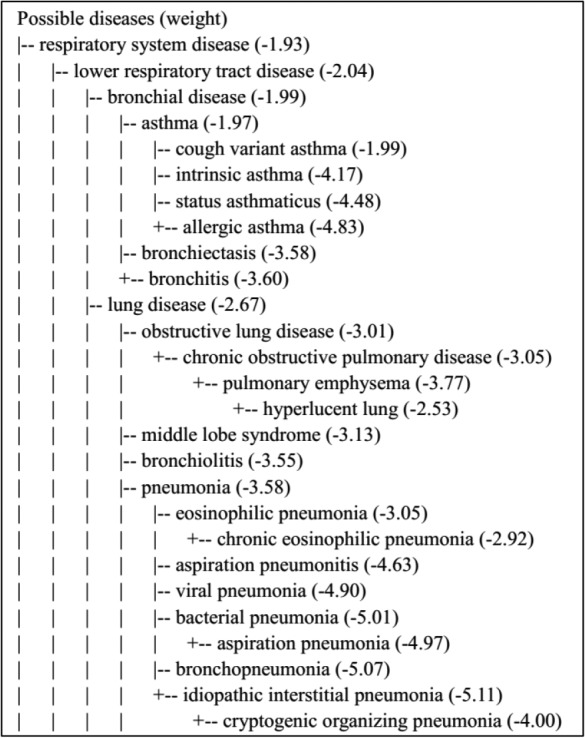
Example disease diagnosis output. A vignette15 was used here for demonstration with the diagnosis of ‘asthma’. Symptoms were extracted as ‘shortness of breath’, ‘wheezing’, ‘cough’, and ‘drowsiness’, and were used as input for disease diagnosis. The top part of the disease diagnosis output is shown here. The weight in the bracket is log10p(Di, S1, S2, …, Sn), and only disease with weight above the 99.5 percentile of all disease weights are shown.
Table 3.
Diagnostic accuracy comparison of different symptom checkers.
 |
Discussion
Problem of ontology. Different studies of biomedical knowledge acquisition utilizing text use different ontologies. Some use MeSH term for easy identification from biomedical literature citation records12. Some use ICD or SNOMED-CT for their wide application and easy translation between languages. Some use UMLS for its comprehensiveness7. Here we used Human Disease Ontology and Symptom Ontology for their conciseness, rich synonyms, and rich hierarchy information. But they also suffer from two major flaws. The first is the incompleteness of medical concepts, which cannot be avoided regardless of the ontology. The second is the ambiguity that a concept (such as ‘pneumoniae’ and ‘constipation’) can be both a disease concept and a symptom concept, which has been discussed before16 and could be problematic in downstream applications.
Problem of co-occurrence statistics. Here we characterize disease-symptom relation using co-occurrence statistics, which, though often used, can be misleading at times. For example, when describing symptoms of a certain disease, absence of other symptoms may be mentioned as the disease’s distinction from other similar diseases. By negation detection, we may be able to deal with these to some degree but cannot avoid mixing two diseases with their symptoms. The noise and effects could be trivial when using a large data size, yet still pose the challenge that not only entities but also relationships should be analyzed for such study purposes.
Data source should be selected based on application. As mentioned above, biomedical knowledge extracted from different data sources have different focuses and distributions. We should thus select data source based on its real application. Web-generated data is most suited for building symptom checkers for patients searching the Internet for medical information. Patient encounter data is most suited to build medical diagnostic services for general practitioners to provide decision support. Biomedical literature data and patient encounter data of patients admitted to a hospital for emergent or urgent care are most suited to be used in the face of complex diseases or severe conditions. A way of integrating results from different data sources for medical diagnostic systems is that we group diseases or conditions into different categories, such as ‘self-care appropriate’, ‘requires non-emergent care’, and ‘requires emergent case’, and use different medical knowledge from different data sources for diseases or conditions of different categories to achieve the best performance.
Disease diagnosis algorithm. In this work, we used Naïve Bayes to rank the relative probability of candidate diseases to get the most probable ones. This approach is proven useful but can be improved by calculating the absolute disease probability. The intuition is that, in two diagnostic processes, the top-ranking disease could have a probability of 99%, indicating high confidence, and could also have a probability of 1%, indicating low confidence. As a result, future exploration on calculating the absolute probability of diseases while having the symptoms is still needed.
Conclusion
Here we present a study on mining disease-symptom relation from massive biomedical literature and constructing biomedical knowledge graph from the relation. Its improvements over previous disease-symptom relation mining work include its consideration of the concepts’ hierarchy information in medical entity association discovery and its design of more exquisite relationship with weights between entities for knowledge graph construction. The medical diagnostic system for severe disease diagnosis implemented based on the constructed knowledge graph achieved the best performance compared to all other methods.
References
- 1.Barnett GO, Cimino JJ, Hupp JA, Hoffer EP. DXplain: An Evolving Diagnostic Decision-Support System. JAMA J Am Med Assoc. 1987;258(1):67–74. doi: 10.1001/jama.258.1.67. [DOI] [PubMed] [Google Scholar]
- 2.Lally A, Bachi S, Barborak MA, Buchanan DW, Chu-Carroll J, Ferrucci DA, et al. WatsonPaths: Scenario-based Question Answering and Inference over Unstructured Information. Rc25489. 2014;17:1409–48. [Google Scholar]
- 3.Ramnarayan P, Kulkarni G, Tomlinson a.,, Britto J. 2004. ISABEL: a novel Internet-delivered clinical decision support system. Curr Perspect Healthc Comput; pp. 245–56. [Google Scholar]
- 4.Middleton B, Shwe MA, Heckerman DE, Henrion M, Horvitz EJ, Lehmann HP, et al. Probabilistic diagnosis using a reformulation of the INTERNIST-1/QMR knowledge base. II. Evaluation of diagnostic performance. Methods Inf Med. 1991;30(4):256–67. [PubMed] [Google Scholar]
- 5.Miller RA, Masarie FE., jr Use of the quick medical reference (QMR) program as a tool for medical education. Methods Inf Med. 1989;28(4):340–5. [PubMed] [Google Scholar]
- 6.Rotmensch M, Halpern Y, Tlimat A, Horng S, Sontag D. Learning a Health Knowledge Graph from Electronic Medical Records. Sci Rep. 2017;7(1) doi: 10.1038/s41598-017-05778-z. [DOI] [PMC free article] [PubMed] [Google Scholar]
- 7.Finlayson SG, LePendu P, Shah NH. Building the graph of medicine from millions of clinical narratives. Sci Data. 2014;1 doi: 10.1038/sdata.2014.32. [DOI] [PMC free article] [PubMed] [Google Scholar]
- 8.Sondhi P, Sun J, Tong H, Zhai C. 2012. SympGraph : A Framework for Mining Clinical Notes through Symptom Relation Graphs. ACM Knowl Discov Data Min; pp. 1167–75. [Google Scholar]
- 9.Goodwin T, Harabagiu SM. Automatic generation of a qualified medical knowledge graph and its usage for retrieving patient cohorts from electronic medical records. In: Proceedings - 2013 IEEE 7th International Conference on Semantic Computing, ICSC 2013; 2013. pp. 363–70. [Google Scholar]
- 10.Wang X, Chused A, Elhadad N, Friedman C, Markatou M. 2008. Automated knowledge acquisition from clinical narrative reports. AMIA Annu Symp Proc; pp. 783–7. [PMC free article] [PubMed] [Google Scholar]
- 11.Weiskopf NG, Rusanov A, Weng C. Sick patients have more data: the non-random completeness of electronic health records. MIA Symp. 2013;2013:1472–7. [PMC free article] [PubMed] [Google Scholar]
- 12.Zhou X, Menche J, Barabási AL, Sharma A. Human symptoms-disease network. Nat Commun. 2014;5 doi: 10.1038/ncomms5212. [DOI] [PubMed] [Google Scholar]
- 13.Schriml LM, Arze C, Nadendla S, Chang YWW, Mazaitis M, Felix V, et al. Disease ontology: A backbone for disease semantic integration. Nucleic Acids Res. 2012;40(D1) doi: 10.1093/nar/gkr972. [DOI] [PMC free article] [PubMed] [Google Scholar]
- 14.Chapman WW, Bridewell W, Hanbury P, Cooper GF, Buchanan BG. A simple algorithm for identifying negated findings and diseases in discharge summaries. J Biomed Inform. 2001;34(5):301–10. doi: 10.1006/jbin.2001.1029. [DOI] [PubMed] [Google Scholar]
- 15.Semigran HL, Linder JA, Gidengil C, Mehrotra A. Evaluation of symptom checkers for self diagnosis and triage: Audit study. BMJ. 2015;351 doi: 10.1136/bmj.h3480. [DOI] [PMC free article] [PubMed] [Google Scholar]
- 16.Devroede G. Constipation--a sign of a disease to be treated surgically, or a symptom to be deciphered as nonverbal communication?. J Clin Gastroenterol. 1992;15(3):189–91. [PubMed] [Google Scholar]


