 The first albumin structure in complex with testosterone and the hormone's binding affinity measured with two methods.
Abstract
Serum albumin is the most abundant protein in mammalian blood plasma and is responsible for the transport of metals, drugs, and various metabolites, including hormones. We report the first albumin structure in complex with testosterone, the primary male sex hormone. Testosterone is bound in two sites, neither of which overlaps with the previously suggested Sudlow site I. We determined the binding constant of testosterone to equine and human albumins by two different methods: tryptophan fluorescence quenching and ultrafast affinity extraction. The binding studies and similarities between residues comprising the binding sites on serum albumins suggest that testosterone binds to the same sites on both proteins. Our comparative analysis of albumin complexes with hormones, drugs, and other biologically relevant compounds strongly suggests interference between a number of compounds present in blood and testosterone transport by serum albumin. We discuss a possible link between our findings and some phenomena observed in human patients, such as low testosterone levels in diabetic patients.
1. Introduction
Serum albumin (SA) constitutes the most abundant protein in mammalian blood plasma, with a typical concentration of 600 μM. This high concentration and flexible three-domain structure give rise to SA's variety of functions, ranging from maintaining osmotic pressure between blood vessels and tissues to transporting fatty acids, drugs, and metal ions.1,2 Apart from circulation in the mammalian bloodstream, SA further travels in the lymphatic system, enabling deep-tissue delivery of therapeutic agents. This function proves particularly important in the field of oncology, where SA is responsible for the delivery of anti-cancer drugs.3
SA's ability to transport such a diverse range of molecules is the result of its numerous binding sites, which were primarily characterized through studies of complexes with drugs and fatty acids. Most drugs have been shown to bind to SA at two canonical sites, known as Sudlow sites I and II, located in domains II and III, respectively.4,5 Additional studies proposed a total of nine fatty acid (FA) binding sites, which are also known to bind drugs.6–10 Binding sites other than the canonical and FA sites have also been characterized. For example, cetirizine, a common anti-allergy drug, was shown to bind to equine serum albumin (ESA) in two novel sites, one of which overlaps with FA6.11 Albumin is also known to transport hormones.1 At the time of writing, the PDB contained albumin structures with only one hormone–thyroxine (PDB IDs: ; 1HK1, ; 1HK2, ; 1HK3, ; 1HK4, ; 1HK5).12 Because SA–hormone complexes have not been well-studied using X-ray crystallography, the molecular details of most hormones' transport by SA, the locations of hormone binding sites, and the ways in which different compounds might interfere with the binding and transport of hormones remain unclear.
Testosterone is the primary male sex steroid hormone and is responsible for the development of primary and secondary sexual characteristics. Like other steroid hormones, testosterone is synthesized from cholesterol and stimulates protein synthesis.13 Upon puberty in males, the plasma concentration of testosterone rises to 17.3–24.3 nM.14 Testosterone is 97.0–99.5% bound to SA or sex hormone-binding globulin (SHBG).15 In humans, 53–55% of testosterone is bound to SA, 43–45% is bound to SHBG, and the remaining fraction is free in the bloodstream.16 Zheng et al.17 reported the Kd range of HSA to be 28.6–31.3 μM and that of SHBG to be 0.8–1.4 nM and measured that HSA releases testosterone more rapidly than SHBG, indicating albumin to be a transient reservoir that rapidly regulates local testosterone concentrations.
Zheng et al.,17 Kragh-Hansen et al.,18 Pearlman and Crépy,19 and Vermeulen and Verdonck20 reported the dissociation constant for testosterone binding to HSA as ranging from 23.8 μM to 41.7 μM. Using the results of equilibrium dialysis and circular dichroism, Fischer et al.21 concluded that the primary testosterone binding site was located in domain II. Peters1 posited the existence of at least two steroid binding sites in domain II. Later studies concluded that testosterone and other steroids bind to Sudlow site I (subdomain IIA).22 However, these studies do not provide conclusive information about the location of testosterone binding sites.
Here, we present a crystal structure of ESA in complex with testosterone at 2.15 Å resolution, as well as the binding constants of testosterone to HSA and ESA determined with ultrafast affinity extraction (UAE) and tryptophan fluorescence quenching (TFQ) methods. The structure presented herein is the first of SA in complex with a steroid sex hormone. We discuss the implications of our results in the contexts of the possible effects of drugs, fatty acids, other metabolites, and SA glycation on testosterone transport.
2. Materials and methods
2.1. Materials
HSA was purchased from Sigma-Aldrich (#A8763 for TFQ experiments, #A1887 for UAE and zonal elution studies), and ESA was purchased from Equitech-Bio (#ESA62). Both proteins were obtained as lyophilized powders and purified further as described below. The final protein purity was above 95% as assessed by SDS-PAGE and gel filtration results. Testosterone was purchased from Sigma-Aldrich (#T1500), and DMSO was purchased from Fisher Scientific (#D128-500) and Sigma-Aldrich (#276855). The Nucleosil Si-300 (7 μm particle diameter, 300 Å pore size) was purchased from Macherey-Nagel. All aqueous solutions used for UAE were prepared with water from a Nanopure system (Barnstead) and filtered using a 0.2 μm GNWP nylon membrane from Millipore.
2.2. Structure determination
2.2.1. Protein purification for crystallization
ESA was dissolved in a buffer containing 10 mM Tris (pH 7.5) and 150 mM NaCl. Protein purification was performed using a Superdex 200 column attached to an ÄKTA FPLC gel filtration system (GE Healthcare) at room temperature. The mobile phase was the buffer in which the protein being purified was dissolved. Protein concentrations were estimated spectrophotometrically by measuring the absorbance at 280 nm with a Nanodrop 2000 (Thermo Scientific) using extinction coefficients (ε280-HSA = 28 730 M–1 cm–1, ε280-ESA = 27 400 M–1 cm–1) and molecular weights (MWHSA = 66 470 Da, MWESA = 65 700 Da). Collected fractions of monomeric ESA were combined and concentrated to 15 mg mL–1 using an Amicon Ultra Centrifugal Filter (Millipore Sigma, #UFC903024) with a 30 kDa MWCO.
2.2.2. Protein crystallization
Crystallization plates (96-well sitting drop; Hampton Research, HR3-123) were set up using a Mosquito crystallization robot (TTP Labtech). Aliquots of 0.2 μL of protein consisting of 15 mg mL–1 of ESA in the crystallization buffer and 0.1 μL of testosterone powder suspended in the purification buffer (10 mM overall concentration of testosterone suspension) were mixed with 0.2 μL aliquots of reservoir solution. Crystals grew in conditions containing a mother liquor consisting of 1.8 M ammonium dihydrogen citrate at pH 7.0. Harvested crystals were flash-cooled using Paratone® N (Hampton Research, HR2-643) as a cryoprotectant.
2.2.3. Data collection and structure determination
Diffraction data were collected at the LS-CAT 21-ID-F beamline at the Advanced Photon Source, Argonne National Laboratory (Argonne, IL). Data collection was performed for a single crystal at 100 K, using a 0.97872 Å wavelength. HKL-3000 23,24 was used to process, integrate, and scale the data. The structure was determined by molecular replacement using the native structure of ESA25 (PDB ID: ; 3V08) as the template. Structure determination and refinement of the ESA complex were performed using HKL-3000 integrated with MOLREP,26 Fitmunk,27 REFMAC,28 Coot,29 and additional programs from the CCP4 package.30 The refinement process followed recent, state-of-the-art guidelines.31 TLS groups determined by the TLS Motion Determination Server32 were used during refinement. Stereochemical restraints for testosterone molecule included in the CCP4 suite (ver. 7.0.053),30 which utilizes AceDRG33 to generate standard stereochemical libraries distributed with the suite, were used during the refinement. The ACHESYM server34 was used for standardized placement of the model in the unit cell. The PISA server35 was used to analyze the residues involved in interactions between the ligand and macromolecule. PyMOL (the PyMOL Molecular Graphics System, Version 1.5.0.3 Schrödinger, LLC) was used for protein visualization; the center_of_mass.py script was used to calculate distances between the center of mass of tryptophan's indole ring and that of each testosterone molecule. The statistics for diffraction data collection, structure refinement, and structure quality are summarized in Table 1. Details of all experimental steps (purification, crystallization, data collection and structure determination/refinement) were tracked by the LabDB database.36 Diffraction images are available at the Integrated Resource for Reproducibility in Macromolecular Crystallography at ; http://proteindiffraction.org 37 with DOI: ; 10.18430/m36mdq. The atomic coordinates and structure factors were deposited in the PDB with accession code ; 6MDQ.
Table 1. Data collection, structure refinement, and structure quality statistics a .
| PDB ID | 6MDQ |
| Diffraction images DOI | 10.18430/m36mdq |
| Data collection | |
| Resolution (Å) | 50.00–2.15, (2.19–2.15) |
| Beamline | 21-ID-F |
| Wavelength (Å) | 0.97872 |
| Space group | P61 |
| Unit-cell dimensions (Å) | a = b = 94.2, c = 142.3 |
| Protein chains in the ASU | 1 |
| Completeness (%) | 99.7 (100.0) |
| Number of unique reflections | 39 149 (1910) |
| Redundancy | 7.6 (6.8) |
| I/σ(I) | 28.0 (2.0) |
| CC 1/2 | (0.81) |
| R merge | 0.071 (1.027) |
| R meas | 0.076 (1.112) |
| Refinement statistics | |
| R work/Rfree | 0.183/0.226 |
| Bond lengths rmsd (Å) | 0.004 |
| Bond angles rmsd (°) | 0.8 |
| Mean B value (Å2) | 64 |
| Mean B value for testosterone molecules' atoms (Å2) | 103.3 (TBS1), 134.7 (TBS2) |
| Number of protein atoms | 4501 |
| Mean B value for protein (Å2) | 61 |
| Number of water molecules | 214 |
| Mean B value for water (Å2) | 61 |
| Clashscore/Clashscore percentile (%) | 1.12/100 |
| MolProbity score | 0.82 |
| Rotamer outliers (%) | 0.0 |
| Ramachandran outliers (%) | 0.0 |
| Ramachandran favored (%) | 98.27 |
aValues in parentheses are for the highest resolution shell. Ramachandran plot statistics are calculated by MolProbity.
2.3. Binding studies
2.3.1. Protein purification for binding studies
For binding studies (TFQ, UAE, zonal elution), both ESA and HSA were dissolved in PBS buffer (137 mM NaCl, 2.7 mM KCl, 90 mM Na2HPO4, and 16.2 mM KH2PO4, pH 7.4) and purified using the same buffer on a Superdex 200 column attached to an ÄKTA FPLC gel filtration system (GE Healthcare) at room temperature using a similar procedure as described in 2.2.1. Fractions of monomeric ESA and HSA were collected, combined, and concentrated to the desired concentrations (see 2.3.2 and 2.3.3).
2.3.2. Tryptophan fluorescence quenching (TFQ)
For TFQ measurements, the procedure described by Handing et al.11 was employed. TFQ experiments were performed in the PBS buffer with pure DMSO added to a final concentration of 20%. The final concentrations of HSA and ESA were 2.3 μM. Testosterone was dissolved in 100% DMSO and diluted five-fold with the PBS buffer to the final DMSO concentration of 20%, which, therefore, remained constant throughout the TFQ experiment. The final testosterone concentration ranged from 1080 μM to 0.86 μM (achieved by serial dilutions). The intensity of tryptophan fluorescence was measured at 37 °C by a Pherastar FS (BMG Labtech) device using an excitation wavelength of 280 nm and a 340 nm filter for the fluorescence detection. Sample solutions (100 μL in each well) were placed on UV-transparent, half-area 96-well plates (Corning®, One Riverfront Plaza, NY, Catalog# CLS3635). The gain value was set to 720 for HSA and 680 for ESA. The focal height was set to 6.7 mm.
The measurement of albumin fluorescence intensity for each testosterone concentration consisted of three independent experimental repetitions, where each repetition was the average of 10 fluorescence measurements of the well. Fluorescence values for wells without protein were used for background corrections for each testosterone concentration.
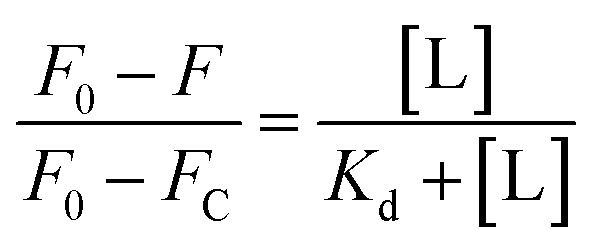
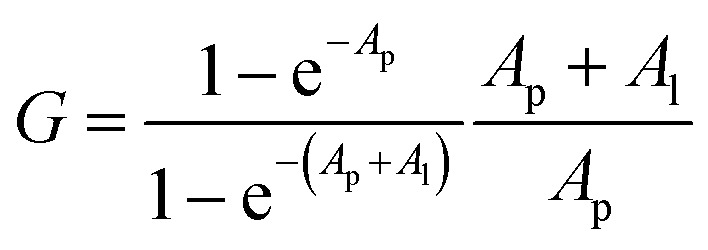
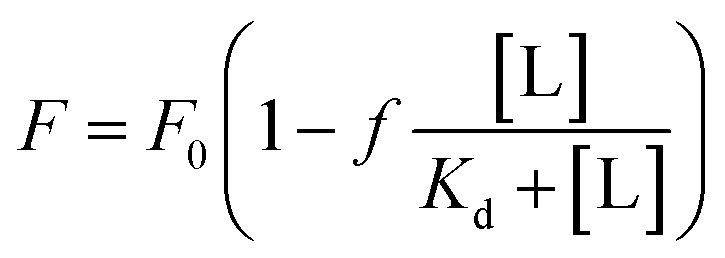
For Kd calculations, we used a simplified model of TFQ that assumes that the concentration of free ligand can be approximated by the concentration of added ligand when the protein concentration is significantly lower than that of the ligand (eqn. (1)).38 We further applied corrections by multiplying the measured fluorescence by a correction factor G (eqn (2)) proposed by Ehrenberg et al.39 to compensate for the absorbance of testosterone at the excitation wavelength of 280 nm (internal filter effect). Obtained data were analyzed with OriginPro 2016 software using non-linear regression (eqn (3)).
 |
1 |
 |
2 |
 |
3 |
In these equations, [L] is the ligand concentration, F is the corrected fluorescence intensity, F0 is the fluorescence of protein in the absence of ligand, FC is the fluorescence of protein complexed with ligand, Kd is the dissociation constant, f is the efficiency of quenching  , G is the correction factor, Ap is protein absorbance at 280 nm, and Al is ligand absorbance at 280 nm.
2.3.3. Ultrafast affinity extraction (UAE) and zonal elution
UAE studies were carried out using a high-performance liquid chromatography (HPLC) system from Jasco that consisted of two PU-2080 pumps, a UV-2075 absorbance detector, a X-LC 3167CO column oven, an AS-2057 plus autosampler equipped with a 100 μL sample loop, and LC-Net software. This system also included Advantage PF six-port and ten-port valves from Rheodyne. A similar HPLC system and LC-Net were used in the zonal elution studies that also included a Jasco DC-2080 degasser and HV-2080-01 column selector. Jasco ChromNAV software (v 1.8.04) was used to control these systems, and the chromatograms were analyzed using PeakFit 4.12 (Jandel Scientific Software).
The microcolumns used for UAE and zonal elution studies contained HSA that was immobilized to Nucleosil Si-300 silica by the Schiff base method, as described previously.17,40 A control support was prepared in the same manner but without the addition of HSA during the immobilization step. The HSA silica and the control support were packed into 5.0 mm × 2.1 mm i.d. (for UAE) or 10.0 mm × 2.1 mm i.d. (for competition studies) stainless steel columns using a Prep 24 pump from ChromTech, according to a previous method.40 The microcolumns were stored in 67 mM potassium phosphate buffer (pH 7.4) at 4 °C when not in use. The UAE and competition studies were both carried out at a column temperature of 37 °C and used 67 mM potassium phosphate buffer (pH 7.4) as the mobile phase. The procedure described by Zheng et al.,17 based on the partitioning of testosterone between a hexane solution and a mutually insoluble layer of an aqueous phosphate buffer (i.e., hexane and the phosphate buffer did not dissolve to any significant extent in each other), was used in most cases for the preparation of aqueous solutions and samples of testosterone or testosterone plus SA for the UAE and zonal elution studies.
The injected standard and samples that were used for UAE contained 10 μM testosterone or 10 μM of testosterone mixed with 20 μM HSA or ESA in 67 mM potassium phosphate buffer (pH 7.4). Each sample or standard was incubated at 37 °C for at least 30 minutes prior to injection. The injection volume was 2 μL, and the samples or standards were injected at flow rates of 0.5–3.0 mL min–1 in the studies with HSA and 0.25–2.0 mL min–1 in the studies with ESA. The elution of testosterone was monitored at 249 nm. The apparent free fraction of testosterone was determined by calculating the peak area ratio between the retained peak obtained for a testosterone standard and the retained peak for a sample containing the same total concentration of testosterone in the presence of a known concentration of HSA or ESA.17
The free fractions obtained by UAE at high flow rates (or short column residence times) were used to obtain the global affinity constant (nKa′, where n is the number of binding sites per protein) of testosterone with SA, as accomplished by using eqn (4).17,40
 |
4 |
The terms [T]tot and [P]tot in eqn (4) represent the total concentrations of the testosterone and soluble SA in the injected sample, while Ft0 is the original free fraction of testosterone in the sample at equilibrium. Data that were acquired at low-to-moderate flow rates by UAE were also analyzed by using eqn (5) to obtain Ft0, which was then utilized in eqn (4) to provide a second estimate of nKa′.17,41
 |
5 |
In eqn (5), kd is the dissociation rate constant for the testosterone–SA complex, and Ft is the apparent free fraction measured for testosterone when part of the complex is allowed to dissociate for time t in the microcolumn. A plot of ln[1/(1 – Ft)] versus t for this data should result in a linear relationship in which the intercept gives the value of Ft0 and the slope provides kd.17
The zonal elution studies were conducted by injecting 10 μL samples 3–4 times under each set of operating conditions. The testosterone samples contained a 20 μM concentration of the hormone and were prepared in the same solution that was used as the mobile phase. The elution of testosterone was monitored at 231 nm in these experiments. Samples containing 20 μM sodium nitrate, which was detected at 205 nm, were prepared in the solution being employed as the mobile phase and injected to determine the void times for the column and system. The following mobile phases were used in the zonal elution studies: (1) 67 mM potassium phosphate buffer (pH 7.4); (2) 20 μM sodium citrate in 67 mM potassium phosphate buffer (pH 7.4); (3) 40 μM sodium citrate in 67 mM potassium phosphate buffer (pH 7.4); and (4) 20% (v/v) DMSO in 67 mM potassium phosphate buffer (pH 7.4). These zonal elution studies were carried out at 0.50–0.75 mL min–1, with no significant changes being seen in the retention factors over this flow rate range. The retention or elution times of the peaks for testosterone or sodium nitrate were determined by using the progressive linear baseline subtraction mode of PeakFit 4.12 and an exponentially-modified Gaussian fit.
3. Results
3.1. Structural studies
The ESA–testosterone complex crystallized in the P61 space group (Table 1). The asymmetric unit contains one ESA molecule. The mature serum albumin from Equus caballus contains 583 residues (UniProt ID: P35747). In the reported structure, the first three residues are not modeled due to the lack of electron density, and there is a single mutation of Arg560Ala (reported previously by Handing et al.11). Overall, the structure of the ESA–testosterone complex is essentially identical to previously published structures of ESA. When the ESA–testosterone structure was compared to other proteins using the Dali server,42 the highest Z-score (similarity) for this structure was 56.3; the structure yielding this result was ESA complexed with diclofenac and naproxen43 (PDB ID: ; 5DBY). RMSD between the aligned Cα atoms was 0.5 Å.
3.2. Testosterone binding sites in ESA
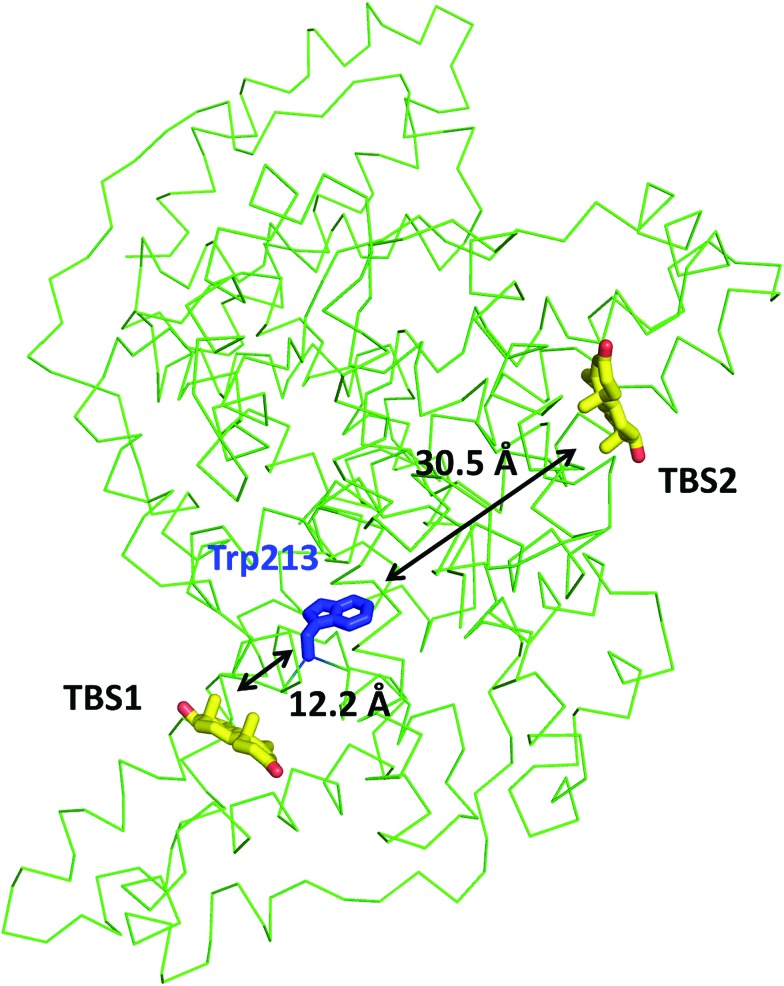
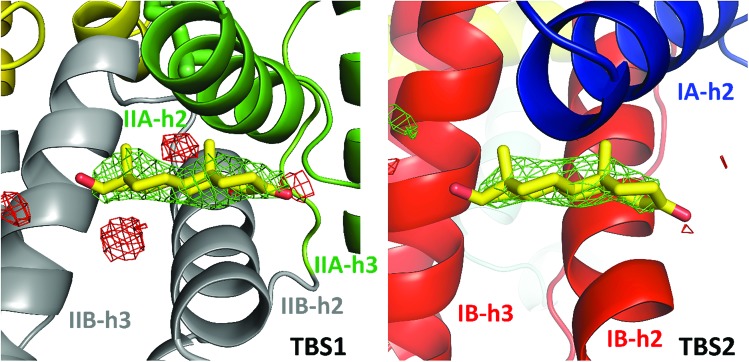
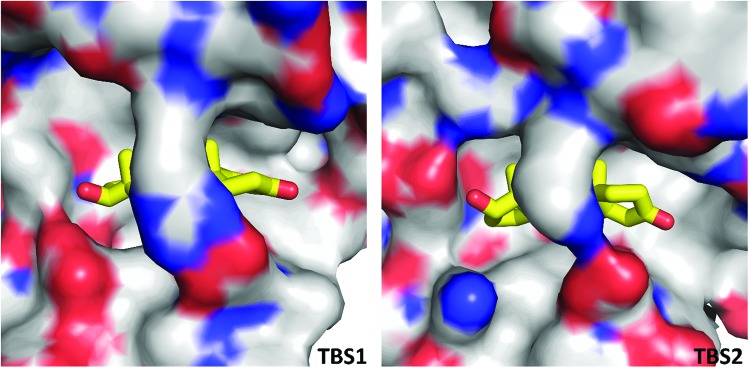
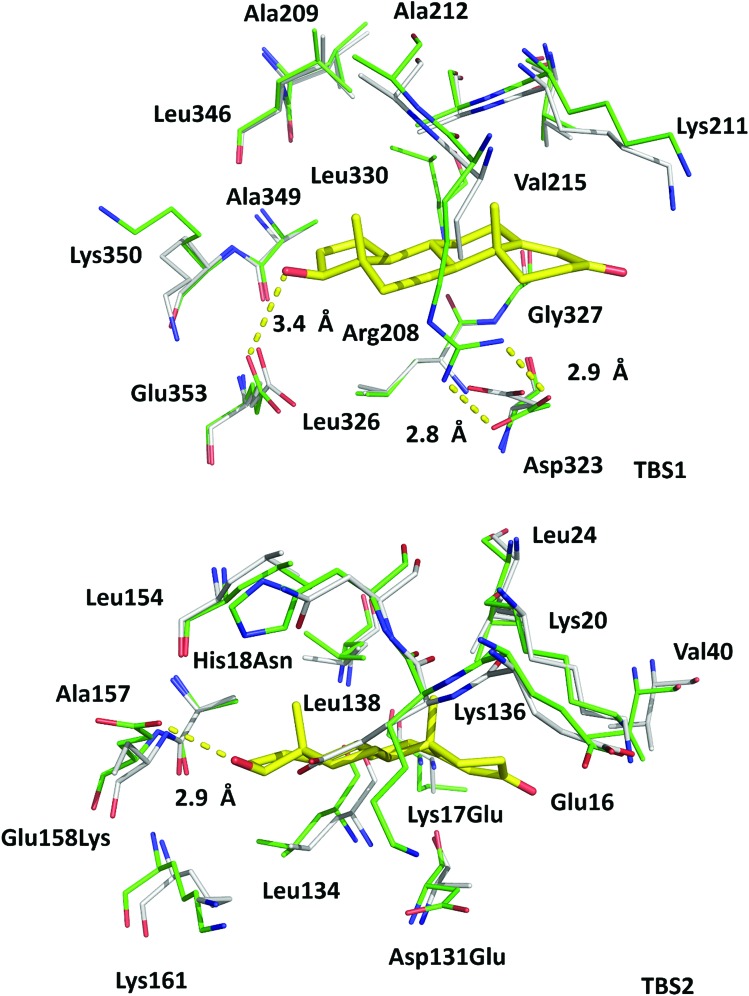
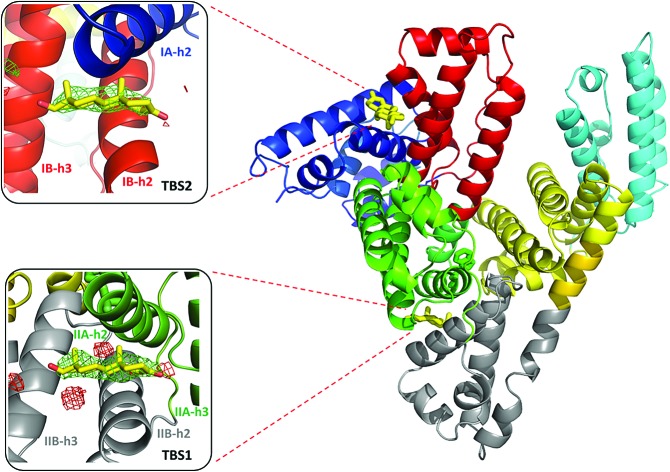
In the crystal structure, well-defined electron density indicates two testosterone molecules bound to ESA (Fig. 1 and 2). The first testosterone binding site (TBS1) is located between the h2 helix of subdomain IIA and the h2 and h3 helices of subdomain IIB, 12.2 Å from the singular tryptophan residue of ESA (Trp213). TBS1 is predominantly composed of hydrophobic residues oriented inward with respect to the cavity (Fig. 3), with hydrophobic interactions between the tetracyclic structure of testosterone and Ala212, Leu326, Gly327, Leu330, Leu346, and Ala349. The Arg208 residue is involved in a salt bridge with Asp323, and its aliphatic portion also forms hydrophobic interactions with two of the three six-membered rings of testosterone. TBS1 contains several hydrophilic residues, which may also contribute to the binding of testosterone; a possible hydrogen bond exists between the hydroxyl group of the testosterone molecule and the carbonyl oxygen of the side chain of Glu353 (Fig. 4).
Fig. 1. Testosterone binding sites and their distances from the tryptophan residue. Distances were calculated between the center of mass of tryptophan's indole ring center of mass and that of each testosterone molecule. The testosterone molecules (yellow) and the tryptophan's side chain (blue) are shown in stick representation and labeled.
Fig. 2. Testosterone binding sites with omit electron density map (mFo–DFc map, calculated after 10 refinement cycles without testosterone, σ – 3.0) presented in green and red (positive and negative contours, respectively). TBS1 is located between subdomains IIA and IIB, while TBS2 is surrounded by subdomains IA and IB. Colors of helices correspond with the domains' colors in Fig. 5. The electron density can be inspected interactively at ; https://molstack.bioreproducibility.org/p/9CP6/.
Fig. 3. Hydrophobic nature of testosterone binding sites. The color of the protein surface indicates the contributions of the particular atoms to the surface. The color scheme is as follows: gray for carbon atoms, red for oxygen atoms, and blue for nitrogen atoms. Testosterone's carbon atoms are shown in yellow.
Fig. 4. Superposition of testosterone binding sites in ESA (PDB ID: 6MDQ) and analogous sites in HSA (PDB ID: ; 4K2C). All residues are shown in stick representation. Carbon atoms in ESA and HSA are shown in green and gray, respectively, oxygen atoms are shown in red, nitrogen in blue; testosterone molecules are shown with carbon atoms in yellow. Residue numbers correspond to positions in ESA; naming scheme is as follows: residue from ESA, residue number, residue from HSA (if different). A visualization of the ESA–testosterone complex superposed with ligand-free ESA25 (PDB ID: ; 3V08) and HSA46 (PDB ID: ; 4K2C) can be inspected interactively at ; https://molstack.bioreproducibility.org/p/6s7G/.
The second binding site (TBS2) is located between subdomains IA and IB, 30.5 Å away from the tryptophan residue (Fig. 1 and 2). The observed electron density in this site, while not as strong as that observed in TBS1 (owing to the flexible nature of these subdomains, possible crystallographic disorder, or weaker ligand binding), is still well-defined and supports the presence of a testosterone molecule. Similar to TBS1, TBS2 is largely hydrophobic in character. The rings of the testosterone molecule are involved in hydrophobic interactions with Lys17, Lys20, Gly21, Asp131, Leu134, and Glu158. The hydroxyl group of testosterone forms a hydrogen bond with the carbonyl oxygen of the side chain of Glu158. The hydrophilicity and hydrophobicity of TBS1 and TBS2 are shown in Fig. 3 and S1.†
Due to the high concentration of citrate in the crystallization conditions (1.8 M), we considered the possibility of citrate molecules binding to TBS1 or TBS2 in place of testosterone. Overall, three citrate molecules are bound to ESA; two of them are located in the vicinity of the testosterone molecule bound to TBS1. We attempted to place and refine citrate molecules in both TBS1 and TBS2, but they did not fit the observed electron density. This situation was observed for two other datasets collected for the ESA–testosterone complex (data not shown). Moreover, the testosterone molecules form much more chemically reasonable interactions with the neighboring residues: the predominantly hydrophobic character of both TBS1 and TBS2 suggests that a highly charged citrate molecule is unlikely to bind in these sites. In addition, in other ESA structures that were determined from the same crystallization conditions but with different ligands (data not shown), we did not observe any electron density in TBS1 or TBS2. A Molstack44 presentation showing electron density maps of our structure of ESA in complex with testosterone is available at ; https://molstack.bioreproducibility.org/p/9CP6/.
3.3. Conservation of TBS1 and TBS2 in ESA/HSA
The high sequence identity/similarity between HSA and ESA (76.1%/86.2%) and residue conservation in TBS1 and TBS2 allow us to expect similar binding properties of these sites in albumin from both species. A full alignment of the HSA and ESA sequences, with residues involved in testosterone binding marked, is shown in Fig. S2.† The residues comprising TBS1 in ESA (Arg208, Ala209, Lys211, Ala212, Val215, Phe227, Asp323, Val324, Leu326, Gly327, Leu330, Leu346, Ala349, Lys350, Glu353) are conserved in HSA (Fig. 4). The salt bridge involving Arg208 in ESA is also observed in HSA (between Arg209 and Asp324) and contributes to fatty acid binding.45 TBS2 is less conserved (retained residues are Glu16, Lys20, Leu24, Phe36, Val40, Val43, Asn44, Asp134, Leu138, Leu154, Ala157, Lys161, Leu283) and contains the following differences (written as ESA residue name, residue number, HSA residue name): Lys17Glu, His18Asn, Gly21Ala, Asp131Glu, Gly135Lys, and Glu158Lys. These differences, with the exception of Gly135Lys, involve the exchange of a hydrophilic residue for another hydrophilic residue (or hydrophobic for hydrophobic). Additionally, some of these changes result in the loss of hydrogen bonding capability or hydrophobic interactions, but other changes compensate for these effects (e.g., loss of H-bond in Glu158Lys, gain in Lys17Glu; loss of hydrophobic interactions in Lys17Glu, gain in Glu158Lys). But despite these small changes in TBS2, the residues involved in binding testosterone at the two binding sites exhibit no significant conformational differences when the ESA–testosterone complex is compared to structures of ligand-free ESA25 (PDB ID: ; 3V08) and HSA46 (PDB ID: ; 4K2C). Moreover, the hydrophobic character of the binding sites' environment in ESA and HSA is essentially the same (Fig. S3†). Therefore, the conservation of amino acid residues in TBS1 and TBS2, which leads to the essentially identical hydrophobic environments, suggests that testosterone may bind to HSA in the same sites as in ESA.
3.4. Comparison with other SA–hormone structures
TBS1 and TBS2 are different from the hormone binding sites described in the structures of HSA in complex with thyroxine (PDB IDs: 1HK1, ; 1HK2, ; 1HK3, ; 1HK4, ; 1HK5). One thyroxine molecule was bound to each Sudlow site, and two thyroxine molecules were present in fatty acid binding site 5 (FA5). Thyroxine, a tyrosine-based hormone, contains four iodine atoms, two aromatic rings, and a carboxyl group, whereas testosterone contains a hydrophobic tetracyclic structure with one ketone and one hydroxyl group. The differences in the localization of the binding sites between the HSA–thyroxine and ESA–testosterone complexes may arise from structural dissimilarities between the two hormones.
3.5. Binding studies
3.5.1. Tryptophan fluorescence quenching (TFQ)
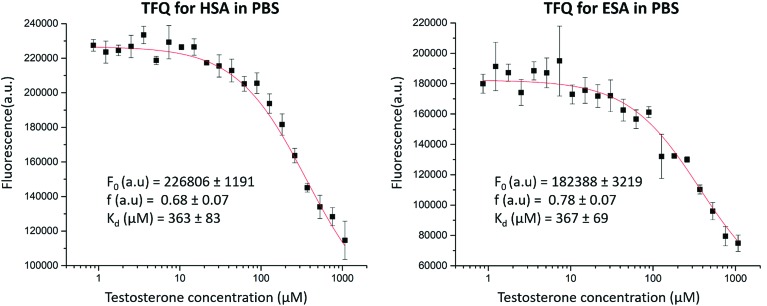
TFQ binding studies performed at 37 °C showed micromolar (ESA in PBS: Kd = 367 ± 69 μM; HSA in PBS: Kd = 363 ± 83 μM) values of Kd for both ESA and HSA with testosterone (Fig. 6). ESA and HSA each contain a singular tryptophan residue located in the same spatial position (Trp213 in ESA, Trp214 in HSA). Trp213 is localized 12.2 Å from the testosterone molecule in TBS1 and 30.5 Å from the testosterone molecule in TBS2 in the ESA structure, suggesting that the TFQ experiments may only represent the binding of testosterone to the closely located TBS1. These studies were performed for the SA–testosterone complex in the presence of 20% DMSO to obtain testosterone concentrations high enough to saturate SA. At lower DMSO concentrations, the testosterone solution was unstable, and testosterone easily precipitated.
Fig. 6. TFQ for HSA and ESA caused by testosterone. Standard deviation of fluorescence intensities is represented by error bars.
3.5.2. Ultrafast affinity extraction (UAE)
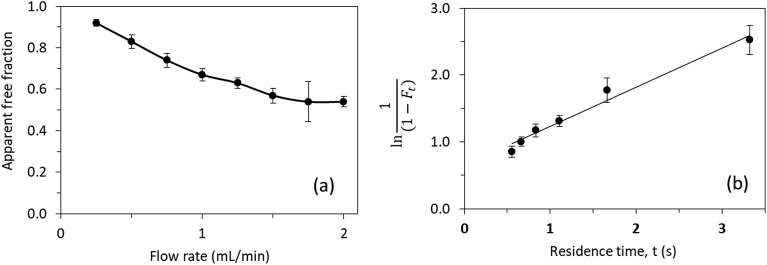
Fig. 7(a) shows the effect of varying the injection flow rate and column residence time on the apparent free fractions that were measured by UAE for testosterone in the presence of ESA. A consistent free fraction was obtained for mixtures of testosterone with ESA at an injection flow rate of at least 1.75 mL min–1. The free fraction that was measured under these conditions was viewed as representing the state of the original sample at equilibrium. Using this method at 37 °C in the presence of only phosphate buffer, the best estimate for nKa′ (pH 7.4) was 5.5 (±0.5) × 104 M–1, which corresponded to an overall equilibrium dissociation constant of 18 (±2) μM for testosterone binding to ESA. This result was confirmed through analysis of the same data by using eqn (5). The plot that was made according to eqn (5), as shown in Fig. 7(b), also gave a dissociation rate constant for ESA and testosterone of 0.59 (±0.05) s–1.
Fig. 7. (a) Effect of flow rate on the measured free fraction of testosterone in the presence of ESA. (b) Analysis of the measured free fractions of testosterone/ESA mixtures based on eqn (5). The error bars represent a range of ± 1 S.D.
Prior experiments17 in examining the interactions of testosterone with HSA by the same approach provided a similar value of 3.2–3.5 × 10⁴ M–1 for nKa′, or an overall equilibrium dissociation constant of 28.6–31.3 μM, and a dissociation rate constant of 2.17–2.20 s–1. These values for testosterone binding by HSA show good agreement with previous literature results obtained from the same system and through different techniques (e.g., equilibrium dialysis).18–20
3.5.3. Zonal elution
Zonal elution studies were carried out on both an HSA column and a control column of the same size that contained the same support but no immobilized protein. The control column was used in this case to measure and correct for any non-specific binding by testosterone to the support. The retention factor for testosterone on both columns was determined in replicate, and the difference in retention between these two columns was used to determine the retention factor that could be attributed solely to testosterone's binding to HSA.
The results of these studies are summarized in Table S1 (ESI).† The addition of only 40 μM citrate to 67 mM potassium phosphate buffer (pH 7.4) resulted in a 51% decrease in the global affinity of testosterone for HSA. The addition of 20% DMSO resulted in a 54% decrease in the global affinity.
4. Discussion
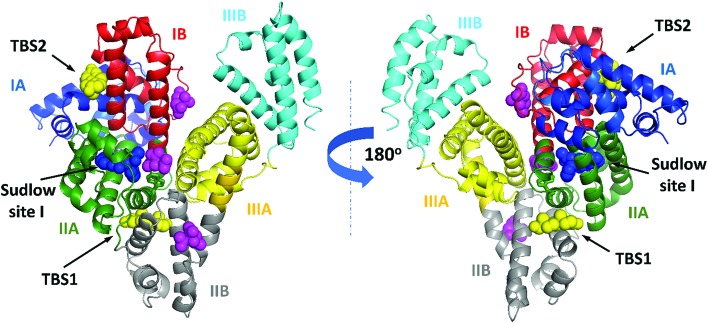
We have reported the structure of ESA complexed with testosterone determined at 2.15 Å resolution by X-ray crystallography and testosterone binding affinity for ESA (by TFQ and UAE) and HSA (by TFQ). The crystal structure shows two testosterone binding sites (Fig. 2 and 5), TBS1 (located between subdomains IIA and IIB) and TBS2 (located between subdomains IA and IB), which are comprised of residues that are mostly conserved in HSA and ESA. Our results are contrary to prior hypotheses, which were formulated solely from binding methods and stated that testosterone binds to Sudlow site I in subdomain IIA.1,22
Fig. 5. ESA domains and testosterone binding sites. The testosterone (yellow) and citrate molecules (magenta) are shown with atoms as spheres. Warfarin (from structure of HSA complexed with warfarin, PDB ID: 2BXD), which is bound at Sudlow site I,6 is shown with atoms as blue spheres. Testosterone was predicted to bind in Sudlow site I by Peters.1 The interactive collection of superpositions of the ESA–testosterone complex and other SA complexes with selected compounds that bind in TBS1 or TBS2 is available at ; https://molstack.bioreproducibility.org/c/hYYh/.
Binding studies of hydrophobic compounds such as testosterone are challenging because compounds of this nature are poorly soluble in water and often require the use of organic solvents. Fortunately, UAE experiments do not require high concentrations of ligands; this aspect of the experimental design allowed us to use aqueous phosphate buffers without the addition of DMSO to solubilize testosterone. The effective Kd of testosterone for ESA (18 μM) measured in the UAE experiments represents the cumulative affinity for all testosterone binding pockets in the protein, and these values agree with binding affinities of testosterone for HSA previously reported by Zheng et al.,17 Kragh-Hansen et al.,18 Pearlman and Crépy,19 and Vermeulen and Verdonck20 (ranging from 23.8 to 41.7 μM). However, this apparent global affinity measured in these studies did not allow us to separate affinities for specific sites or assess which site, if any, showed stronger binding of testosterone.
We then employed TFQ as an orthogonal method to measure the affinity of testosterone for HSA and ESA and determine whether binding studies conducted for testosterone and SA with different methods would provide similar results. The experiment had a limitation because of the necessity to use 20% DMSO to solubilize testosterone to a sufficiently high concentration. The measured Kd values from the TFQ experiments (ESA Kd = 367 ± 69 μM, HSA Kd = 363 ± 83 μM, Fig. 6) are an order of magnitude higher than those measured by UAE. We hypothesize that the observed differences in Kd stem from the presence of DMSO, as SA could have been in a state different from its native conformation. Previously, experiments with Raman spectroscopy suggested that the presence of 20% of DMSO resulted in partial unfolding of SA.47 To quantify the potential effects from DMSO on testosterone binding to SA in the TFQ experiments, we performed zonal elution studies in the presence of 20% DMSO and observed that testosterone's binding affinity for HSA decreased by 54%. This effect shows that DMSO was at least partially responsible for the decreased binding affinity of testosterone for albumin measured in the TFQ experiments. Another reason for the decreased affinity observed in the TFQ experiments may be the possibility that TFQ only measures the binding of testosterone to TBS1, which is much closer to the sole tryptophan residue. Therefore, the measured Kd from the TFQ experiment does not accurately reflect the cumulative affinity in physiological conditions. Nevertheless, we decided to include the TFQ results in our report. We believe that even though results of some experiments may not agree with those published in literature, possibly leading to the temptation to remove “the bad apple that spoils the bunch,” scientists should not discard each negative or nonconforming result they may obtain, as doing so is often the cause of non-reproducibility in biomedical research.48 These results further show an advantage of UAE and zonal elution studies over TFQ in the use of much lower concentrations of testosterone (20 μM vs. 1080 μM), which allowed for the measurement of its binding affinity for albumin in the absence of organic solvents.
The high concentration of citrate used in the crystallization conditions resulted in the presence of three citrate molecules bound to ESA in the crystal structure. To assess the potential effect of citrate on testosterone binding to SA, we performed additional zonal elution studies. The addition of 40 μM citrate to the phosphate buffer (pH 7.4) produced a 51% decrease in the overall binding strength of HSA for testosterone. Because citrate molecules were not observed in the testosterone binding sites in crystal structures that resulted from the same crystallization conditions (complexes with other ligands, data not shown), we hypothesize that the effect observed in the zonal elution studies represents non-competitive inhibition. During these experiments, the testosterone concentration was 20 μM. Testosterone concentration in adult male blood plasma ranges from 17.3–24.3 nM,14 while the normal citrate concentration in human plasma is about 100–150 μM.49 This suggests that in physiological conditions, citrate may affect the binding of testosterone to SA.
SA and its binding sites are highly conserved across species. HSA and ESA have 76.1% sequence identity; the helical secondary structures are well-conserved, maintaining a flexible structure of three homologous domains. Additionally, most of the residues forming drug and fatty acid binding sites are identical in HSA and ESA.50 These similarities, especially in the conservation of residues forming the binding sites, lead to the expectation that most ligands will bind to the same sites on HSA and ESA. The only known exception is diclofenac, which has been shown by structural studies to bind to Sudlow site II in ESA43 but to Sudlow site I in HSA.51 However, the structure of the HSA–diclofenac complex contains several fatty acids bound, which are known to change albumin conformation and may be the reason for the difference in the location of diclofenac binding.52 Since there are more published structural studies of ligand binding to HSA than to ESA, but only four drugs or organic compounds of a similar size (diclofenac,43,51 3,5-diiodosalicylic acid,6,53 naproxen,43,54 and a phosphorodithioate derivative of myristoyl cyclic phosphatidic acid55) have been structurally studied with both HSA and ESA, there is no comprehensive understanding of the similarities and differences in binding and possible transport and delivery mechanisms between HSA and ESA. Therefore, existing data suggest that binding of drugs and hormones to HSA and ESA is generally expected to be similar, although some compounds may show differences in binding depending on the residue conservation of a particular binding site.
In addition to the high sequence (Fig. S2†) and structure conservation between HSA and ESA, most of the amino acid residues comprising TBS1 and TBS2 in ESA are conserved and adopt nearly the same conformation in HSA (Fig. 4), thereby leading to essentially identical hydrophobic environments in both proteins (Fig. S3†). Moreover, the binding affinity of testosterone for ESA is similar to that of testosterone for HSA. Based on these results, we hypothesize that the location of testosterone binding sites in HSA is the same as in ESA. Indirect evidence to support this hypothesis was previously discovered in a mutagenic study;18 a Glu321Lys mutation in subdomain IIB decreased testosterone's binding affinity for HSA by 30%. The authors hypothesized that conformational changes or steric effects led to this reduction in binding affinity. In the ESA–testosterone complex, the testosterone molecule bound in TBS1 is positioned approximately 14 Å from the analogous Asp320 residue, which is located at the end of the α-helix that forms one side of the pocket. This relatively short distance and the reduction in affinity as a result of the Glu321Lys mutation suggest that testosterone also binds to TBS1 in HSA.
The experimental determination of testosterone binding sites reported here sheds new light on the topic of drug delivery and possible interference between testosterone and various compounds transported in the bloodstream. First, both TBS1 and TBS2 have previously been shown to bind various hydrophilic and hydrophobic molecules. In TBS1, ESA has been shown to bind etodolac (PDB ID: 5V0V), (S)-cetirizine11 (PDB ID: ; 5DQF), a phosphorodithioate derivative of myristoyl cyclic phosphatidic acid55 (Myr-2S-cPA) (PDB ID: ; 5ID9), and naproxen56 (PDB ID: ; 4OT2). HSA has been shown to bind ibuprofen6 (PDB ID: ; 2BXG), diflunisal6 (PDB ID: ; 2BXE), and halothane57 (PDB ID: ; 1E7B) at this location as well. Molecules previously shown to bind to SA at TBS2 are (R)-cetirizine11 (PDB ID: ; 5DQF), Tris, and the acetate and malonate ions. The overlapping of testosterone binding sites with those of various drugs suggests possible interference between transport of drugs and that of testosterone. Multiple drugs have been shown to decrease testosterone levels. For example, a retrospective cohort study58 and a meta-analysis59 showed that male opioid users had significantly lower testosterone levels than control subjects. Additionally, statins (drugs used to lower cholesterol levels in the blood) have been shown to lower testosterone levels in middle-aged hypercholesterolemic men;60 however, the main expected reason for this effect is lower levels of cholesterol, which is a precursor to testosterone. The mechanisms that lead to decreased testosterone levels in these cases are not fully understood but could be partially explained by the interference between drug and testosterone transport.
Second, non-enzymatic glycosylation (glycation), which is promoted in diabetic patients, may affect HSA and alter its drug-binding ability.61–63 A number of lysine residues are glycated in HSA in vitro, among which Lys136 and Lys162 (Lys161 in ESA) are located in TBS2, and Lys351 (Lys350 in ESA) is located in TBS1. Arg209 (Arg208 in ESA) in TBS1 can also undergo glycation-related modifications.64 Therefore, it is possible that testosterone binding may be affected upon glycation of SA. (R)-Cetirizine, which binds in TBS211, has been shown to exhibit stronger binding to glycated HSA than to the non-glycated form.65 Because of SA's glycation, cetirizine administration in diabetic patients may need to be distinct from the standard dose in order to achieve the same curative effect.65 Due to the overlap of cetirizine and testosterone binding sites and the similarities of the ligand–residue interactions, we speculate that the relationship between low testosterone levels and insulin resistance in men with type 2 diabetes66 may be related to the glycation of residues comprising TBS1 and TBS2.
Third, the overlap of TBS1 with fatty acid binding site 6 (FA6) suggests that fatty acid levels in the blood might affect testosterone binding to SA. The presence of free fatty acids has been shown to inhibit testosterone binding to both SA and SHBG, increasing the fraction of free testosterone available for uptake by tissues.67 However, Watanabe et al.68 showed that the binding of free fatty acids to bovine serum albumin (BSA) increased the binding strength of testosterone. Thus, the effect of bound fatty acids is not completely known and may prove critical in furthering our understanding of the bioavailability of albumin-bound testosterone, which remains controversial.69 In addition, testosterone is known to affect fatty acid concentrations via hormonal regulation; namely, the administration of testosterone has been shown to suppress regulatory enzymes in fatty acid synthesis, protect against hepatic steatosis (fatty liver), and decrease adiposity.70,71
The first structure of SA in complex with a steroid sex hormone indicates that testosterone does not bind in the previously suggested first Sudlow site but rather in two sites known to bind fatty acids and drugs. The molecular details of the albumin–testosterone interaction suggest a potential competition between hormones, other metabolites, and drugs for binding to SA. These findings may impact future biomedical investigations of the SA–hormone interaction and have potential clinical implications for the development of new therapeutic agents.
Contributions
M. P. C. and K. A. M. performed protein purification; K. A. M. performed protein crystallization and data collection; M. P. C. and K. B. H. refined the structure; M. P. C. performed TFQ experiments; S. R. B., K. S., and A. G. W. performed the UAE and zonal elution studies; M. P. C. and B. S. V. drafted and edited the manuscript; K. A. M., K. B. H., P. J. P., S. R. B., K. S., A. G. W., D. S. H., I. G. S., and W. M. critically read, discussed, and finalized the manuscript; D. S. H. supervised the UAE and zonal elution studies; W. M. conceptualized the project; and W. M. and I. G. S. supervised and coordinated the entire project.
Conflicts of interest
There are no conflicts of interest to declare.
Supplementary Material
Acknowledgments
We thank A. Wlodawer, D. R. Cooper, J. Grembecka, and M. Chruszcz for their critical reading and discussions of the manuscript. This work was supported by NIGMS grants (R01-GM117325, R01-GM117080, R01-GM118619) and federal funds awarded to W. M. by the National Institute of Allergy and Infectious Diseases, National Institutes of Health and the United States Department of Health and Human Services under contract no. HHSN272201200026C and HHSN272201700060C. The work that was conducted by D. S. H. was supported, in part, by the National Institutes of Health under R01-GM044391 and through a faculty seed grant from the University of Nebraska–Lincoln Research Council. We also thank K. Brister, Z. Wawrzak, S. Anderson, and J. Brunzelle for their assistance in data collection. This research used resources of the Advanced Photon Source, a U.S. Department of Energy (DOE) Office of Science User Facility operated for the DOE Office of Science by Argonne National Laboratory under Contract No. DE-AC02-06CH11357. Use of the LS-CAT Sector 21 was supported by the Michigan Economic Development Corporation and the Michigan Technology Tri-Corridor (Grant 085P1000817).
Footnotes
†Electronic supplementary information (ESI) available. See DOI: 10.1039/c8sc04397c
References
- Peters T. J., All About Albumin: Biochemistry, Genetics, and Medical Applications, Academic Press, San Diego, CA, USA, 1st edn, 1995. [Google Scholar]
- Handing K. B., Shabalin I. G., Kassaar O., Khazaipoul S., Blindauer C. A., Stewart A. J., Chruszcz M., Minor W. Chem. Sci. 2016;7:6635–6648. doi: 10.1039/c6sc02267g. [DOI] [PMC free article] [PubMed] [Google Scholar]
- Merlot A. M., Kalinowski D. S., Richardson D. R. Front. Physiol. 2014;5:299. doi: 10.3389/fphys.2014.00299. [DOI] [PMC free article] [PubMed] [Google Scholar]
- Sudlow G., Birkett D. J., Wade D. N. Mol. Pharmacol. 1976;12:1052–1061. [PubMed] [Google Scholar]
- Sudlow G., Birkett D. J., Wade D. N. Mol. Pharmacol. 1975;11:824–832. [PubMed] [Google Scholar]
- Ghuman J., Zunszain P. A., Petitpas I., Bhattacharya A. A., Otagiri M., Curry S. J. Mol. Biol. 2005;353:38–52. doi: 10.1016/j.jmb.2005.07.075. [DOI] [PubMed] [Google Scholar]
- Wang Z., Ho J. X., Ruble J. R., Rose J., Rüker F., Ellenburg M., Murphy R., Click J., Soistman E., Wilkerson L., Carter D. C. Biochim. Biophys. Acta. 2013;1830:5356–5374. doi: 10.1016/j.bbagen.2013.06.032. [DOI] [PubMed] [Google Scholar]
- Bhattacharya A. A., Grüne T., Curry S. J. Mol. Biol. 2000;303:721–732. doi: 10.1006/jmbi.2000.4158. [DOI] [PubMed] [Google Scholar]
- Curry S. Drug Metab. Pharmacokinet. 2009;24:342–357. doi: 10.2133/dmpk.24.342. [DOI] [PubMed] [Google Scholar]
- Bern M., Sand K. M. K., Nilsen J., Sandlie I., Andersen J. T. J. Controlled Release. 2015;211:144–162. doi: 10.1016/j.jconrel.2015.06.006. [DOI] [PubMed] [Google Scholar]
- Handing K. B., Shabalin I. G., Szlachta K., Majorek K. A., Minor W. Mol. Immunol. 2016;71:143–151. doi: 10.1016/j.molimm.2016.02.003. [DOI] [PMC free article] [PubMed] [Google Scholar]
- Petitpas I., Petersen C. E., Ha C., Bhattacharya A. A., Zunszain P. A., Ghuman J., V Bhagavan N., Curry S. Proc. Natl. Acad. Sci. U. S. A. 2003;100:6440–6445. doi: 10.1073/pnas.1137188100. [DOI] [PMC free article] [PubMed] [Google Scholar]
- Rooyackers O. E., Nair K. S. Annu. Rev. Nutr. 1997;17:457–485. doi: 10.1146/annurev.nutr.17.1.457. [DOI] [PubMed] [Google Scholar]
- Rifai N., Tietz Textbook of Clinical Chemistry and Molecular Diagnostics, Saunders, St. Louis, MO, USA, 6th edn, 2018. [Google Scholar]
- Melmed S., Polonsky K. S., Larsen P. R. and Kronenberg H. M., Williams Textbook of Endocrinology, Elsevier, Los Angeles, CA, USA, 13th edn, 2016. [Google Scholar]
- Södergård R., Bäckström T., Shanbhag V., Carstensen H. J. Steroid Biochem. 1982;16:801–810. doi: 10.1016/0022-4731(82)90038-3. [DOI] [PubMed] [Google Scholar]
- Zheng X., Bi C., Brooks M., Hage D. S. Anal. Chem. 2015;87:11187–11194. doi: 10.1021/acs.analchem.5b03007. [DOI] [PMC free article] [PubMed] [Google Scholar]
- Kragh-Hansen U., Minchiotti L., Brennan S. O., Sugita O. Eur. J. Biochem. 1990;193:169–174. doi: 10.1111/j.1432-1033.1990.tb19319.x. [DOI] [PubMed] [Google Scholar]
- Pearlman W. H., Crépy O. J. Biol. Chem. 1967;242:182–189. [PubMed] [Google Scholar]
- Vermeulen A., Verdonck L. Steroids. 1968;11:609–635. [PubMed] [Google Scholar]
- Fischer M. J., Bos O. J., van der Linden R. F., Wilting J., Janssen L. H. Biochem. Pharmacol. 1993;45:2411–2416. doi: 10.1016/0006-2952(93)90221-h. [DOI] [PubMed] [Google Scholar]
- Bertolini J., Goss N. and Curling J., Production of Plasma Proteins for Therapeutic Use, John Wiley & Sons, Inc., Hoboken, NJ, USA, 2013. [Google Scholar]
- Minor W., Cymborowski M., Otwinowski Z., Chruszcz M. Acta Crystallogr., Sect. D: Biol. Crystallogr. 2006;62:859–866. doi: 10.1107/S0907444906019949. [DOI] [PubMed] [Google Scholar]
- Otwinowski Z., Minor W. Methods Enzymol. 1997;276:307–326. doi: 10.1016/S0076-6879(97)76066-X. [DOI] [PubMed] [Google Scholar]
- Majorek K. A., Porebski P. J., Dayal A., Zimmerman M. D., Jablonska K., Stewart A. J., Chruszcz M., Minor W. Mol. Immunol. 2012;52:174–182. doi: 10.1016/j.molimm.2012.05.011. [DOI] [PMC free article] [PubMed] [Google Scholar]
- Vagin A., Teplyakov A. Acta Crystallogr., Sect. D: Biol. Crystallogr. 2010;66:22–25. doi: 10.1107/S0907444909042589. [DOI] [PubMed] [Google Scholar]
- Porebski P. J., Cymborowski M., Pasenkiewicz-Gierula M., Minor W. Acta Crystallogr., Sect. D: Biol. Crystallogr. 2016;72:266–280. doi: 10.1107/S2059798315024730. [DOI] [PMC free article] [PubMed] [Google Scholar]
- Murshudov G. N., Skubák P., Lebedev A. A., Pannu N. S., Steiner R. A., Nicholls R. A., Winn M. D., Long F., Vagin A. A. Acta Crystallogr., Sect. D: Biol. Crystallogr. 2011;67:355–367. doi: 10.1107/S0907444911001314. [DOI] [PMC free article] [PubMed] [Google Scholar]
- Emsley P., Lohkamp B., Scott W. G., Cowtan K. Acta Crystallogr., Sect. D: Biol. Crystallogr. 2010;66:486–501. doi: 10.1107/S0907444910007493. [DOI] [PMC free article] [PubMed] [Google Scholar]
- Winn M. D., Ballard C. C., Cowtan K. D., Dodson E. J., Emsley P., Evans P. R., Keegan R. M., Krissinel E. B., Leslie A. G. W., McCoy A., McNicholas S. J., Murshudov G. N., Pannu N. S., Potterton E. A., Powell H. R., Read R. J., Vagin A., Wilson K. S. Acta Crystallogr., Sect. D: Biol. Crystallogr. 2011;67:235–242. doi: 10.1107/S0907444910045749. [DOI] [PMC free article] [PubMed] [Google Scholar]
- Shabalin I. G., Porebski P. J., Minor W. Crystallogr. Rev. 2018;24:236–262. doi: 10.1080/0889311X.2018.1521805. [DOI] [PMC free article] [PubMed] [Google Scholar]
- Painter J., Merritt E. A. Acta Crystallogr., Sect. D: Biol. Crystallogr. 2006;62:439–450. doi: 10.1107/S0907444906005270. [DOI] [PubMed] [Google Scholar]
- Long F., Nicholls R. A., Emsley P., GraGraǽulisulis S., Merkys A., Vaitkus A., Murshudov G. N. Acta Crystallogr., Sect. D: Biol. Crystallogr. 2017;73:112–122. doi: 10.1107/S2059798317000067. [DOI] [PMC free article] [PubMed] [Google Scholar]
- Kowiel M., Jaskolski M., Dauter Z. Acta Crystallogr., Sect. D: Biol. Crystallogr. 2014;70:3290–3298. doi: 10.1107/S1399004714024572. [DOI] [PMC free article] [PubMed] [Google Scholar]
- Krissinel E., Henrick K. J. Mol. Biol. 2007;372:774–797. doi: 10.1016/j.jmb.2007.05.022. [DOI] [PubMed] [Google Scholar]
- Zimmerman M. D., Grabowski M., Domagalski M. J., Maclean E. M., Chruszcz M., Minor W. Methods Mol. Biol. 2014;1140:1–25. doi: 10.1007/978-1-4939-0354-2_1. [DOI] [PMC free article] [PubMed] [Google Scholar]
- Grabowski M., Langner K. M., Cymborowski M., Porebski P. J., Sroka P., Zheng H., Cooper D. R., Zimmerman M. D., Elsliger M. A., Burley S. K., Minor W. Acta Crystallogr., Sect. D: Biol. Crystallogr. 2016;72:1181–1193. doi: 10.1107/S2059798316014716. [DOI] [PMC free article] [PubMed] [Google Scholar]
- van de Weert M., Stella L. J. Mol. Struct. 2011;998:144–150. [Google Scholar]
- Ehrenberg M., Cronvall E., Rigler R. FEBS Lett. 1971;18:199–203. doi: 10.1016/0014-5793(71)80444-1. [DOI] [PubMed] [Google Scholar]
- Mallik R., Yoo M. J., Briscoe C. J., Hage D. S. J. Chromatogr. A. 2010;1217:2796–2803. doi: 10.1016/j.chroma.2010.02.026. [DOI] [PMC free article] [PubMed] [Google Scholar]
- Zheng X., Li Z., Podariu M. I., Hage D. S. Anal. Chem. 2014;86:6454–6460. doi: 10.1021/ac501031y. [DOI] [PMC free article] [PubMed] [Google Scholar]
- Holm L., Rosenström P. Nucleic Acids Res. 2010;38:545–549. doi: 10.1093/nar/gkq366. [DOI] [PMC free article] [PubMed] [Google Scholar]
- Sekula B., Bujacz A. J. Med. Chem. 2016;59:82–89. doi: 10.1021/acs.jmedchem.5b00909. [DOI] [PubMed] [Google Scholar]
- Porebski P. J., Sroka P., Zheng H., Cooper D. R., Minor W. Protein Sci. 2018;27:86–94. doi: 10.1002/pro.3272. [DOI] [PMC free article] [PubMed] [Google Scholar]
- Curry S. Vox Sang. 2002;83(Suppl. 1):315–319. doi: 10.1111/j.1423-0410.2002.tb05326.x. [DOI] [PubMed] [Google Scholar]
- Wang Y., Yu H., Shi X., Luo Z., Lin D., Huang M. J. Biol. Chem. 2013;288:15980–15987. doi: 10.1074/jbc.M113.467027. [DOI] [PMC free article] [PubMed] [Google Scholar]
- Batista A. N. L., Batista J. M., Ashton L., Bolzani V. S., Furlan M., Blanch E. W. Chirality. 2014;26:497–501. doi: 10.1002/chir.22351. [DOI] [PubMed] [Google Scholar]
- Majorek K. A., Kuhn M. L., Chruszcz M., Anderson W. F., Minor W. Protein Sci. 2014;23:1359–1368. doi: 10.1002/pro.2520. [DOI] [PMC free article] [PubMed] [Google Scholar]
- Costello L. C., Franklin R. B. HSOA J. Hum. Endocrinol. 2016;1:1–19. [PMC free article] [PubMed] [Google Scholar]
- Bujacz A. Acta Crystallogr., Sect. D: Biol. Crystallogr. 2012;68:1278–1289. doi: 10.1107/S0907444912027047. [DOI] [PubMed] [Google Scholar]
- Zhang Y., Lee P., Liang S., Zhou Z., Wu X., Yang F., Liang H. Chem. Biol. Drug Des. 2015;86:1178–1184. doi: 10.1111/cbdd.12583. [DOI] [PubMed] [Google Scholar]
- Curry S., Mandelkow H., Brick P., Franks N. Nat. Struct. Biol. 1998;5:827–835. doi: 10.1038/1869. [DOI] [PubMed] [Google Scholar]
- Sekula B., Zielinski K., Bujacz A. Int. J. Biol. Macromol. 2013;60:316–324. doi: 10.1016/j.ijbiomac.2013.06.004. [DOI] [PubMed] [Google Scholar]
- Lejon S., Cramer J. F., Nordberg P. Acta Crystallogr., Sect. F: Struct. Biol. Cryst. Commun. 2008;64:64–69. doi: 10.1107/S174430910706770X. [DOI] [PMC free article] [PubMed] [Google Scholar]
- Sekula B., Ciesielska A., Rytczak P., Koziołkiewicz M., Bujacz A. Biosci. Rep. 2016;36:e00338. doi: 10.1042/BSR20160089. [DOI] [PMC free article] [PubMed] [Google Scholar]
- Bujacz A., Zielinski K., Sekula B. Proteins. 2014;82:2199–2208. doi: 10.1002/prot.24583. [DOI] [PubMed] [Google Scholar]
- Bhattacharya A. A., Curry S., Franks N. P. J. Biol. Chem. 2000;275:38731–38738. doi: 10.1074/jbc.M005460200. [DOI] [PubMed] [Google Scholar]
- Rubinstein A. L., Carpenter D. M., Minkoff J. R. Clin. J. Pain. 2013;29:840–845. doi: 10.1097/AJP.0b013e31827c7b5d. [DOI] [PubMed] [Google Scholar]
- Bawor M., Bami H., Dennis B. B., Plater C., Worster A., Varenbut M., Daiter J., Marsh D. C., Steiner M., Anglin R., Coote M., Pare G., Thabane L., Samaan Z. Drug Alcohol Depend. 2015;149:1–9. doi: 10.1016/j.drugalcdep.2015.01.038. [DOI] [PubMed] [Google Scholar]
- Schooling C. M., Au Yeung S. L., Freeman G., Cowling B. J. BMC Med. 2013;11:57. doi: 10.1186/1741-7015-11-57. [DOI] [PMC free article] [PubMed] [Google Scholar]
- Anguizola J., Matsuda R., Barnaby O. S., Hoy K. S., Wa C., DeBolt E., Koke M., Hage D. S. Clin. Chim. Acta. 2013;425:64–76. doi: 10.1016/j.cca.2013.07.013. [DOI] [PMC free article] [PubMed] [Google Scholar]
- Ruiz-Cabello F., Erill S. Clin. Pharmacol. Ther. 1984;36:691–695. doi: 10.1038/clpt.1984.241. [DOI] [PubMed] [Google Scholar]
- Gadgil H. S., Bondarenko P. V., Treuheit M. J., Ren D. Anal. Chem. 2007;79:5991–5999. doi: 10.1021/ac070619k. [DOI] [PubMed] [Google Scholar]
- Barnaby O. S., Cerny R. L., Clarke W., Hage D. S. Clin. Chim. Acta. 2011;412:277–285. doi: 10.1016/j.cca.2010.10.018. [DOI] [PMC free article] [PubMed] [Google Scholar]
- Liu X., Du Y., Sun W., Kou J., Yu B. Spectrochim. Acta, Part A. 2009;74:1189–1196. doi: 10.1016/j.saa.2009.09.033. [DOI] [PubMed] [Google Scholar]
- Grossmann M., Thomas M. C., Panagiotopoulos S., Sharpe K., MacIsaac R. J., Clarke S., Zajac J. D., Jerums G. J. Clin. Endocrinol. Metab. 2008;93:1834–1840. doi: 10.1210/jc.2007-2177. [DOI] [PubMed] [Google Scholar]
- Mooradian A. D., Pamplona D. M., Viosca S. P., Korenman S. G. J. Steroid Biochem. 1988;29:369–370. doi: 10.1016/0022-4731(88)90040-4. [DOI] [PubMed] [Google Scholar]
- Watanabe S., Tani T., Watanabe S., Seno M. Lipids. 1990;25:633–638. doi: 10.1007/BF02536014. [DOI] [PubMed] [Google Scholar]
- Manni A., Pardridge W. M., Cefalu W., Nisula B. C., Bardin C. W., Santner S. J., Santen R. J. J. Clin. Endocrinol. Metab. 1985;61:705–710. doi: 10.1210/jcem-61-4-705. [DOI] [PubMed] [Google Scholar]
- Kelly D. M., Nettleship J. E., Akhtar S., Muraleedharan V., Sellers D. J., Brooke J. C., McLaren D. S., Channer K. S., Jones T. H. Life Sci. 2014;109:95–103. doi: 10.1016/j.lfs.2014.06.007. [DOI] [PubMed] [Google Scholar]
- Koutsari C., Ali A. H., Nair K. S., Rizza R. A., O'Brien P., Khosla S., Jensen M. D. J. Clin. Endocrinol. Metab. 2009;94:3414–3423. doi: 10.1210/jc.2009-0165. [DOI] [PMC free article] [PubMed] [Google Scholar]
Associated Data
This section collects any data citations, data availability statements, or supplementary materials included in this article.


