

Abstract
Objectives
To determine the association between diet during pregnancy and infancy, including breastfeeding vs formula feeding, solid food introduction, and the infant intestinal microbiome.
Study design
Infants participating in the Vitamin D Antenatal Asthma Reduction Trial were included in this study (n = 323). Maternal and infant diets were assessed by questionnaire. Infant stool samples were collected at age 3–6 months. Stool sequencing was performed using the Roche 454 platform. Analyses were stratified by race/ethnicity.
Results
Breastfeeding, compared with formula feeding, was independently associated with infant intestinal microbial diversity. Breastfeeding also had the most consistent associations with individual taxa that have been previously linked to early-life diet and health outcomes (eg, Bifidobacterium). Maternal diet during pregnancy and solid food introduction were less associated with the infant gut microbiome than breastfeeding status. We found evidence of a possible interaction between breastfeeding and child race/ethnicity on microbial composition.
Conclusions
Breastfeeding vs formula feeding is the dietary factor that is most consistently independently associated with the infant intestinal microbiome. The relationship between breastfeeding status and intestinal microbiome composition varies by child race/ethnicity. Future studies will need to investigate factors, including genomic factors, which may influence the response of the microbiome to diet.
Trial registration
Maternal diet during pregnancy and diet during infancy are associated with child health outcomes.1,2 The child intestinal microbiome, the largest source of postnatal immune stimulation, is also associated with child health and disease.3,4 We and others hypothesize that maternal or child diet may influence child immune development and disease risk by modifying the composition of the child’s intestinal microbial flora.5,6
Breastfeeding has been shown to increase specific taxa (ie, a group of related organisms such as those of a species, genus, class, etc) in the gut such as Bifidobacterium spp while decreasing Clostridium spp and Bacteroides spp; opposite findings are reported with formula feeding.7–10 However, the literature has been limited by small sample sizes, use of culture-dependent techniques, and homogenous source populations. We reported on determinants of the infant gut microbiome at age 3–6 months.11 In that analysis, factor analysis revealed 4 distinct intestinal microbiome types that could be differentiated based on differences in microbial composition. Race/ethnicity, mode of delivery, breastfeeding status, and cord blood vitamin D all exhibited associations with likelihood of these microbiome types. Here, we performed a more detailed determination of the association between maternal diet during pregnancy and diet during infancy and the child intestinal microbiome in a large, multiethnic population. Because we and others have shown that race/ethnicity is associated with the intestinal microbiota11,12 and child health,13 we stratified our main findings by race/ethnicity. Understanding the effect of maternal diet during pregnancy and infant diet on the early-life gut microbiome will inform approaches to optimize microbiome-influenced immune development through potential dietary interventions.
Methods
The Vitamin D Antenatal Asthma Reduction Trial was a randomized, controlled trial of high (4400 IU) vs standard dose (400 IU) daily vitamin D during pregnancy (ClinicalTrials.gov: NCT00920621). The study design and primary outcome have been published previously.14,15 Briefly, Vitamin D Antenatal Asthma Reduction Trial enrolled 881 pregnant women at 3 clinical sites in the US (Boston, Massachusetts; St. Louis, Missouri; and San Diego, California). Inclusion criteria included a personal history of asthma or allergy in the pregnant woman or in the father of the fetus. The intervention phase occurred during pregnancy, and after birth infants were followed every 3 months for the development of respiratory disease and other outcomes.
An ancillary study of the child intestinal microbiome was initiated during follow-up, after roughly one-half of the children reached 3 months of age. Stool samples were collected from infants between age 3 and 6 months. Caretakers were instructed to collect approximately 2.5 milliliters of child stool from a diaper using a tongue depressor 1–2 days prior to a study visit and to store the sample in a home freezer until bringing it to the visit in a freezer pack. The only exclusion criterion for stool collection was antibiotic use by the infant in the prior 7 days. The study followed procedures in accordance with the ethical standards of the participating institutions, and approval was obtained from the institutions’ committees on human subjects.
A validated, abbreviated food frequency questionnaire asking pregnant women how often they ate a food or food group was obtained at enrollment and in the third trimester.16 Principal components (PCs) analysis was used to reduce the maternal diet to fewer variables. The top principal component was used in regression models.
Questions regarding the child diet were asked beginning at age 6 months. We used responses obtained at the 6 month questionnaire (or later if 6-month data was incomplete or missing) to ascertain the infant diet at the time of the stool collection. For details on the determination of breastfeeding, formula feeding, or solid food status (Appendix; available at www.jpeds.com). A flow diagram is provided in (Figure 1; available at www.jpeds.com).
Figure 1.

Flow diagram of subjects included in study. A portion of this figure has been published previously.14
Sequencing of bacterial 16S ribosomal RNA was performed using the Roche 454 Titanium platform (454 Life Sciences, Branford, Connecticut). Filtering, trimming, and chimera checking were performed as previously described.17,18 Sequences were grouped according to similarity using closed reference operational taxonomic unit classification in Qiime.19 High quality reads were classified from phylum to genus level at a confidence threshold of 0.5 using the Ribosomal Database Project Naive Bayesian Classifier v 2.2, training set 6.20,21 Samples were scaled to 1000 reads prior to analysis. To fit model assumptions, read counts were used in multivariable regression models. Operational taxonomic units identified at least 10 times in at least 10 subjects were used in microbiome-wide analyses.
Statistical Analyses
We chose 4 genera to evaluate in detail based on prior infant feeding studies and associations with health outcomes7–10,22–25: Bacteroides, Lactobacillus, Bifidobacterium, and Clostridium. We calculated the Shannon diversity index and richness (total number of taxa identified), which have been generally associated with positive health outcomes. We used simple and multivariable linear and negative binomial regression to determine the association between maternal and child diet and these outcomes. Covariates in multivariable analysis, chosen on the basis of prior studies,7,11 included mode of delivery, child race/ethnicity (African American, Hispanic, white, other), age at stool collection, treatment arm, and maternal education. Household income was not included because 22% of subjects did not know or preferred not to report household income.
We explored whether there were differences in the infant microbiome response to diet by including an interaction term between race/ethnicity and breast milk vs formula in regression models and by stratifying by race/ethnicity if an interaction was found. Cut-off P values for statistical significance were selected a priori. P values of .05 or less indicated significance. All analyses were performed in Stata/IC v 12 (StataCorp, College Station, Texas) and R (packages VEGAN, The R Foundation for Statistical Computing,Vienna, Austria). Missing data were considered missing at random and complete case analysis was employed.
We used Multivariate Association with Linear Models26 to analyze associations between breastfeeding vs formula feeding and individual bacterial genera in a microbiome-wide analysis stratified by race/ethnicity. Analysis covariates were the same as for multivariable regression analyses described above, and results were considered significant at a false discovery rate of .05 or less.
Results
A total of 323 infants had stool sample microbiome sequencing data and known breastfeeding vs formula feeding status (Figure 1); 95 infants were exclusively breastfed, and 169 were exclusively formula fed at the time of the stool collection. As shown in Table I, infants who were breastfed were more likely to be delivered vaginally (74% vs 62%), more likely to be Hispanic (39% vs 25%) or white (37% vs 9%) than African American (16% vs 62%), and less likely to have had solid food introduced into their diet by the time of stool collection (33% vs 48%) compared with formula-fed infants. Infants who were breastfed had mothers with higher educational levels (P < .001) and higher household incomes (P < .001).
Table I.
Demographics of 323 infants who provided evaluable stool samples in the study, stratified by diet at time of stool collection
| Overall (n = 323) | Mixed breast and formula fed (n = 43)* | Breastfed only (n = 95)* | Formula fed only (n = 169)* | P value† | |
|---|---|---|---|---|---|
| Vaginal delivery (%) | 214 (66) | 30 (70) | 70 (74) | 104 (62) | .05 |
| Ever breastfed (%) | 176 (55) | 43 (100) | 95 (100) | 29 (17) | <.001 |
| Race/ethnicity of child (%) | |||||
| African American | 137 (42) | 9 (21) | 15 (16) | 105 (62) | <.001 |
| Hispanic | 102 (32) | 16 (37) | 37 (39) | 43 (25) | |
| White | 67 (21) | 15 (35) | 35 (37) | 15 (9) | |
| Other | 17 (5) | 3 (7) | 8 (8) | 6 (4) | |
| Male sex of child (%) | 175 (54) | 24 (56) | 54 (57) | 90 (53) | .66 |
| Age in d at stool sample collection (mean, range) | 141 (76–210) | 139 (93–188) | 139 (78–206) | 145 (76–210) | .08 |
| On solid food at time of stool collection (%) | 133 (42) | 20 (48) | 30 (33) | 80 (48) | .02 |
| Randomized to treatment arm (%) | 177 (55) | 30 (70) | 51 (54) | 87 (51) | .73 |
| Maternal education (%) | <.001 | ||||
| Less than high school | 40 (12) | 4 (9) | 4 (4) | 30 (18) | |
| High school/technical school | 98 (30) | 7 (16) | 18 (19) | 64 (38) | |
| Some college | 73 (23) | 8 (19) | 11 (12) | 51 (30) | |
| College graduate or higher | 112 (35) | 24 (56) | 62 (65) | 24 (14) | |
| Household income | <.001 | ||||
| Less than $30 000 | 99 (31) | 6 (14) | 10 (11) | 75 (44) | |
| $30 000–$49 999 | 38 (12) | 6 (14) | 16 (17) | 15 (9) | |
| $50 000–$74 999 | 36 (11) | 8 (19) | 14 (15) | 10 (6) | |
| $75 000–$99 999 | 35 (11) | 5 (12) | 19 (20) | 10 (6) | |
| $100 000–$149 999 | 28 (9) | 5 (12) | 18 (19) | 5 (3) | |
| Over $150 000 | 15 (5) | 3 (7) | 9 (9) | 3 (2) | |
| Do not know/refused | 72 (22) | 10 (23) | 9 (9) | 51 (30) | |
Significant (P <.05) results are in bold.
Numbers do not add to 323 because of missing infant diet data.
P value for comparison of breastfed only vs formula fed only infants. T test was used for analysis of age at stool sample collection and χ2 tests were used for all other comparisons.
We analyzed maternal diet as the first principal component of the maternal food frequency questionnaire responses, which represented high intake of vegetables and low intake of processed meats and deep fried foods (Tables II and III; available at www.jpeds.com). In unadjusted analyses, high intake of vegetables and low intake of processed meats and deep fried foods during pregnancy was positively associated with Shannon diversity index (increase of 0.08 for every 1 increase in the first PC (PC 1); P < .001) and richness (increase of 1.56 for every 1 increase in PC 1; P < .001; Table IV). However, in models adjusted for demographic and other dietary characteristics, these differences were no longer statistically significant.
Table II.
PCs of maternal diet and eigenvalues
| Components | Eigenvalue | Proportion | Cumulative |
|---|---|---|---|
| PC 1 | 3.505 | 0.195 | 0.195 |
| PC 2 | 2.813 | 0.156 | 0.351 |
| PC 3 | 1.211 | 0.067 | 0.418 |
| PC 4 | 1.150 | 0.064 | 0.482 |
| PC 5 | 1.081 | 0.060 | 0.542 |
PCs analysis using oblique rotation was used to reduce the maternal diet to fewer variables to reduce multiple testing, summarize correlated dietary variables, and limit the number of covariates included in adjusted analyses of the association of the child diet and microbiome. The top PC was used in regression models. The eigenvalue gives a measure of how much variance in the data is reflected by each principal component. The proportion of variance explained is given for each PC, in addition to the cumulative variance explained.
Table III.
PCs and maternal dietary factors
| Dietary variables | PC 1 | PC 2 | PC 3 | PC 4 | PC 5 | Unexplained |
|---|---|---|---|---|---|---|
| Processed meats | −0.39 | 0.25 | −0.03 | 0.06 | 0.06 | 0.39 |
| Carrots | 0.28 | 0.12 | 0.05 | −0.08 | −0.19 | 0.64 |
| Broccoli, cauliflower, cabbage, brussel sprouts | 0.20 | 0.30 | 0.28 | 0.26 | −0.01 | 0.44 |
| Low fat milk products | 0.31 | 0.12 | 0.16 | −0.29 | −0.05 | 0.49 |
| Other vegetables | 0.32 | 0.23 | 0.07 | 0.06 | 0.01 | 0.48 |
| Beef, pork, or lamb | −0.20 | 0.26 | 0.04 | 0.04 | −0.09 | 0.66 |
| Dark green leafy vegetables | 0.29 | 0.22 | 0.10 | 0.37 | 0.05 | 0.39 |
| Baked products | −0.16 | 0.23 | −0.16 | 0.03 | −0.56 | 0.38 |
| Margarine | −0.21 | 0.27 | 0.14 | 0.02 | 0.26 | 0.54 |
| Citrus fruits | 0.07 | 0.23 | −0.68 | 0.01 | 0.29 | 0.19 |
| Pasta, rice, or noodles | −0.05 | 0.32 | 0.05 | −0.07 | −0.44 | 0.49 |
| Whole milk dairy foods | −0.14 | 0.28 | 0.02 | −0.44 | 0.09 | 0.47 |
| Other fruit | 0.27 | 0.23 | −0.49 | 0.06 | 0.11 | 0.29 |
| Seafood | −0.01 | 0.23 | 0.22 | 0.31 | 0.33 | 0.56 |
| Whole grain foods | 0.26 | 0.24 | 0.06 | −0.08 | −0.14 | 0.57 |
| Deep fried foods | −0.38 | 0.21 | −0.13 | 0.19 | −0.12 | 0.30 |
| Whole eggs | −0.03 | 0.26 | 0.15 | −0.57 | 0.29 | 0.32 |
| Added salt | −0.17 | 0.09 | 0.20 | 0.18 | 0.19 | 0.74 |
Table IV.
Association between maternal intake of vegetables and low intake of processed meats and deep fried foods during pregnancy, infant breastfeeding vs formula feeding, infant solid food introduction, and the infant intestinal microbiome
| Maternal diet (PC 1) during pregnancy | |||||
| Low (n = 129) | High (n = 151) | Unadjusted β (95% CI) | β adjusted for demographic variables* (95% CI) | β adjusted for demographic and dietary variables† (95% CI) | |
| Shannon index | 2.09 (0.43) | 2.30 (0.42) | 0.08 (0.05, 0.11) P < .001 | 0.02 (−0.02, 0.05) P = .40 | −0.0002 (−0.04, 0.04) P = .99 |
| Richness | 28.83 (7.34) | 34.01 (7.20) | 1.56 (1.05, 2.06) P < .001 | 0.13 (−0.50, 0.76) P = .68 | 0.11 (−0.58, 0.70) P = .71 |
| Bacteroides | 4 (0–225) | 14 (0–147) | −0.19 (−0.35, −0.02) P = .03 | 0.07 (−0.18, 0.32) P = .60 | 0.04 (−0.22, 0.30) P = .77 |
| Bifidobacterium | 71 (17–153) | 58 (14–126) | 0.01 (−0.09, 0.10) P = .88 | −0.04 (−0.17, 0.09) P = .55 | −0.01 (−0.15, 0.13) P = .89 |
| Lactobacillus | 0 (0–5) | 0 (0–1) | −0.04 (−0.33, 0.26) P = .81 | −0.03 (−0.40, 0.35) P = .89 | 0.48 (0.06, 0.90) P = .02 |
| Clostridium | 2 (0–17) | 1 (0–8) | −0.15 (−0.29, −0.01) P = .03 | −0.10 (−0.28, 0.08) P = .28 | −0.05 (−0.25, 0.16) P = .65 |
| Breastfeeding vs formula feeding | |||||
| Formula fed (n = 169) | Breastfed (n = 95) | Unadjusted β (95% CI) | β adjusted for demographic variables* (95% CI) | β adjusted for demographic and dietary variables‡ (95% CI) | |
| Shannon Index | 2.37 (0.36) | 1.92 (0.42) | −0.46 (−0.55, −0.36) P < .001 | −0.36 (−048, −0.24) P < .001 | −0.37 (0.49, −0.26) P < .001 |
| Richness | 34.8 (6.40) | 26.5 (7.13) | −8.38 (−10.06, −6.69) P < .001 | −5.86 (−7.89, −3.82) P < .001 | −5.95 (−8.02, −3.87) P < .001 |
| Bacteroides | 13 (0–122) | 3 (0–389) | 0.60 (0.03, 1.18) P = .04 | 0.009 (−0.85, 0.87) P = .98 | 0.04 (−0.83, 0.91) P = .93 |
| Bifidobacterium | 56 (10–118) | 93 (23–171) | 0.26 (−0.09, 0.61) P = .14 | 0.51 (0.08, 0.94) P = .02 | 0.53 (0.08, 0.98) P = .02 |
| Lactobacillus | 0 (0–0) | 0 (0–26) | 2.11 (1.16, 3.06) P < .001 | 3.87 (2.72, 5.02) P < .001 | 4.28 (3.06, 5.51) P < .001 |
| Clostridium | 2 (0–8) | 2 (0–18) | 0.59 (0.05, 1.13) P = .03 | 0.75 (0.01, 1.50) P = .05 | 0.86 (0.13, 1.61) P = .02 |
| Solid food introduction | |||||
| No solids introduced (n = 161) | Solids introduced (n = 113) | Unadjusted β (95% CI) | β adjusted for demographic variables* (95% CI) | β adjusted for demographic and dietary variables§ (95% CI) | |
| Shannon Index | 2.14 (0.43) | 2.30 (0.43) | 0.16 (0.06, 0.27) P = .002 | 0.13 (0.004, 0.25) P = .06 | 0.10 (−0.02, 0.22) P = .11 |
| Richness | 30.5 (7.40) | 33.5 (7.72) | 3.10 (1.27, 4.92) P = .001 | 2.20 (−0.04, 4.44) P = .05 | 1.70 (−0.46, 3.85) P = .12 |
| Bacteroides | 7 (0–219) | 15 (0–157) | −0.10 (−0.65, 0.46) P = .74 | −0.13 (−0.87, 0.61) P = .73 | −0.07 (−0.83, 0.69) P = .86 |
| Bifidobacterium | 66 (15–142) | 66 (14–134) | 0.02 (−0.31, 0.36) P = .89 | −0.04 (−0.49, 0.41) P = .86 | −0.001 (−0.45, 0.45) p = 1.00 |
| Lactobacillus | 0 (0–1) | 0 (0–1) | −0.02 (−0.99, 0.94) P = .96 | −0.13 (−1.50, 1.23) P = .84 | 0.63 (−0.62, 1.88) P = .32 |
| Clostridium | 2 (0–9) | 2 (0–11) | −0.03 (−0.55, 0.50) P = .92 | 0.80 (0.06,1.55) P = .03 | 0.75 (0.004, 1.49) P = .05 |
Significant (P <.05) results are in bold.
The PC 1 of maternal diet during pregnancy was dichotomized at its mean for comparisons of low and high groups, and used as a continuous variable in regression models.
Mean, SD for normally distributed variables (Shannon index, Richness).
Median, 25%−75% range for count data.
Linear regression was used in analyses of Shannon Index, and richness and negative binomial regression was used in analysis of bacterial counts. β coefficients of bacterial counts represent a difference in the log count, formula fed is reference.
The Shannon index is a measure of diversity that accounts both for number of species present and for how evenly distributed bacterial counts are across the species that are present.
Demographic variables: treatment, mode of delivery, age, maternal education, and race/ethnicity of child.
Dietary variables: infant breastfeeding vs formula feeding and infant solid food.
Dietary variables: infant solid food and first principal component of maternal diet (high in vegetables and low in processed meats and deep fried foods).
Dietary variables: infant breastfeeding vs formula feeding and first principal component of maternal diet (high in vegetables and low in processed meats and deep fried foods).
In unadjusted analyses of 4 genera selected a priori based on prior literature suggesting associations with early diet and health outcomes,7–10,22–25 we found that high maternal intake of vegetables and low intake of processed meats and deep fried foods was inversely associated with Bacteroides spp (decrease in 0.19 log counts for every 1 increase in PC 1; P = .03) and Clostridium spp (decrease in 0.15 log counts for every 1 increase in PC 1; P = .03) counts (Table IV). However, after adjusting for demographic variables (mode of delivery, age, treatment, maternal education, and race/ethnicity), breastfeeding vs formula feeding and solid food introduction, the only association between the maternal diet and taxa selected a priori for analysis was a positive association with Lactobacillus spp (mean difference = 0.48; P = .02).
We did not find associations between the second principal component of the maternal diet (representing high pasta, rice, and noodle intake) and diversity or these 4 genera.
In crude analyses, both the Shannon diversity index and richness were significantly lower among breastfed infants compared with formula-fed infants (1.92 ± 0.42 vs 2.37 ± 0.36, P < .001; and 26.5 ± 7.13 vs 34.8 ± 6.40, P < .001, respectively, Table IV). These differences remained after adjustment for demographic and other dietary variables. In analyses of genera selected a priori for analysis, adjusted for demographic factors, we observed significantly higher relative abundances of Bifidobacterium spp (mean difference 0.51; P = .02), Lactobacillus spp (mean difference 3.87; P < .001), and Clostridium spp (mean difference 0.75; P = .05) among breastfed vs formula-fed infants. Results were similar after adding solid foods and maternal diet as covariates to the adjusted model.
In unadjusted analyses, both the Shannon diversity index and richness were significantly higher among infants who had solid foods introduced by the time of the stool collection compared with infants who had not yet had solid foods introduced (2.30 ± 0.43 vs 2.14 ± 0.43, P = .002 and 33.5 ± 7.72 vs 30.5 ± 7.40, P = .001, respectively; Table IV). However, these differences were attenuated and no longer statistically significant after adjustment for demographic factors alone, and after adjustment for demographic and other dietary factors. We did not detect an association between solid foods and relative abundance of Bacteroides spp, Bifidobacterium spp, Lactobacillus spp, or Clostridia spp in unadjusted analyses. After adjusting for demographic variables, solid food introduction was positively associated with Clostridium spp (mean difference = 0.80 log counts; P = .03) and this association remained significant after addition of infant breastfeeding vs formula feeding status and maternal diet to the adjusted model (mean difference = 0.75 log counts, P = .05).
We next asked whether race/ethnicity influenced the association between the infant’s diet and the intestinal microbiome by including an interaction term between race/ethnicity and breast milk vs formula in models adjusted for demographic and other dietary variables. There was no significant interaction with regard to Shannon Index (P = .17), richness (P = .66), Bacteroides spp counts (P = .55), or Clostridium spp counts (P = .65). There was a trend toward race/ethnicity × breastfeeding status interactions with regard to Bifidobacterium spp counts (P = .10) and Lactobacillus spp counts (P = .09). Consequently, we analyzed the association between breastfeeding status and those taxa (Bifidobacterium and Lactobacillus), stratified by race/ethnicity. We found that Bifidobacterium spp counts were similar among breastfed and formula-fed African American infants, and Hispanic and white breastfed infants had higher levels of Bifidobacterium spp compared with formula-fed Hispanic and White infants (African American mean difference = 0.38 log counts, Hispanic mean difference = 0.52, White mean difference 0.50; Table V and Figure 2). Conversely, Lactobacillus spp counts tended to be higher among breastfed African American infants compared with breastfed Hispanic and White infants (African American mean difference = 6.34 log counts, Hispanic mean difference = 2.53, White mean difference 3.08; Table V and Figure 2).
Table V.
Multivariable models of the association between breastfeeding vs formula feeding and the infant intestinal microbiome, stratified by infant race/ethnicity
| β adjusted for demographic and dietary variables (95% CI) | African American (n = 120), Adjusted β (95% CI) | Hispanic (n = 80), Adjusted β (95% CI) | White (n = 50), Adjusted β (95% CI) | Breast milk and race/ethnicity interaction P value | |
|---|---|---|---|---|---|
| Bifidobacterium | 0.56 (0.12, 1.00) P = .01 | 0.38 (−0.37, 1.13) P = .32 | 0.52 (−0.14, 1.19) P = .12 | 0.50 (−0.57, 1.56) P = .36 | .10 |
| Lactobacillus | 3.50 (2.14, 4.86) P < .001 | 6.35 (3.99, 8.71) P < .001 | 2.53 (0.14, 4.91) P = .04 | 3.08 (−0.66, 6.82) P = .11 | .09 |
Significant (P <.05) results are in bold.
Results shown for negative binomial regression analyses. All models adjusted for treatment, mode of delivery, age, race/ethnicity of child, infant solid food, and first principal component of maternal diet (high in vegetables and low in processed meats and deep fried food).
Figure 2.

Average (±SE) counts per 1000 reads of A, Bacteroides, B, Bifidobacterium, C, Lactobacillus, and D, Clostridia spp among infants fed breast milk or formula, stratified by race/ethnicity. There were interactions between race/ethnicity and breastfeeding vs formula on relative abundances of Bifidobacterium and Lactobacillus (P ≤ .10) in negative binomial regression analyses.
When maternal education was added as a covariate, the strengths of interactions between breastfeeding vs formula feeding status and race/ethnicity were weakened (Bifidobacterium spp P = .12; Lactobacillus spp P = .21). Because maternal education and race/ethnicity were highly associated (P = < .001 for χ2 test), it is likely that interaction strengths were attenuated due to collinearity. Excluding race/ethnicity from the model, the interaction between breastfeeding status and maternal education was not significant for either Bifidobacterium spp (P = .45) or Lactobacillus spp (P = .73), further supporting stronger associations of microbial differences by infant diet group with race/ethnicity than maternal education.
We identified significant differences in relative abundances of taxa between breastfed and formula- fed infants in adjusted analyses stratified by race/ethnicity (Figure 3 and Table VI; available at www.jpeds.com). As in our stratified analysis of a priori taxa, Lactobacillus spp were significantly enriched in African American and Hispanic infants who are breastfed. We note overlap and heterogeneity in the response to breastfeeding among the top associations among taxa and diet. Among African Americans and Hispanics, Lachnospiraceae spp and Ruminococcaceae spp are reduced in infants who are breastfed and Staphylococcus spp are enriched among Hispanic infants who are breastfed and Eubacterium spp are reduced among White infants who are breastfed. With maternal education included as a covariate, these results are largely unchanged (Table VII; available at www.jpeds.com).
Figure 3.
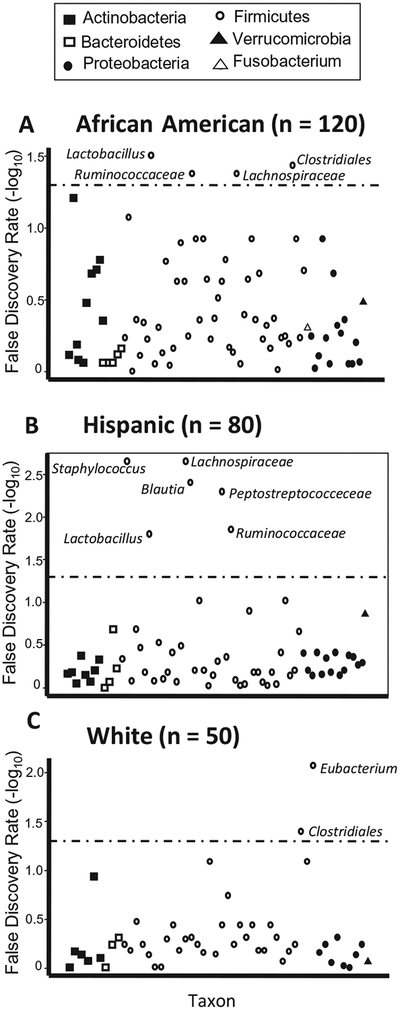
Associations between bacterial taxa and breastfeeding vs formula, stratified by race/ethnicity. Results are from adjusted Multivariate Association with Linear Models analyses. False discovery rates are plotted for associations with genera or lowest identifiable taxonomic levels, with the dashed line indicating a false discovery rate of 0.05.
Table VI.
Genera (or lowest identifiable taxonomic level) identified as significantly different (false discovery rate <.05) between breastfed and formula-fed infants, after adjustment for age, mode of delivery, maternal diet, whether the child was on solid foods at the time of stool collection, and study treatment, stratified by child race/ethnicity
| Races/ethnicities | Phylum | Genus (or lowest identified taxonomic level) | β-coefficient* | P value | FDR |
|---|---|---|---|---|---|
| African American | Firmicutes | Lactobacillus | 0.009573 | .0009 | 0.03 |
| Firmicutes | Clostridiales | −0.03832 | .002 | 0.04 | |
| Firmicutes | Lachnospiraceae | −0.10325 | .002 | 0.04 | |
| Firmicutes | Ruminococcaceae | −0.09866 | .003 | 0.04 | |
| Hispanic | Firmicutes | Staphylococcus | 0.006749 | 3.80 × 10−05 | 0.002 |
| Firmicutes | Lachnosp raceae | −0.10673 | 4.29 × 10−05 | 0.002 | |
| Firmicutes | Blautia | −0.10623 | .0001 | 0.004 | |
| Firmicutes | Peptostreptococceceae | −0.0237 | .0002 | 0.005 | |
| Firmicutes | Ruminococcaceae | −0.04456 | .0007 | 0.01 | |
| Firmicutes | Lactobacillus | 0.011634 | .0009 | 0.02 | |
| White | Firmicutes | Eubacterium | −0.04486 | 8.67 × 10−05 | 0.008 |
| Firmicutes | Clostridiales | −0.03179 | .0008 | 0.04 |
Results shown for negative binomial regression analyses. β-coefficient is reflects the average difference in relative abundance between the breastfed and formula-fed groups after covariate adjustment.
Formula fed is reference group.
Table VII.
Genera (or lowest identifiable taxonomic level) identified as significantly different (FDR <.05) between breastfed and formula-fed infants, after adjustment for age, mode of delivery, maternal diet, whether the child was on solid foods at the time of stool collection, study treatment and maternal education, stratified by child race/ethnicity
| Races/ethnicities | Phylum | Genus (or lowest identified taxonomic level) | β-coefficient* | P value | FDR |
|---|---|---|---|---|---|
| African American | Firmicutes | Lactobacillus | 0.009681 | .001 | 0.03 |
| Firmicutes | Clostridiales | −0.04478 | .0005 | 0.02 | |
| Firmicutes | Erysipelotrichaceae | −0.08022 | .002 | 0.04 | |
| Firmicutes | Lachnospiraceae† | −0.10333 | .004 | 0.06 | |
| Firmicutes | Ruminococcaceat† | −0.09214 | .008 | 0.08 | |
| Hispanic | Firmicutes | Staphylococcus | 0.00771 | 1.46 × 10−05 | 0.002 |
| Firmicutes | Lachnospiraceae | −0.09245 | .0012 | 0.02 | |
| Firmicutes | Blautia | −0.12052 | 9.10 × 10−05 | 0.005 | |
| Firmicutes | Peptostreptococceceae | −0.02549 | .0002 | 0.008 | |
| Firmicutes | Ruminococcaceae | −0.04891 | .0009 | 0.02 | |
| Firmicutes | Lactobacillus† | 0.009499 | .01 | 0.15 | |
| White | Firmicutes | Eubacterium | −0.04525 | .0001 | 0.01 |
| Firmicutes | Clostridiales | −0.03196 | .001 | 0.05 |
Results shown for negative binomial regression analyses. β-coefficient is reflects the average difference in relative abundance between the breastfed and formula-fed groups after covariate adjustment.
Formula fed is reference group.
Taxa identified as significantly different in models without maternal education included as a covariate are displayed in Table III and included here for comparison.
Discussion
We conducted a large, prospective study to examine the detailed relationship between child diet in infancy, the maternal diet during pregnancy, and the early infant intestinal microbiome in a multiethnic population using untargeted sequencing techniques. The strongest associations we identified were between breastfeeding vs formula feeding and the child intestinal microbiome. Breastfed infants had higher counts of genera thought to be beneficial: Bifidobacterium, Lactobacillus, and Clostridia. In analyses stratified by race/ethnicity, we found positive associations between ingestion of breast milk (vs formula) and relative abundances of Lactobacillus spp in African American and Hispanic infants, and with Staphylococcus spp in Hispanic subjects. These associations are consistent with observations that both Lactobacillus and Staphylococcus spp are present in breast milk and grow in the presence of human milk oligosaccharides.27–29
Unexpectedly, given that breastfeeding is generally considered to be health-promoting and greater diversity is thought to be associated with a healthier microbiome, we found that breastfed infants had lower measures of intestinal microbial diversity compared with formula-fed infants. However, this was also observed in a smaller study of 9 infants10 and suggests that diversity may not necessarily relate to health in all clinical settings.
We did not identify a strong association between maternal diet during pregnancy and the child microbiome during infancy, suggesting that child’s diet is the more important determinant of the infant microbiome. Given that we used an abbreviated assessment tool for maternal diet and that our use of principal components only captured some of its variability, future work using a more detailed dietary assessment tool may better identify associations between the maternal diet during pregnancy and the child microbiome.
Comparison of our findings with those of other studies is not straightforward due to different ages studied, variable microbial profiling methods, and heterogenous analytic techniques. In an ethnically homogeneous population using targeted quantitative polymerase chain reaction on stool samples collected at age 1 month, Penders et al showed breastfed infants had less Clostridia difficile compared with formula-fed infants.7,30 This contrasts with our finding of a positive association between breastfeeding and overall Clostridia spp, though we expect that the influence of breastfeeding differs among individual species within this genus. Consistent with our results, breastfeeding is thought to increase Bifidobacterium spp. However, we did not observe the decrease in Bacteroides spp with breastfeeding that has been seen in other studies,7,8 possibly because of the relatively old age of our participants.
We found that racial/ethnic differences in the composition of the infant intestinal microbiome could be not be fully explained by differences in diet. Racial/ethnic differences could be explained by differences in maternal education; however, given the strong association between race/ethnicity and maternal education in our sample, this cannot be definitively concluded. Although our findings suggest that race/ethnicity modifies the relationship between diet and the microbiome, this observation needs to be replicated. If confirmed, this relationship may suggest early genetic influences or other unmeasured factors in the response of the microbiome to the diet in different ethnic groups.
Our study has limitations. Because infant diet was inferred from questionnaires administered after stool sample collection, misclassification of the exposure may have occurred; however, this would have introduced a null bias. Subjects who had taken antibiotics in the 7 days leading up to stool sample collection were not included in this analysis, though it is possible that exposure to antibiotics earlier in life or during pregnancy had effects on the microbiome that we were not able to account for. However, we do not anticipate a strong association between likelihood of receiving antibiotics and the dietary factors examined here, so any bias is anticipated to be random and not systematic. Our findings may also have limited generalizability: although the population studied is diverse, parents were selected with a personal history of allergy or asthma. It is unknown whether the microbiome of children with a family history of atopy may respond differently to diet than children without such a family history.
In summary, we found that both the maternal diet during pregnancy and the child diet during infancy are associated with the infant intestinal microbiome at age 3–6 months, with the strongest independent associations seen for breast milk vs formula feeding. Our results suggest that the association between infant diet and microbiome composition varies by race/ethnicity. As knowledge of microbiome-associated disease pathogenesis continues to accumulate, the association between diet and the child intestinal microbiome may have implications for disease modification through nutritional interventions.
Acknowledgments
Supported by National Institutes of Health grant numbers R01HL091528, R01HL108818, K23AI110522, and 5T32AI007306-30. The authors declare no conflicts of interest.
Glossary
- PC
Principal component
- PC 1
First PC
Appendix
Maternal Diet.
Women were asked how often they added salt to their food, and how often they ate the following foods or food groups:
Carrots
Margarine
Eggs
Low fat milk products
Whole milk food products
Deep fried foods
Processed meats
Beef, pork, or lamb
Dark green leafy vegetables
Baked products
Citrus fruits
Pasta, rice or noodles
Broccoli, cabbage, cauliflower, or brussel sprouts
Whole grain foods
Seafood
Other vegetables
Responses were provided on a five point scale ranging from less than once per week to twice or more per day. The average value for the two questionnaires was taken for further analysis. For cases in which information from one questionnaire was missing, only information from the other questionnaire was used.
Child Diet.
In our previous report of predictors of the infant intestinal microbiome11 we had defined breastfeeding as breastfeeding for at least 6 months. For this analysis focused primarily on the association of nutrition and the intestinal microbiome, we attempted to determine what diet the child was consuming at the time the stool was collected.
Breastfeeding.
We used questionnaire responses obtained at 6 months to determine whether a child was ingesting breast milk at the time of stool collection, accounting for the timing of stool collection in relation to the questionnaire responses. At the 6 month visit, providers were asked “Since we last spoke with you, has your baby been breastfed?” If the answer was yes, they were asked if the baby was still being breastfed. If the answer was no, they were asked “How old was your baby when you stopped breastfeeding.” In 21 cases, an age at cessation of breastfeeding was not available. In these cases, if the stool sample was collected within 30 days of completing the questionnaire, we assumed the child was on the same diet at the stool collection as at questionnaire completion. In 3 cases where the 6 month information was missing, we were able to determine whether a child was on breast milk at the time of the stool collection from data obtained at later visits (eg, the child was still breastfeeding at age 12 months). In 4 cases, it was not possible to determine whether the child was on breast milk at the time of the stool collection.
Formula Feeding.
Similar to the above, we used questionnaire responses obtained at 6 months to determine whether a child was ingesting formula at the time of stool collection. At the 6 month visit, providers were asked, since we last spoke with you, have you fed your baby any infant formula. If the caretaker answered yes, they were asked “How old was your baby when you started infant formula (in months),” and “How many days per week in the past month have you fed your baby infant formula?” If the child was fed formula 4 or greater days per week on average, they were considered to have formula in their diet. In 4 cases where 6-month data was missing, we were able to determine whether a child was on formula at the time of the stool collection from data obtained at later visits.
Solid Food.
We used the 6-month and 18-month questionnaire data to determine if a child was on solid food at the time of stool collection. At the 6-month visit, care providers were asked “Since we last spoke, have you fed your baby any food other than breast milk or formula?” In those cases where the stool sample was collected before the questionnaire and the child was not reported to have introduced solid foods (n = 39) or the stool sample was collected after the questionnaire and the child was reported to have introduced solids (n = 77), the 6-month questionnaire responses were used to determine child diet. At the 18-month visit, the care provider was asked when solids were introduced and possible answers included “less than 4 months,” “4 months,” “5 months,” “6 months,” and “more than 6 months.” In 3 cases where the 18-month data was missing, the 6-month responses were used if stool collection occurred within 30 days of the questionnaire. In 7 cases we were unable to determine if the child was on solids at the time of the stool collection using the available data.
References
- 1.De Silva D, Geromi M, Halken S, Host A, Panesar SS, Muraro A, et al. Primary prevention of food allergy in children and adults: systematic review. Allergy 2014;69:581–9. [DOI] [PubMed] [Google Scholar]
- 2.Bunyavanich S, Rifas-Shiman SL, Platts-Mills T, Workman L, Sordillo J, Gillman M, et al. Peanut allergy prevalence among school-age children in a US cohort not selected for any disease. J Allergy Clin Immunol 2014;134:735–55. [DOI] [PMC free article] [PubMed] [Google Scholar]
- 3.Guarner F, Malagelada JR. Gut flora in health and disease. Lancet 2003;361:512–9. [DOI] [PubMed] [Google Scholar]
- 4.Arrieta M-C, Stiemsma LT, Dimitriu PA, Thorson L, Russell S, Yurist-Doutsch S, et al. Early infancy microbial and metabolic alterations affect risk of childhood asthma. Sci Transl Med 2015;7:307ra152. [DOI] [PubMed] [Google Scholar]
- 5.Albenberg LG, Wu GD. Diet and the intestinal microbiome: associations, functions, and implications for health and disease. Gastroenterology 2014;146:1564–72. [DOI] [PMC free article] [PubMed] [Google Scholar]
- 6.Ly NP, Litonjua AA, Gold DR, Celedón JC. Gut microbiota, probiotics, and vitamin D: interrelated exposures influencing allergy, asthma, and obesity? J Allergy Clin Immunol 2011;127:1087–94. [DOI] [PMC free article] [PubMed] [Google Scholar]
- 7.Penders J, Thijs C, Vink C, Stelma FF, Snijders B, Kummeling I, et al. Factors influencing the composition of the intestinal microbiota in early infancy. Pediatrics 2006;118:511–21. [DOI] [PubMed] [Google Scholar]
- 8.Stark PL, Lee A. The microbial ecology of the large bowel of breast-fed and formula-fed infants during the first year of life. J Med Microbiol 1982;15:189–203. [DOI] [PubMed] [Google Scholar]
- 9.Yoshioka H, Iseki K, Fujita K. Development and differences of intestinal flora in the neonatal period in breast-fed and bottle-fed infants. Pediatrics 1983;72:317–21. [PubMed] [Google Scholar]
- 10.Thompson AL, Monteagudo-Mera A, Cadenas MB, Lampl ML, Azcarate-Peril MA. Milk- and solid-feeding practices and daycare attendance are associated with differences in bacterial diversity, predominant communities, and metabolic and immune function of the infant gut microbiome. Front Cell Infect Microbiol 2015;5:3. [DOI] [PMC free article] [PubMed] [Google Scholar]
- 11.Sordillo JE, Zhou Y, McGeachie MJ, Ziniti J, Lange N, Laranjo N, et al. Factors influencing the infant gut microbiome at age 3–6 months: findings from the ethnically diverse Vitamin D Antenatal Asthma Reduction Trial (VDAART). J Allergy Clin Immunol 2017;139:482–491.e14. [DOI] [PMC free article] [PubMed] [Google Scholar]
- 12.Stearns JC, Zulyniak MA, de Souza RJ, Campbell NC, Fontes M, Shaikh M, et al. Ethnic and diet-related differences in the healthy infant microbiome. Genome Med 2017;9:32. [DOI] [PMC free article] [PubMed] [Google Scholar]
- 13.Keet CA, Savage JH, Seopaul S, Peng RD, Wood RA, Matsui EC. Temporal trends and racial/ethnic disparity in self-reported pediatric food allergy in the United States. Ann Allergy Asthma Immunol 2014;112:222–9. [DOI] [PMC free article] [PubMed] [Google Scholar]
- 14.Litonjua AA, Lange NE, Carey VJ, Brown S, Laranjo N, Harshfield BJ, et al. The Vitamin D Antenatal Asthma Reduction Trial (VDAART): rationale, design, and methods of a randomized, controlled trial of vitamin D supplementation in pregnancy for the primary prevention of asthma and allergies in children. Contemp Clin Trials 2014;38:37–50. [DOI] [PMC free article] [PubMed] [Google Scholar]
- 15.Litonjua AA, Carey VJ, Laranjo N, Harshfield BJ, McElrath TF, O’Connor GT, et al. Effect of prenatal supplementation with vitamin D on asthma or recurrent wheezing in offspring by age 3 years: the VDAART Randomized Clinical Trial. JAMA 2016;315:362–70. [DOI] [PMC free article] [PubMed] [Google Scholar]
- 16.Rifas-Shiman SL, Willett WC, Lobb R, Kotch J, Dart C, Gillman MW. PrimeScreen, a brief dietary screening tool: reproducibility and comparability with both a longer food frequency questionnaire and biomarkers. Public Health Nutr 2001;4:249–54. [DOI] [PubMed] [Google Scholar]
- 17.Consortium HMP. A framework for human microbiome research. Nature 2012;486:215–21. [DOI] [PMC free article] [PubMed] [Google Scholar]
- 18.Haas BJ, Gevers D, Earl AM, Feldgarden M, Ward DV, Giannoukos G, et al. Chimeric 16S rRNA sequence formation and detection in Sanger and 454-pyrosequenced PCR amplicons. Genome Res 2011;21:494–504. [DOI] [PMC free article] [PubMed] [Google Scholar]
- 19.Caporaso JG, Kuczynski J, Stombaugh J, Bittinger K, Bushman FD, Costello EK, et al. QIIME allows analysis of high-throughput community sequencing data. Nat Methods 2010;7:335–6. [DOI] [PMC free article] [PubMed] [Google Scholar]
- 20.Cole JR, Wang Q, Cardenas E, Fish J, Chai B, Farris RJ, et al. The Ribosomal Database Project: improved alignments and new tools for rRNA analysis. Nucleic Acids Res 2009;37:D141–5. [DOI] [PMC free article] [PubMed] [Google Scholar]
- 21.Claesson MJ, O’Sullivan O, Wang Q, Nikkilä J, Marchesi JR, Smidt H, et al. Comparative analysis of pyrosequencing and a phylogenetic microarray for exploring microbial community structures in the human distal intestine. PLoS ONE 2009;4:e6669. [DOI] [PMC free article] [PubMed] [Google Scholar]
- 22.Mazmanian SK, Round JL, Kasper DL. A microbial symbiosis factor prevents intestinal inflammatory disease. Nature 2008;453:620–5. [DOI] [PubMed] [Google Scholar]
- 23.Kalliomäki M, Kirjavainen P, Eerola E, Kero P, Salminen S, Isolauri E. Distinct patterns of neonatal gut microflora in infants in whom atopy was and was not developing. J Allergy Clin Immunol 2001;107:129–34. [DOI] [PubMed] [Google Scholar]
- 24.Shida K, Takahashi R, Iwadate E, Takamizawa K, Yasui H, Sato T, et al. Lactobacillus casei strain Shirota suppresses serum immunoglobulin E and immunoglobulin G1 responses and systemic anaphylaxis in a food allergy model. Clin Exp Allergy 2002;32:563–70. [DOI] [PubMed] [Google Scholar]
- 25.Ling Z, Li Z, Liu X, Cheng Y, Luo Y, Tong X, et al. Altered fecal microbiota composition associated with food allergy in infants. Appl Environ Microbiol 2014;80:2546–54. [DOI] [PMC free article] [PubMed] [Google Scholar]
- 26.Morgan XC, Tickle TL, Sokol H, Gevers D, Devaney KL, Ward DV, et al. Dysfunction of the intestinal microbiome in inflammatory bowel disease and treatment. Genome Biol 2012;13:R79. [DOI] [PMC free article] [PubMed] [Google Scholar]
- 27.Marcobal A, Barboza M, Froehlich JW, Block DE, German JB, Lebrilla CB, et al. Consumption of human milk oligosaccharides by gut-related microbes. J Agric Food Chem 2010;58:5334–40. [DOI] [PMC free article] [PubMed] [Google Scholar]
- 28.Hunt KM, Preuss J, Nissan C, Davlin CA, Williams JE, Shafii B, et al. Human milk oligosaccharides promote the growth of staphylococci. Appl Environ Microbiol 2012;78:4763–70. [DOI] [PMC free article] [PubMed] [Google Scholar]
- 29.Soto A, Martín V, Jiménez E, Mader I, Rodríguez JM, Fernández L. Lactobacilli and bifidobacteria in human breast milk: influence of antibiotherapy and other host and clinical factors. J Pediatr Gastroenterol Nutr 2014;59:78–88. [DOI] [PMC free article] [PubMed] [Google Scholar]
- 30.Penders J, Vink C, Driessen C, London N, Thijs C, Stobberingh EE. Quantification of Bifidobacterium spp, Escherichia coli and Clostridium difficile in faecal samples of breast-fed and formula-fed infants by real-time PCR. FEMS Microbiol Lett 2005;243:141–7. [DOI] [PubMed] [Google Scholar]