

Abstract
In many social mammals, social adversity predicts compromised health and reduced fitness. These effects are thought to be driven in part by chronic social stress, but their molecular underpinnings are not well understood. Recent work suggests that chronic stress can affect mitochondrial copy number, heteroplasmy rates and function. Here, we tested the first two possibilities for the first time in non-human primates. We manipulated dominance rank in captive female rhesus macaques (n = 45), where low rank induces chronic social stress, and measured mitochondrial DNA (mtDNA) copy number and heteroplasmy in five peripheral blood mononuclear cell types from each study subject. We found no effect of dominance rank on either mtDNA copy number or heteroplasmy rates. However, grooming rate, a measure of affiliative social behaviour predicted by high social status, was positively associated with mtDNA copy number in B cells, cytotoxic T cells and monocytes. Our results suggest that social interactions can influence mtDNA regulation in immune cells. Further, they indicate the importance of considering both affiliative and competitive interactions in investigating this relationship.
Keywords: social status, social integration, primates, mitochondrial DNA, peripheral blood mononuclear cells, social stress
1. Introduction
In social mammals, the rate and outcome of competitive and affiliative interactions often covary with fitness-related traits. Thus, variation in both social status (i.e. dominance rank) and levels of social integration/isolation influences aspects of fertility and/or survival [1,2]. These relationships arise in part because social interactions influence access to other fitness-determining factors, such as food or mates, and in part because individual condition can shape social interactions. Recent evidence also points to a third explanation: direct effects of social interactions on animal physiology, often in connection to socially induced stress [3]. Socially subordinate or isolated individuals exhibit elevated glucocorticoid levels [4] and altered gene regulation [5], which in turn may contribute to social gradients in health [6,7].
Recent work indicates that social adversity may also impact mitochondrial DNA (mtDNA) content, function and regulation. Experimental studies in rodents indicate that chronic social stress reduces mitochondrial energetic capacity, alters mtDNA gene expression, and changes the complement of mitochondria-associated proteins and metabolites [8]. Further, cortisol treatment induces glucocorticoid receptor binding to mtDNA [9], suggesting a link between stress regulation and mitochondrial activity. Depression in women and physical stressors in mice also predict higher mtDNA copy number and heteroplasmy (mtDNA genetic variation within an individual) [10,11]. Together, these findings suggest that mtDNA biology is sensitive to chronic stress. Given known associations between mtDNA copy number, cellular metabolism (especially oxidative phosphorylation) [12] and several common health conditions [13], social stress-induced effects on mtDNA regulation may therefore represent an unexplored link between social interactions and fitness. However, the relationship between social interactions and mtDNA biology has not been tested in non-human primates.
Here, we address this gap by experimentally manipulating social dominance rank in captive female rhesus macaques (Macaca mulatta) via the controlled introduction of females into new social groups [14]. Female rhesus macaques form stable, linear dominance hierarchies that affect resource access and psychosocial stress [15]. In our experimental population, later introduction predicted lower rank, which in turn predicted higher rates of received harassment and lower rates of affiliative grooming [14]. Based on reports that childhood adversity and depression influence mtDNA regulation in human blood [10,16], and that social stress affects gene regulation in rhesus macaque peripheral blood mononuclear cells (PBMCs) [14,17], we measured mtDNA copy number and heteroplasmy in five PBMC subtypes. Motivated by observations in humans and mice [10,11], we predicted that social subordination and relative social isolation—that is, increased exposure to social stressors—would lead to higher mtDNA copy number and heteroplasmy rates.
2. Material and methods
(a). Behavioural data collection
We studied nine social groups, each composed of five unrelated adult female rhesus macaques [14] (electronic supplementary material, table S1). Females were sequentially introduced such that later introduction predicted lower dominance rank. Rank was quantified using Elo ratings based on agonistic behavioural interactions obtained during focal sampling [18], a continuous measure of rank in which each group member was assigned a distinct value [19] (median hours of observation per animal: 14.5 ± 1.7 s.d.). To measure affiliative behaviour, we calculated the overall proportion of focal observation time that a female spent either grooming or being groomed (following recent studies of social affiliation and lifespan in non-human primates [2,6,20], which treat grooming as the primary measure of social affiliation). Rank was measured at the time of blood sampling; grooming data were collated from the time of group formation (February–June 2014) until shortly after blood sampling was complete (December 2014).
(b). mtDNA copy number quantification
DNA used in this study was obtained from previous work [14]. Ten to sixteen weeks after group formation, we purified PBMCs from 12 to 20 ml of blood from each female, sorted PBMCs into B cell, cytotoxic T cell, helper T cell, monocyte and natural killer cell populations, and extracted RNA and DNA.
We measured mtDNA copy number in duplicate using quantitative PCR (qPCR), targeting a region of the mitochondrial genome and a single-copy region of the nuclear genome (n = 213 samples with sufficient DNA: electronic supplementary material, text S1). Using the cycle threshold (Ct) values of the qPCR runs, we calculated mtDNA copy number as 2(mean Ct of nuclear DNA replicates – mean Ct of mtDNA replicates). Our mtDNA copy number estimates were robust to use of alternative nuclear and mtDNA loci (electronic supplementary material, figure S1).
We modelled natural-log-transformed mtDNA copy number as a function of social interactions (dominance rank or grooming behaviour), controlling for age, cell type and qPCR plate/batch (electronic supplementary material, text S2), using linear mixed effects models. We first investigated social effects on mtDNA copy number across all cell types. Next, to test for heterogeneity across cell types, we modelled each cell type separately and used a Bayesian meta-analytic approach to investigate shared effects across cell types [21].
(c). Heteroplasmic variants in mtDNA
We quantified mitochondrial heteroplasmy using mtDNA-mapped reads from previously generated, cell type-specific RNA-seq data for each study subject [14] (accession number GSE83307; electronic supplementary material, text S3 and table S2) and the program mitoCaller [22]. To account for sequencing coverage, we removed mtDNA positions with ≤200 reads and randomly subsampled sites with >200 reads down to exactly 200 reads. Following [11], we classified a site as heteroplasmic if the minor allele frequency was at least 4% within a sample.
We modelled heteroplasmy using a binomial mixed model [23], controlling for age and cell type. Our response variable was the number of heteroplasmic sites in the mtDNA genome relative to the number of analysable sites for each sample.
3. Results
(a). Grooming behaviour, but not dominance rank, predicts mtDNA copy number
Dominance rank did not predict mtDNA copy number across all cell types together (β = −0.033, p = 0.931; table 1) or in any individual cell type (all p > 0.1; table 1). These results were unchanged if we investigated only aggressive or submissive behaviours independently (electronic supplementary material, table S3). However, mtDNA copy number was positively associated with the amount of time females spent grooming (β = 0.019, p = 0.025; table 2). This association varied across cell types, with the strongest effect in B cells and a non-significant trend in monocytes and cytotoxic T cells (figure 1).
Table 1.
Effects of dominance rank and age on mtDNA copy number. Bold text indicates significance at p < 0.05.
| coefficient (β) | standard error | test statistic | p-value | |
|---|---|---|---|---|
| all cell types | ||||
| dominance rank | −0.033 | 0.038 | −0.087 | 0.931 |
| age | −0.017 | 0.011 | −1.660 | 0.099 |
| monocytes | ||||
| dominance rank | −0.010 | 0.073 | −0.138 | 0.891 |
| age | 0.016 | 0.019 | 0.822 | 0.420 |
| natural killer cells | ||||
| dominance rank | −0.048 | 0.098 | −0.491 | 0.626 |
| age | 0.014 | 0.027 | 0.512 | 0.611 |
| B cells | ||||
| dominance rank | 0.036 | 0.074 | 0.486 | 0.630 |
| age | −0.032 | 0.020 | −1.633 | 0.110 |
| helper T cells | ||||
| dominance rank | −0.064 | 0.095 | −0.687 | 0.496 |
| age | −0.056 | 0.026 | −2.110 | 0.041 |
| cytotoxic T cells | ||||
| dominance rank | 0.059 | 0.078 | 0.768 | 0.447 |
| age | −0.052 | 0.024 | −2.158 | 0.037 |
Table 2.
Effects of grooming and age on mtDNA copy number. Bold text indicates significance at p < 0.05.
| coefficient (β) | standard error | test statistic | p-value | |
|---|---|---|---|---|
| all cell types | ||||
| grooming | 0.019 | 0.008 | 2.26 | 0.025 |
| age | −0.018 | 0.010 | −1.812 | 0.071 |
| monocytes | ||||
| grooming | 0.030 | 0.016 | 1.853 | 0.073 |
| age | 0.012 | 0.018 | 0.668 | 0.510 |
| natural killer cells | ||||
| grooming | 0.013 | 0.021 | 0.627 | 0.534 |
| age | 0.008 | 0.026 | 0.303 | 0.763 |
| B cells | ||||
| grooming | 0.037 | 0.016 | 2.330 | 0.025 |
| age | −0.033 | 0.018 | −1.853 | 0.071 |
| helper T cells | ||||
| grooming | −0.007 | 0.020 | −0.329 | 0.744 |
| age | −0.059 | 0.026 | −2.302 | 0.027 |
| cytotoxic T cells | ||||
| grooming | 0.029 | 0.016 | 1.801 | 0.079 |
| age | −0.053 | 0.022 | −2.378 | 0.022 |
Figure 1.
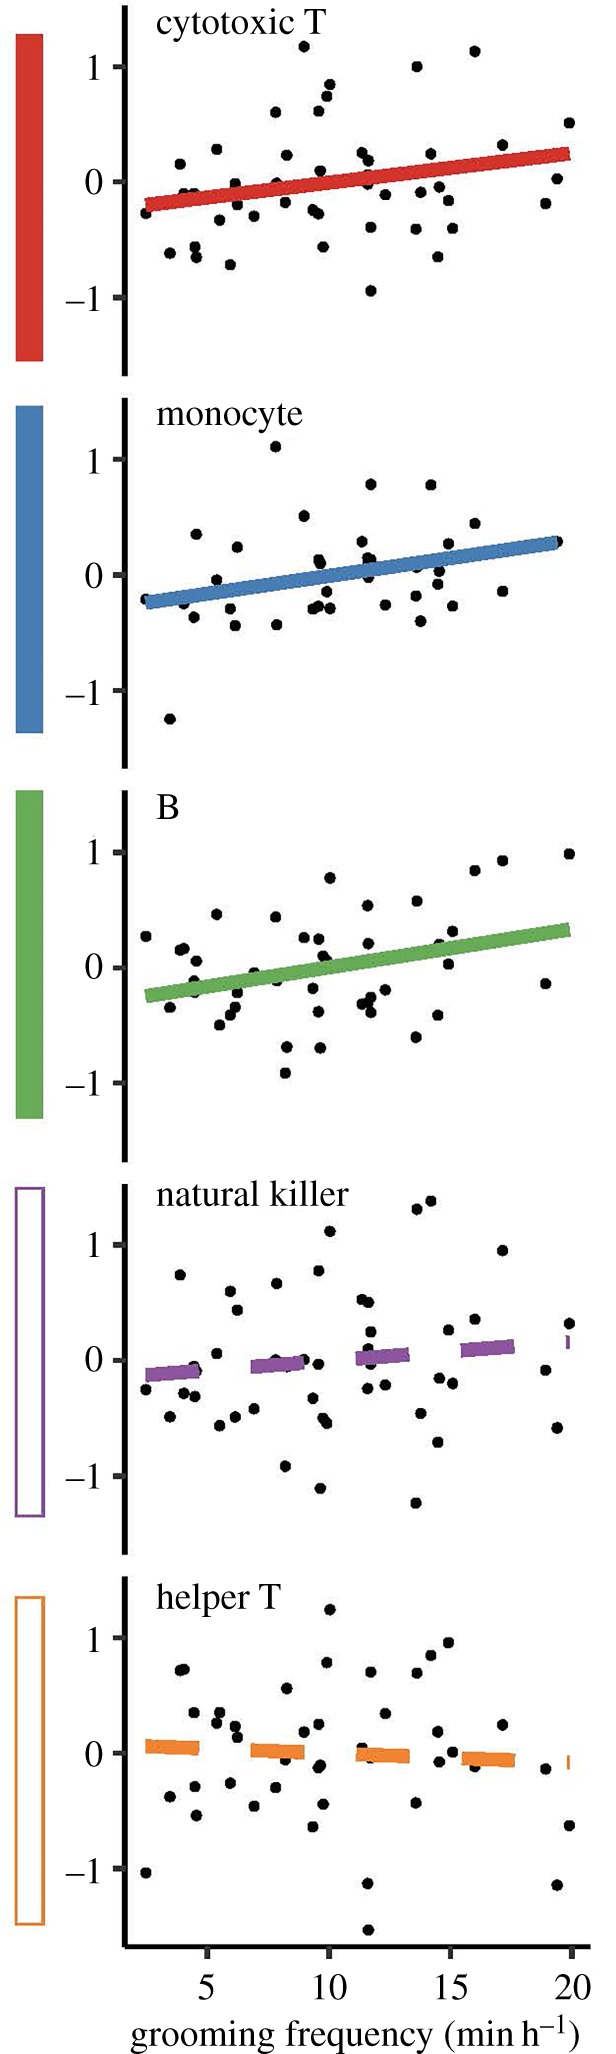
Cell type-specific effects of grooming on mtDNA copy number. Shaded boxes (left) show shared positive effects of grooming on mtDNA copy number based on meta-analysis (empty boxes = no effect). For visualization purposes, the y-axis shows the residuals of a model controlling for age and qPCR batch. (Online version in colour.)
Consistent with these observations, formal meta-analysis strongly supported a shared positive effect of grooming on mtDNA copy number in B cells, monocytes and cytotoxic T cells (Bayes factor = 56.62). Support for an effect of either giving grooming only or receiving grooming only was substantially weaker (BF = 8.22 and 5.05, respectively), suggesting that our results arise from engagement in any grooming (regardless of direction). As expected from previous work [24], older individuals tended to have lower copy number (electronic supplementary material, figure S2).
(b). Social interactions do not predict heteroplasmy
Consistent with previous findings in humans [22], heteroplasmic sites occurred at low levels in each sample (mean number of heteroplasmic sites = 5.93 ± 4.10 s.d.). Most heteroplasmic mutations were private within samples, though samples from the same individual tended to share heteroplasmic sites (electronic supplementary material, figure S3). Neither dominance rank nor grooming rates were significant predictors of overall heteroplasmy rates (all p > 0.1; electronic supplementary material, tables S4 and S5; figure 2). These results were unchanged under an alternative pipeline that stringently filters for possible PCR duplicates (electronic supplementary material, text S4, table S6).
Figure 2.

No effect of dominance rank or grooming on mtDNA heteroplasmy. (a) Locations and frequencies of heteroplasmic sites. The θ-axis shows mtDNA coordinates based on [25]. The y-axis shows the percentage of individuals (out of 45) that carried a heteroplasmy in at least one cell type. Thick, navy bars represent mitochondrial genes. (b,c) Neither dominance rank (b) nor grooming behaviour (c) predicts heteroplasmy rates, controlling for age and cell type. (Online version in colour.)
4. Discussion
In contrast to our predictions, we found no effect of social status on mtDNA copy number. Further, high social affiliation was positively, not negatively, predictive of mtDNA copy number. Thus, our results support the idea that social interactions can influence mitochondrial biology, but in a surprising direction. One potential explanation is that previous studies focused on heterogeneous cell populations [10,11], whereas we analysed purified populations. Because mtDNA copy number varies among cell types [26] (electronic supplementary material, figure S4), social factors that influence cellular composition could also affect apparent differences in copy number. Indeed, PBMC types are known to be differentially sensitive to social adversity when measuring gene expression outcomes [14].
Alternatively, low social status may affect mitochondrial biology differently than previously studied predictors [10,11]. We note, however, that our results are broadly consistent with findings that corticosterone exposure and physical stressors reduce mtDNA copy number in the rat hippocampus and striatum [27]. Additionally, although we did not observe an effect of social status on mtDNA copy number, because high rank predicts higher grooming rates (r = 0.70, p = 7.52 × 10⁻⁸), social status may indirectly influence mtDNA copy number via its effects on grooming. Such an indirect relationship has been observed in wild female baboons, where rank does not directly predict lifespan, but does predict grooming-based measures of social integration, which in turn explain variation in lifespan [20].
Together, our findings extend experimental studies on the influence of social factors on mitochondrial biology to primates, and add important data on females [8]. They also support the increasing body of work linking affiliative social interactions to health and fitness in non-human primates [2,6,20]. We do not yet understand the importance of grooming effects on mtDNA copy number for cellular and organismal function. Increases in copy number may signify increase energetic potential or compensate for loss of mitochondrial function when some mtDNA copies are mutated. Additionally, while mtDNA copy number has been linked to many disorders, the directionality of this relationship varies. For example, mtDNA copy number in blood is positively associated with rates of mitochondrial encephalomyopathies [28] but negatively associated with rates of metabolic syndrome [29].
Because this study used previously extracted DNA samples, we were not able to measure direct indicators of mitochondrial function. Future studies that measure both mtDNA copy number and mitochondrial metabolism will clarify how mitochondrial quantity and quality combine to respond to social environmental cues. Such studies have the potential to shed new light on the relationship between mtDNA biology, human health and its importance for Darwinian fitness in social mammals more broadly.
Supplementary Material
Supplementary Material
Acknowledgements
We thank J. Whitley, A. Tripp, N. Brutto and J. Johnson for collecting behavioural data, N. Cai for advice on quantifying mtDNA copy number, T. Reddy for access to the qPCR thermocycler, and two anonymous reviewers for comments on the manuscript.
Ethics
The Yerkes National Primate Research Center is fully accredited by AAALAC International. Data were obtained in accordance with Institutional Animal Care and Use Committee protocols approved by Emory University (IACUC YER-2001677-040715GA) and Duke University (IACUC A079-12-03).
Data accessibility
Data are included as supplementary material, in the Short Read Archive (SRA; accession number GSE83307; https://www.ncbi.nlm.nih.gov/geo/query/acc.cgi?acc=GSE83307), and at https://github.com/reenadebray/mtDNA_copy_number.
Authors' contributions
J.T., L.B.B., M.E.W., N.S.-M. and R.R.D. designed the study. R.R.D., N.S.M. and J.N.K. collected the data. R.R.D., N.S.M. and J.T. analysed the data and wrote the paper, with input on the initial draft and revisions from all authors. All authors approved the manuscript and agree to be accountable for its content.
Competing interests
We declare no competing interests.
Funding
This work was funded by NIH grants 1R01-GM102562, 9R01-AG057235, P51-OD011132, K99-AG051764; North Carolina Biotechnology Center grant 2016-IDG-1013; and the Duke University Howard Hughes Research Fellowship.
References
- 1.Sapolsky RM. 2004. Social status and health in humans and other animals. Annu. Rev. Anthr. 33, 393–418. ( 10.1146/annurev.anthro.33.070203.144000) [DOI] [Google Scholar]
- 2.Silk JB. 2007. Social components of fitness in primate groups. Science 317, 1347–1351. ( 10.1126/science.1140734) [DOI] [PubMed] [Google Scholar]
- 3.Creel S, Dantzer B, Goymann W, Rubenstein DR. 2013. The ecology of stress: effects of the social environment. Funct. Ecol. 27, 66–80. ( 10.1111/j.1365-2435.2012.02029.x) [DOI] [Google Scholar]
- 4.Creel S. 2001. Social dominance and stress hormones. Trends Ecol. Evol. 16, 491–497. ( 10.1016/S0169-5347(01)02227-3) [DOI] [Google Scholar]
- 5.Tung J, Gilad Y. 2013. Social environmental effects on gene regulation. Cell. Mol. Life Sci. 70, 4323–4339. ( 10.1007/s00018-013-1357-6) [DOI] [PMC free article] [PubMed] [Google Scholar]
- 6.Silk JB, Beehner JC, Bergman TJ, Crockford C, Engh AL, Moscovice LR, Wittig RM, Seyfarth RM, Cheney DL. 2010. Strong and consistent social bonds enhance the longevity of female baboons. Curr. Biol. 20, 1359–1361. ( 10.1016/j.cub.2010.05.067) [DOI] [PubMed] [Google Scholar]
- 7.Shively CA, Register TC, Clarkson TB. 2009. Social stress, visceral obesity, and coronary artery atherosclerosis in female primates. Obesity 17, 1513–1520. ( 10.1038/oby.2009.74) [DOI] [PubMed] [Google Scholar]
- 8.Picard M, McEwen BS. 2018. Psychological stress and mitochondria: a systematic review. Psychosom. Med. 80, 141–153. ( 10.1097/PSY.0000000000000545) [DOI] [PMC free article] [PubMed] [Google Scholar]
- 9.Hunter RG, Seligsohn M, Rubin TG, Griffiths BB, Ozdemir Y, Pfaff DW, Datson NA, McEwen BS. 2016. Stress and corticosteroids regulate rat hippocampal mitochondrial DNA gene expression via the glucocorticoid receptor. Proc. Natl Acad. Sci. USA 113, 9099–9104. ( 10.1073/pnas.1602185113) [DOI] [PMC free article] [PubMed] [Google Scholar]
- 10.Cai N, et al. 2015. Molecular signatures of major depression. Curr. Biol. 25, 1146–1156. ( 10.1016/j.cub.2015.03.008) [DOI] [PMC free article] [PubMed] [Google Scholar]
- 11.Cai N, et al. 2015. Genetic control over mtDNA and its relationship to major depressive disorder. Curr. Biol. 25, 3170–3177. ( 10.1016/j.cub.2015.10.065) [DOI] [PMC free article] [PubMed] [Google Scholar]
- 12.Qian W, Van Houten B. 2010. Alterations in bioenergetics due to changes in mitochondrial DNA copy number. Methods 51, 452–457. ( 10.1016/j.ymeth.2010.03.006) [DOI] [PubMed] [Google Scholar]
- 13.Reznik E, et al. 2016. Mitochondrial DNA copy number variation across human cancers. eLife 5, e10769 ( 10.7554/eLife.10769) [DOI] [PMC free article] [PubMed] [Google Scholar]
- 14.Snyder-Mackler N, et al. 2016. Social status alters immune regulation and response to infection in macaques. Science 354, 1041–1045. ( 10.1126/science.aah3580) [DOI] [PMC free article] [PubMed] [Google Scholar]
- 15.Michopoulos V, Reding KM, Wilson ME, Toufexis D. 2012. Social subordination impairs hypothalamic–pituitary–adrenal function in female rhesus monkeys. Horm. Behav. 62, 389–399. ( 10.1016/j.yhbeh.2012.07.014) [DOI] [PMC free article] [PubMed] [Google Scholar]
- 16.Tyrka AR, Parade SH, Price LH, Kao H-T, Porton B, Philip NS, Welch ES, Carpenter LL. 2016. Alterations of mitochondrial DNA copy number and telomere length with early adversity and psychopathology. Biol. Psychiatry 79, 78–86. ( 10.1016/j.biopsych.2014.12.025) [DOI] [PMC free article] [PubMed] [Google Scholar]
- 17.Tung J, Barreiro LB, Johnson ZP, Hansen KD, Michopoulos V, Toufexis D, Michelini K, Wilson ME, Gilad Y. 2012. Social environment is associated with gene regulatory variation in the rhesus macaque immune system. Proc. Natl Acad. Sci. USA 109, 6490–6495. ( 10.1073/pnas.1202734109) [DOI] [PMC free article] [PubMed] [Google Scholar]
- 18.Altmann J. 1974. Observational study of behavior: sampling methods. Behaviour 49, 227–266. ( 10.1163/156853974X00534) [DOI] [PubMed] [Google Scholar]
- 19.Albers PC, de Vries H. 2001. Elo-rating as a tool in the sequential estimation of dominance strengths. New York, NY: Academic Press. [Google Scholar]
- 20.Archie EA, Tung J, Clark M, Altmann J, Alberts SC. 2014. Social affiliation matters: both same-sex and opposite-sex relationships predict survival in wild female baboons. Proc. R. Soc. B 281, 20141261 ( 10.1098/rspb.2014.1261) [DOI] [PMC free article] [PubMed] [Google Scholar]
- 21.Wen X, Stephens M. 2014. Bayesian methods for genetic association analysis with heterogeneous subgroups: from meta-analyses to gene–environment interactions. Ann. Appl. Stat. 8, 176 ( 10.1214/13-AOAS695) [DOI] [PMC free article] [PubMed] [Google Scholar]
- 22.Ding J, et al. 2015. Assessing mitochondrial DNA variation and copy number in lymphocytes of ∼ 2,000 Sardinians using tailored sequencing analysis tools. PLoS Genet. 11, e1005306 ( 10.1371/journal.pgen.1005306) [DOI] [PMC free article] [PubMed] [Google Scholar]
- 23.Lea AJ, Tung J, Zhou X. 2015. A flexible, efficient binomial mixed model for identifying differential DNA methylation in bisulfite sequencing data. PLoS Genet. 11, e1005650 ( 10.1371/journal.pgen.1005650) [DOI] [PMC free article] [PubMed] [Google Scholar]
- 24.Mengel-From J, Thinggaard M, Dalgård C, Kyvik KO, Christensen K, Christiansen L. 2014. Mitochondrial DNA copy number in peripheral blood cells declines with age and is associated with general health among elderly. Hum. Genet. 133, 1149–1159. ( 10.1007/s00439-014-1458-9) [DOI] [PMC free article] [PubMed] [Google Scholar]
- 25.Zimin AV, et al. 2014. A new rhesus macaque assembly and annotation for next-generation sequencing analyses. Biol. Direct. 9, 20 ( 10.1186/1745-6150-9-20) [DOI] [PMC free article] [PubMed] [Google Scholar]
- 26.Veltri KL, Espiritu M, Singh G. 1990. Distinct genomic copy number in mitochondria of different mammalian organs. J. Cell. Physiol. 143, 160–164. ( 10.1002/jcp.1041430122) [DOI] [PubMed] [Google Scholar]
- 27.Liu W, Zhou C. 2012. Corticosterone reduces brain mitochondrial function and expression of mitofusin, BDNF in depression-like rodents regardless of exercise preconditioning. Psychoneuroendocrinology 37, 1057–1070. ( 10.1016/j.psyneuen.2011.12.003) [DOI] [PubMed] [Google Scholar]
- 28.Liu C-S, Cheng W-L, Lee C-F, Ma Y-S, Lin C-Y, Huang C-C, Wei YH. 2006. Alteration in the copy number of mitochondrial DNA in leukocytes of patients with mitochondrial encephalomyopathies. Acta Neurol. Scand. 113, 334–341. ( 10.1111/j.1600-0404.2006.00586.x) [DOI] [PubMed] [Google Scholar]
- 29.Huang C-H, Su S-L, Hsieh M-C, Cheng W-L, Chang C-C, Wu H-L, Kuo CL, Lin TT, Liu CS. 2011. Depleted leukocyte mitochondrial DNA copy number in metabolic syndrome. J. Atheroscler. Thromb. 18, 867–873. ( 10.5551/jat.8698) [DOI] [PubMed] [Google Scholar]
Associated Data
This section collects any data citations, data availability statements, or supplementary materials included in this article.
Supplementary Materials
Data Availability Statement
Data are included as supplementary material, in the Short Read Archive (SRA; accession number GSE83307; https://www.ncbi.nlm.nih.gov/geo/query/acc.cgi?acc=GSE83307), and at https://github.com/reenadebray/mtDNA_copy_number.