Abstract
Purpose
To assess precision and accuracy of a new objective algorithm using binarization in a software for identifying the hyperautofluorescent ring (AF ring) in retinitis pigmentosa (RP) compared with subjective visual inspection.
Methods
Ultra-widefield AF images were obtained from 23 eyes of 13 patients with retinitis pigmentosa (RP). We defined the borders of the AF rings using semiautomatic binarization algorithm in Fiji software. We compared the degree of precision (intra- and interrater agreements) of this algorithm and that of subjective visual inspection (freehand method) using Jaccard indices (JIs). To compare the classification performance (whether 68 points of Humphrey Field Analyzer is classified as inside, on, or outside AF rings), we calculated percent agreement and weighted kappa statistic between the two methods. The relationship between the distance from the AF ring and retinal sensitivities was also investigated.
Results
The binarization method showed significantly higher JIs than the freehand method (for interrater: 0.94–0.95 vs. 0.73–0.78, respectively, P = 0.002; for intrarater: 0.95 vs. 0.68–0.71, respectively, P = 0.005). Percent agreement for classification between the two methods were 0.94 and weighted kappa statistic was 0.94 (P < 0.001). The retinal sensitivities decreased significantly and eccentrically from 2° inside to 3° outside the AF ring.
Conclusions
Defining the AF ring in RP using the binarization algorithm showed significantly higher precision and the same degree of accuracy compared with visual inspection.
Translation Relevance
This novel method may enable quantitative analysis of the AF ring, an indicator of retinal function in RP.
Keywords: retinitis pigmentosa, hyperautofluorescent ring (AF ring), binarization, Humphrey Field Analyzer (HFA), visual field
Introduction
Retinitis pigmentosa (RP) is a slow, progressive, hereditary retinal disease caused mainly by the loss of photoreceptors and is characterized by nyctalopia and visual field (VF) constriction, which eventually lead to legal blindness.1,2 The central VF of patients with RP is usually assessed using a static automated perimeter, such as the Humphrey Field Analyzer (HFA; Carl Zeiss Meditec, Dublin, CA).3,4 However, VF assessment requires a cooperative and responsive patient, which can be somewhat subjective in nature. On the contrary, fundus autofluorescence (AF) imaging provides an objective measure of the retina, thus enabling a practitioner to visualize the distribution of lipofuscin at the level of retinal pigment epithelium (RPE). High AF signal intensity indicates the excessive accumulation of lipofuscin or other fluorophores, and low AF signal intensity indicates the loss or atrophy of RPE.5,6 A previous study showed that wide-field AF imaging reflected the current scotoma and remaining VF in patients with RP.7
In a large population of patients with RP, characteristic hyperautofluorescent ring (AF ring) is observed at the parafoveal area.8–10 Although this finding is not observed in very early or late stage of RP, or with specific genetic subtype, more than half of RP patients especially in the middle stage of the disease showed this finding.8,10 The AF ring has attracted attention because recent studies using HFA10 or microperimetry (e.g., MP-1; Nidek Technologies, Tokyo, Japan)11 have suggested that the ring may be a good indicator of retinal dysfunction. This finding is also supported by other previous studies showing that the amplitudes of pattern electroretinography (pERG)9 and multifocal electroretinography (mfERG)12 are significantly correlated with the size of the AF ring. More recent study showed that VF sensitivity was more closely associated with the area of the AF ring than with the area of disrupted ellipsoid zone (EZ) assessed by the optical coherence tomography (OCT). Considering that present status or progressive constriction of residual central visual field is a matter of serious concern for quality of life in patients with RP, especially in their middle stage, it should be highly beneficial to clarify the relationship between AF ring and VF.
However, one of the problems in these studies is that the AF ring was defined subjectively, specifically with visual inspection, thus limiting the repeatability and reproducibility of the result. We believe that an objective definition of the AF ring is essential for the accurate evaluation of the relationship between the AF ring and visual function.
The purpose of this study was to develop a novel method that can objectively define the AF ring by using image processing in Fiji. The relationship between the objectively identified AF ring and retinal sensitivities was also examined.
Methods
This retrospective cross-sectional study was approved by the Research Ethics Committee of the Graduate School of Medicine and the Faculty of Medicine of The University of Tokyo. Patients agreed to the storage and use of their information in the hospital database and in research, respectively, via written informed consent. This study was performed according to the tenets of the Declaration of Helsinki.
Subjects
This study included consecutive patients with RP who presented at the retina clinic of the University of Tokyo between November 2015 and November 2017. All patients fulfilled the following inclusion criteria: (1) typical fundus finding of RP, such as bone spicule pigmentation, arteriolar attenuation, and waxy disc pallor; (2) reduction in a- and b-wave amplitudes or nondetectable full-field ERG; (3) a midperipheral VF defect; (4) RP is the only disease causing VF damage; (5) follow-up for at least 6 months and both HFA and wide-field AF imaging within three months; (6) best-corrected visual acuity less than 0.5 LogMAR (to ensure reliability of VF testing)13; and (7) AF ring within 10° of the center from the fovea.
VF Testing
A white-on-white HFA 10-2 measurement was performed with the Swedish Interactive Threshold Algorithm Standard testing algorithm and Goldmann stimulus size III. This measurement is commonly used for assessing the residual central VF in patients with midstage RP.14 Only reliable VFs, which were defined as a fixation loss rate less than 20% and a false-positive rate less than 15%, were used in the analyses by following the criteria used by the HFA software; false-negative rate was not used as an exclusion criterion.15
AF Imaging
Fundus AF imaging was obtained without pupil dilation by using an ultra-widefield imaging system (Optos 200Tx; Optos, Dunfermline, UK), which uses a 532-nm exciter filter and a 570-to 780-nm barrier filter for AF detection. This instrument allows the visualization of the retina in 200° in a single frame. Images interfered with by eyelashes were excluded, as well as those in which the macula was largely shifted from the center.
AF Image Processing
1. Image Input
Each image output was automatically corrected for three- to two-dimensional projection errors by the V2 Vantage Pro software (Optos). Then, they were processed using Fiji software version 1.0 based on ImageJ.16 Each image had a width of 3900 pixels (px) and a height of 3072 px. The XY origin (the coordinate of [0, 0]) was defined as the upper left corner of the image window.
2. Identification of the Fovea and the Disc
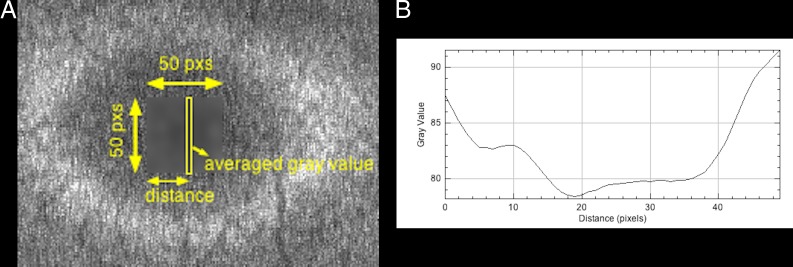
A 50 × 50-px rectangle, including the fovea, was manually selected (Fig. 1A). By using a “column average plot” function, the x-axis value corresponding to the lowest gray value was defined as the x-coordinate of the fovea on the basis of the assumption that the lowest AF intensity was observed in the fovea because of blockage by macular pigment (Fig. 1B).17,18 The y-coordinate of the fovea was similarly defined.
Figure 1.
(A) Enlarged image of the original image. A 50 × 50-px rectangle including the fovea is selected, and the area is blurred to remove noise. Thereafter, the averaged gray value is calculated for every distance from the left side of the 50 × 50-px rectangle. (B) Column average plot of the blurred area in (A). The x-axis represents the horizontal distance from the left side of the 50 × 50-px rectangle, and the y-axis represents the vertically averaged gray value (pixel intensity). In this case, the x-axis value corresponding to the lowest gray value is 19.
An ellipse was also manually fitted to the outer border of the optic disc, and the center of the ellipse was defined as the center of the optic disc.
3. Definition of 1° Distance
The difference between the fovea and the center of the optic disc was assumed to correspond to a 15° angle of view and was used as a reference angle.19 A recent study examining three-dimensional printed model eyes and images captured by ultra-widefield imaging system reported that distortion increases toward the periphery.20 We thus did not use the raw angle subtense of Optos (200°), which includes all pixels from the center to the periphery and are considered as inappropriate for determining a reference angle. Using the calculated reference angle, we cropped the image to a rectangle of 20° wide and 20° high with the fovea in the midpoint (Fig. 2A).
Figure 2.
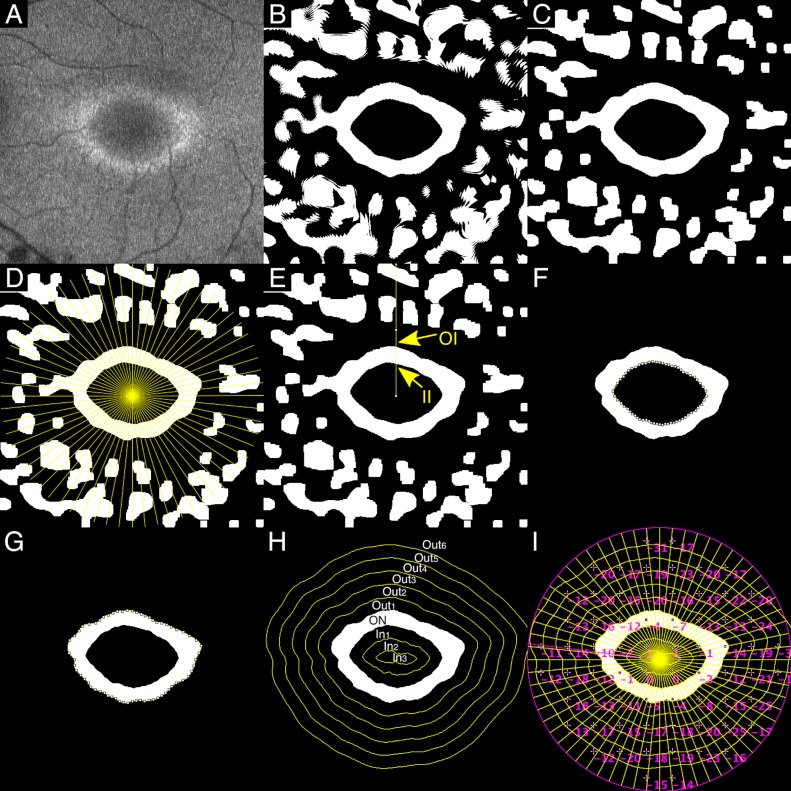
Representative case. (A) Image cropped to a rectangle of 20° wide and 20° high with the fovea in the midpoint. (B) Blurring and binarization. (C) Erosion and dilation. (D) Sixty-four half lines from the fovea every π/32 radians. (E) Two intersections between the line and the AF ring (II, inner intersection; OI, outer intersection). (F) The inner border of the AF ring: interpolations with cubic splines between IIs. (G) The outer border of the AF ring: interpolations with cubic splines between OIs. (H) Concentric curves outside and inside the AF ring at 1° intervals. (I) TD of HFA (10-2) superimposed on the binary image.
4. Binarization Processing
Niblack's local thresholding technique was performed to binarize the image21 (Fig. 2B). This technique calculates a different threshold for each pixel depending on the grayscale information of the neighboring pixels; thus, it is robust with regard to fluctuation of raw AF images.
5. Morphologic Operations
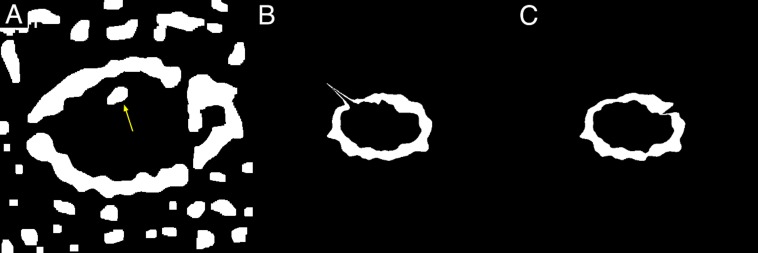
To reduce the noise, we performed erosion operators followed by dilation operators (Fig. 2C). The effect of erosion operators on a binary image is to erode away foreground objects (white objects) by removing pixels at their boundaries. By contrast, the effect of dilation operators is to enlarge foreground objects (white objects) by adding pixels to their boundaries. The result of erosion followed by dilation is called “morphologic opening,” which removes the white objects smaller than the structuring element. If white isolated objects still remained inside the ring after the erosion and dilation, they were manually filled with black (gray value = 0) (Fig. 3A).
Figure 3.
(A) Noise in the AF ring (arrow), manually filled with black (gray value = 0). (B) Inappropriate AF ring that has a spiky part projecting out in the direction of 10 o'clock. (C) Inappropriate AF ring that has a notch in the direction of 2 o'clock.
6. Definition of the AF Ring
A total of 64 half lines were drawn every π/32 radians starting from the fovea (Fig. 2D). Two intersection points were identified in each line, one was at the inner border of the AF ring (inner intersection [II]) and the other was at the outer border of the AF ring (outer intersection: OI) (Fig. 2E). The distance between these two intersection points was defined as the ring width (RW), and the distance between the fovea and II was defined as the inner radius (IR). Occasionally, the intersection was inappropriately identified, thus compromising the integrity of the AF ring (Figs. 3B, 3C). Hence, lines that satisfied all of the following conditions were selected: (1) the line had both II and OI; (2) the RW was within  to 1.5× RWs of the neighboring lines; (3) the RW was larger than 2 px; (4) the IR was within
  to 1.3× IRs of neighboring lines.
A cubic spline curve to the selected IIs or the OIs was defined as the inner or outer border of the ring, respectively (Figs. 2F, 2G). The ratio of the number of selected lines to 64 lines was calculated in each image and was called the acceptance rate.
7. Division of the Image into Several Sectors
By using the AF ring above, the image was divided into the following three sectors: inside the AF ring (IN), on the AF ring (ON), and outside the AF ring (OUT). Moreover, concentric curves were drawn at 1° intervals outside and inside the AF ring. The image was then divided into the following 10 sectors according to the relationship to the AF ring (Fig. 2H): (1) 5° or more outside the AF outer ring (OUT6), (2) between 4° and 5° outside the AF outer ring (OUT5), (3) between 3° and 4° outside the AF outer ring (OUT4), (4) between 2° and 3° outside the AF outer ring (OUT3), (5) between 1° and 2° outside the AF outer ring (OUT2), (6) between the AF outer ring and 1° outside the AF outer ring (OUT1), (7) on the AF ring (ON), (8) between the AF inner ring and 1°inside the AF inner ring (IN1), (9) between 1° and 2° inside the AF inner ring (IN2), and (10) 2° or more inside the AF inner ring (IN3).
8. Superimposition of HFA 10-2
Finally, the total deviation (TD) of HFA 10-2 was superimposed (Fig. 2I). The sectorial mean of TDs was calculated in each of the 10 sectors.
The above processes from 1 to 8 were performed twice by two independent raters (TI and YH) to assess the intra- and interrater agreements.
9. Application of a Freehand Method
The AF ring was also defined with visual inspection (the freehand method) for comparison with the binarization method. First, all 23 images were cropped to 20° × 20° images by using the above-referenced angle. Thereafter, three raters (JL, ST, and AF) subjectively drew freehand lines of the ring in all eyes using Fiji software. It should be noted that this freehand method was implemented on raw images before being processed by blurring and binarization.
Statistical Analysis
To analyze precision (intra- and interrater agreements), we used Jaccard indices (JI), which is obtained by dividing the number of pixels of the intersection of the areas by the number of pixels of the union. First, the JIs between the first and second experiments of each rater were calculated as intrarater agreement in both the group using the binarization method (Groupbi) and in the group using the freehand method (Groupfr). Second, the JIs at the first experiment between the different raters within each group (Groupbi or Groupfr) were calculated as interrater agreement. These JIs were compared between Groupbi and Groupfr by using a linear mixed model, whereby raters and subjects were treated as random effects.
To determine the degree of classification accuracy of the binarization method, we measured in which sector (IN, ON, and OUT) the 68 points in HFA were classified for the binarization and freehand methods. We compared the results by calculating percent agreement and weighted kappa statistic.
The relationship between the area inside the inner border of the AF ring and the mean deviation (MD) in the binarization method was investigated using a linear mixed model, whereby subjects were treated as random effects.
The sectorial mean TDs of the three sectors (IN, ON, and OUT) both in the binarization and the freehand methods were compared using Tukey's test in a linear mixed model, whereby subjects and eyes were random effects. The sectorial mean TDs of the 10 sectors in the binarization method were compared next to each other by using a linear mixed model, whereby patients and eyes were random effects.
All analyses were performed using the statistical programming language R (R version 3.3.3; R Project for Statistical Computing, Vienna, Austria).
Results
Defining the AF Ring by Using the Binarization Method
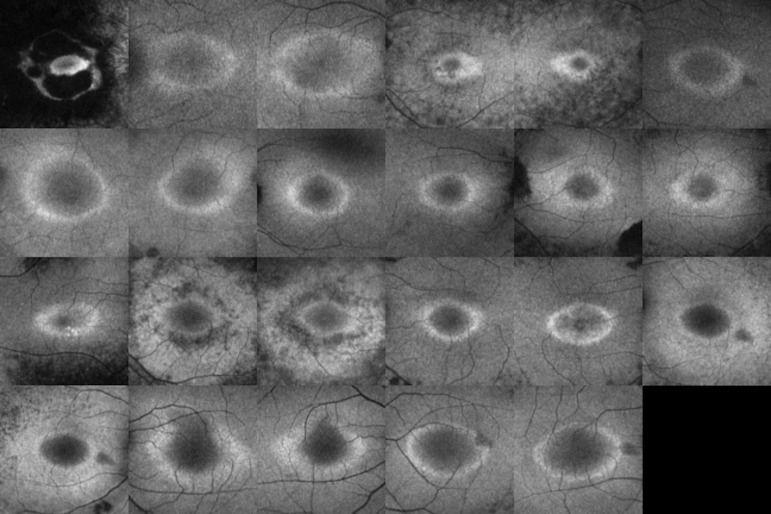
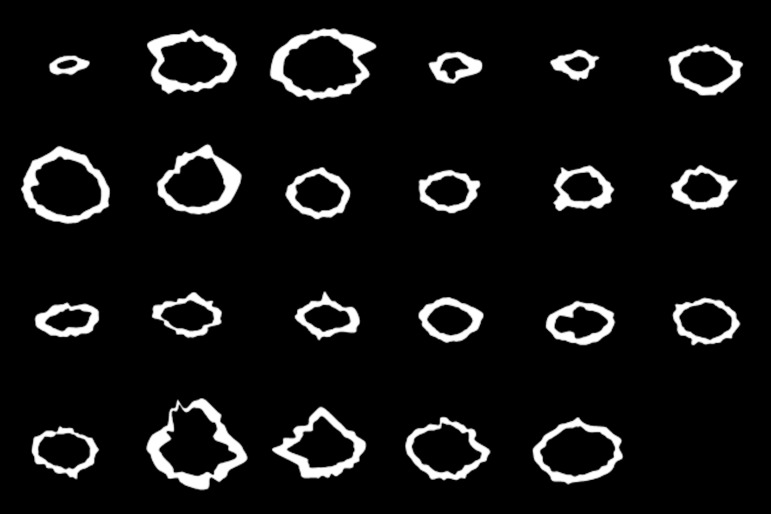
The subject demographics are shown in Table 1. The acceptance rate or the ratio of the number of selected lines to 64 lines was 70% to 80% (N = 4), 80% to 90% (N = 5), or 90% to 100% (N = 14). The mean ± standard deviation (SD) was 90 ± 0.08%. Figure 4 shows all 23 AF images before binarization, and Figure 5 shows all 23 binarized images.
Table 1.
Patient Demographics
| Mean (SD) |
Range |
|
| Sex, male/female | 5/8 | |
| Laterality, right/left | 12/11 | |
| Age, y | 44 (17) | 19–66 |
| Refractive error, diopter | −2.1 (3.1) | −9.4 to +2.8 |
| Best corrected visual acuity, logMAR | 0.15 (0.36) | −0.18 to +1.5 |
| Mean deviation, dB | −15 (7.5) | −32 to −5.6 |
Figure 4.
All 23 fundus AF images before processing with the binarization method.
Figure 5.
All 23 fundus AF images after processing with the binarization method.
Intra- and Interrater Agreements
Figure 6A shows the distribution of JIs between the first and second experiments for each rater. The means ± SDs of JIs in Groupbi were 0.94 ± 0.04 (rater 1) and 0.95 ± 0.05 (rater 2), whereas the means in Groupfr were 0.74 ± 0.05 (rater 3), 0.73 ± 0.05 (rater 4), and 0.78 ± 0.05 (rater 5). The JIs of Groupbi were significantly higher than those of Groupfr (P = 0.002). Figure 6B shows the distribution of JIs between the different raters in each of the two groups (Groupbi or Groupfr) at the first experiment. The mean ± SD of JIs in Groupbi was 0.95 ± 0.04 (rater 1 vs. rater 2), whereas the means ± SDs in Groupfr were 0.68 ± 0.08 (rater 3 vs. rater 4), 0.71 ± 0.06 (rater 3 vs. rater 5), and 0.69 ± 0.08 (rater 4 vs. rater 5). The JIs of Groupbi were significantly higher than those of Groupfr (P = 0.005).
Figure 6.
(A) The distribution of JIs between the first and second experiments in each rater. The JIs of the group using the binarization method (Groupbi) were significantly higher than those of the group using the freehand method (Groupfr, P = 0.002). (B) The distribution of JIs between the different raters in each of the two groups (Groupbi and Groupfr). The JIs of Groupbi were significantly higher than those of Groupfr (P = 0.005).
Agreement Between the Binarization and Freehand Methods
Table 2 shows how the classification of the binarization method corresponds to that of the freehand method. Percent agreement was 0.94 and weighted kappa statistic was also 0.94 (P < 0.001).
Table 2.
Classification of All the Points in 23 Patients According to AF Rings Judged by the Binarization and Freehand Methods
| Freehand |
||||
| IN |
ON |
OUT |
Total |
|
| Binarization | ||||
| IN | 167 | 35 | 0 | 202 |
| ON | 3 | 152 | 13 | 168 |
| OUT | 0 | 41 | 1153 | 1194 |
| Total | 170 | 228 | 1166 | 1564 |
VF Sensitivity and the AF Ring
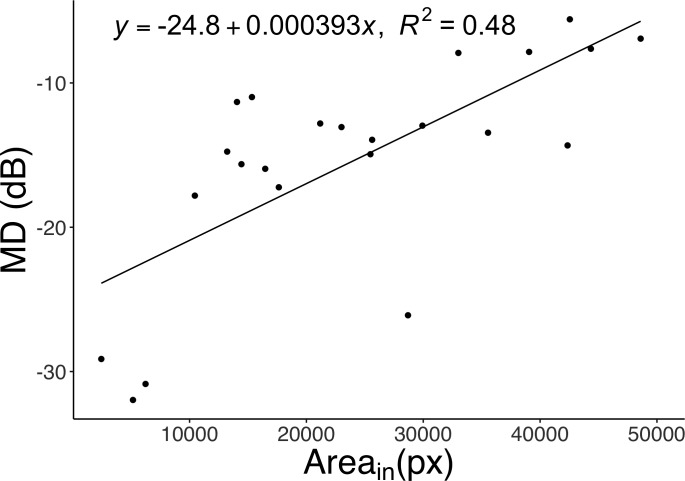
Figure 7 shows the relationship between the MD and the area inside the inner border of the AF ring. The two parameters showed a significant positive correlation (R2 = 0.48, P < 0.001).
Figure 7.
The relationship between the MD and the area inside the inner border of the AF ring (Areain) in the binarization method. There was a significant positive correlation between MD and Areain (P < 0.001).
Figure 8A shows the distribution of TDs of the three sectors (IN, ON, OUT) in the binarization method. The means ± SDs of the TDs in each sector were −4.0 ± 4.6, −6.9 ± 5.4, and −18 ± 9.1 dB in IN, ON, and OUT, respectively. The TD of IN was significantly higher than the TDs of ON and OUT (P = 0.016 and P < 0.001, respectively), and the TD of ON was significantly higher than that of OUT (P < 0.001).
Figure 8.
(A) The distribution of TD in the three sectors (inside the AF ring, IN; on the AF ring, ON; outside the AF ring, OUT) in the binarization method. Each dot represents the TD of each of the 68 points in HFA 10-2 for a patient, and N represents the number of points. There were significant differences among all sectors (IN vs. ON, P = 0.016; ON vs. OUT, P < 0.001; IN vs. OUT, P < 0.001). (B) The distribution of TD in the three sectors (IN, ON, OUT) in the freehand method. Each dot represents the TD of each of the 68 points in HFA 10-2 for a patient, and N represents the number of points. There were significant differences among all sectors (all P < 0.001, ***P < 0.001).
The distribution of TDs of the three sectors (IN, ON, OUT) in the freehand method is shown in Figure 8B. The means ± SDs of the TDs in each sector were −3.9 ± 4.5, −7.3 ± 6.2, and −19 ± 9.0 dB in IN, ON, and OUT, respectively. The TD of IN was significantly higher than the TDs of ON and OUT, and the TD of ON was significantly higher than that of OUT (all P < 0.001).
The means ± SDs of TD in the binarization method in the 10 groups (IN3, IN2, IN1, ON, OUT1, OUT2, OUT3, OUT4, OUT5, and OUT6) were −4.1 ± 4.7, −3.2 ± 4.0, −4.5 ± 4.6, −6.9 ± 5.4, −12 ± 7.1, −16 ± 8.5, −18 ± 8.5, −19 ± 7.8, −21 ± 8.4, and −25 ± 8.6 dB, respectively. IN2 had a significantly higher value than IN1 (IN2 > IN1), as well as IN1 > ON, ON > OUT1, OUT1 > OUT2, and OUT2 > OUT3 (all P < 0.001). Other four sets of comparison (IN3 vs. IN2, OUT3 vs. OUT4, OUT4 vs. OUT5, and OUT5 vs. OUT6) showed no significant difference (P = 0.22, P = 0.84, P = 0.073, and P = 0.17, respectively). The retinal sensitivities decreased not sharply but gradually across the ring.
Discussion
In this study, we developed a novel method to evaluate the AF ring objectively in eyes with RP using binarization processing. There was good agreement between this binarization method and the conventional freehand method, and the binarization method showed significantly higher precision (intra- and interrater agreements) than the freehand method. Retinal sensitivities showed gradual changes across the AF ring rather than sharp changes.
Previous studies have shown that the AF ring is correlated with retinal function by using examinations, such as HFA, Goldmann perimetry, microperimetry, pERG, and mfERG.9–12,22 The AF ring has also been associated with the disruption of the EZ and a decrease in the outer nuclear layer (ONL) thickness shown in OCT.8,23,24 A recent study showed that VF sensitivity was more closely associated with the area of the AF ring than the area of disrupted EZ assessed with OCT.25 Although these studies suggested the significance of examining the AF ring in clinical practice, quantitative analysis was limited because the AF ring was subjectively defined by the human eye.
In this study, we defined the AF ring using binarization techniques, thus enabling the objective examination of the AF ring. Although the freehand method is still used in many studies as the gold standard for identifying the AF ring, there are also a few studies trying to assess the AF ring quantitatively. Jolly et al.26 reported the quantitative analysis of the AF ring using image processing, but they defined the radius of the AF ring in a one-dimensional manner. By contrast, we defined the AF ring in this study in a two-dimensional manner. We believe that two-dimension images have more information and are essential for analyzing the relationship between the AF ring and retinal sensitivities in detail. Another study reported a powerful technique called qualitative fundus AF (qAF), which measures fluorescence intensity with high repeatability. The images taken by qAF can be compared among different subjects or among different images within the same subject.27,28 However, this technique requires the internal fluorescent reference, which is not commercially available. By contrast, Optos is one of the most widely used commercially available systems29 that provide nonmydriatic quick diagnosis,30 and Fiji is a free and open-source software. Thus, the binarization algorithm in the present study can be readily used in daily clinical practice.
In terms of precision, the binarization method showed higher intra- and interrater agreements than the freehand method. Given that retinal dystrophy progresses slowly, assessment with excellent precision is important. The JIs in Groupbi were significantly greater than those in Groupfr both for intrarater agreement (0.94–0.95 vs. 0.73–0.78, respectively) and for interrater agreement (0.95 vs. 0.68–0.71, respectively). This result emphasizes the usefulness of the binarization method, particularly in follow-up procedures for chronic diseases, such as RP. We investigated the association between the AF ring and VF sensitivity. Our results showed that the area inside the inner border of the AF ring was significantly correlated with MD and that sectorial mean TDs were significantly high in IN, ON, and OUT in descending order. These results are consistent with previous reports using the freehand method, thus indicating that binarization processing has a sufficient degree of accuracy. The present study also showed that there was good agreement between the binarization and freehand methods (kappa statistic, 0.94). This also supports the accuracy of the binarization method.
Furthermore, adjacent sectorial TDs were analyzed according to the distance from the AF ring at 1° intervals. The result showed that IN2 was significantly higher than IN1 (IN2 > IN1), IN1 > ON, ON > OUT1, OUT1 > OUT2, and OUT2 > OUT3. This result suggests that retinal sensitivities change gradually rather than sharply across the AF ring from 2° inside the inner border to 3° outside the outer border. In other words, retinal sensitivities do not change in the way that they take a higher constant value inside the inner border, sharply decrease across the AF ring, and take a lower constant value outside the outer border. A recent study showed that the structural changes in the transition zone (from healthy to diseased retina) in RP progressed in an orderly manner from the thinning of the outer segment (OS) layer, the thinning of the ONL, the loss of the OS layer, and the reduction of ONL to an asymptotically small level.31 Another study reported that the thickness of the OS decreased linearly with loss of local field sensitivity.32 Considering these studies, the gradual change of retinal sensitivities across the AF ring in the present study may be biologically plausible.
This study has several limitations. First, the sample size is relatively small. Because we identified the parameters of image processing so that the images produced could be appropriate, there may be overfitting in our method. Also, we included eyes with “visually” appropriate AF rings; thus, our method may not be applied to suboptimal images (more obscure rings). To verify that this new method can be applied to other patients with RP, further studies with larger sample size would be essential. Second, images taken by Optos have lower resolution (19 px/degree) than those taken by the standard confocal scanning laser ophthalmoscope HRA2 (Heidelberg Engineering, Heidelberg, Germany; 25.6 px/degree). Furthermore, unlike HRA2, Optos produces distorted images especially for the periphery.20,22 However, a previous study reported that Optos could be substituted for HRA2 in AF image acquisition, at least for qualitative analysis in clinical practice22; therefore, there may be little difference between Optos and HRA2 in quantitative evaluation. Considering applying mydriatics to RP patients temporarily worsens photophobia, the use of Optos without mydriasis is thought to be a useful option in clinical practice. Third, the pixel defined as the fovea may not be identical to the fixation point in the VF analysis. It could be quite helpful to use another measure, such as FA, to identify the location of the fovea, but the data were not available in the present study. Although further investigation is needed to improve the AF registration and the VF test, the results of the present study suggest the superiority of the new method over the conventional freehand method in the objective assessment of the AF ring.
In conclusion, we newly developed a novel method to objectively evaluate the AF ring by using binarization processing. This method showed significantly higher precision and the same degree of accuracy as the freehand method. The retinal sensitivities gradually decreased from 2° inside the inner border to 3° outside the outer border.
Acknowledgments
This work was supported by Novartis Pharma Research Grants. They had no role in the design or conduct of this research.
Disclosure: Y. Hashimoto, None; T. Inoue, None; T. Ono, None; J. Lee, None; S. Tsuneyoshi, None; A. Fujita, None; Y. Inoue, None; S. Ogawa, None; R. Asaoka, None; R. Obata, None
References
- 1.Hartong DT, Berson EL, Dryja TP. Retinitis pigmentosa. Lancet. 2006;368:1795–1809. doi: 10.1016/S0140-6736(06)69740-7. [DOI] [PubMed] [Google Scholar]
- 2.Narayan DS, Wood JPM, Chidlow G, Casson RJ. A review of the mechanisms of cone degeneration in retinitis pigmentosa. Acta Ophthalmol. 2016;94:748–754. doi: 10.1111/aos.13141. [DOI] [PubMed] [Google Scholar]
- 3.Abe K, Iijima H, Hirakawa H, Tsukahara Y, Toda Y. Visual acuity and 10° automated static perimetry in eyes with retinitis pigmentosa. Jpn J Ophthalmol. 2002;46:581–585. doi: 10.1016/s0021-5155(02)00548-8. [DOI] [PubMed] [Google Scholar]
- 4.Swanson WH, Felius J, Birch DG. Effect of stimulus size on static visual fields in patients with retinitis pigmentosa. Ophthalmology. 2000;107:1950–1954. doi: 10.1016/s0161-6420(00)00356-0. [DOI] [PubMed] [Google Scholar]
- 5.Von Rückmann A, Fitzke FW, Bird AC. Distribution of pigment epithelium autofluorescence in retinal disease state recorded in vivo and its change over time. Graefes Arch Clin Exp Ophthalmol. 1999;237:1–9. doi: 10.1007/s004170050186. [DOI] [PubMed] [Google Scholar]
- 6.Schmitz-Valckenberg S, Holz FG, Bird AC, Spaide RF. Fundus autofluorescence imaging: review and perspectives. Retina. 2008;28:385–409. doi: 10.1097/IAE.0b013e318164a907. [DOI] [PubMed] [Google Scholar]
- 7.Ogura S, Yasukawa T, Kato A, et al. Wide-field fundus autofluorescence imaging to evaluate retinal function in patients with retinitis pigmentosa. Am J Ophthalmol. 2014;158:1093–1098. doi: 10.1016/j.ajo.2014.07.021. [DOI] [PubMed] [Google Scholar]
- 8.Murakami T, Akimoto M, Ooto S, et al. Association between abnormal autofluorescence and photoreceptor disorganization in retinitis pigmentosa. Am J Ophthalmol. 2008;145:687–694. doi: 10.1016/j.ajo.2007.11.018. [DOI] [PubMed] [Google Scholar]
- 9.Robson AG, El-Amir A, Bailey C, et al. Pattern ERG correlates of abnormal fundus autofluorescence in patients with retinitis pigmentosa and normal visual acuity. Invest Ophthalmol Vis Sci. 2003;44:3544–3550. doi: 10.1167/iovs.02-1278. [DOI] [PubMed] [Google Scholar]
- 10.Iriyama A, Yanagi Y. Fundus autofluorescence and retinal structure as determined by spectral domain optical coherence tomography, and retinal function in retinitis pigmentosa. Graefes Arch Clin Exp Ophthalmol. 2012;250:333–339. doi: 10.1007/s00417-011-1823-5. [DOI] [PubMed] [Google Scholar]
- 11.Greenstein VC, Duncker T, Holopigian K, et al. Structural and functional changes associated with normal and abnormal fundus autofluorescence in patients with retinitis pigmentosa. Retina. 2012;32:349–357. doi: 10.1097/IAE.0b013e31821dfc17. [DOI] [PMC free article] [PubMed] [Google Scholar]
- 12.Robson AG, Saihan Z, Jenkins SA, et al. Functional characterisation and serial imaging of abnormal fundus autofluorescence in patients with retinitis pigmentosa and normal visual acuity. Br J Ophthalmol. 2006;90:472–479. doi: 10.1136/bjo.2005.082487. [DOI] [PMC free article] [PubMed] [Google Scholar]
- 13.Matsuura M, Hirasawa K, Murata H, Asaoka R. The relationship between visual acuity and the reproducibility of visual field measurements in glaucoma patients. Invest Ophthalmol Vis Sci. 2015;56:5630–5635. doi: 10.1167/iovs.15-17576. [DOI] [PubMed] [Google Scholar]
- 14.Sayo A, Ueno S, Kominami T, et al. Longitudinal study of visual field changes determined by Humphrey Field Analyzer 10-2 in patients with retinitis pigmentosa. Sci Rep. 2017;7:16383. doi: 10.1038/s41598-017-16640-7. [DOI] [PMC free article] [PubMed] [Google Scholar]
- 15.Bengtsson B, Heijl A. False-negative responses in glaucoma perimetry: indicators of patient performance or test reliability? Invest Ophthalmol Vis Sci. 2000;41:2201–2204. [PubMed] [Google Scholar]
- 16.Schindelin J, Arganda-Carreras I, Frise E, et al. Fiji: An open-source platform for biological-image analysis. Nat Methods. 2012;9:676–682. doi: 10.1038/nmeth.2019. [DOI] [PMC free article] [PubMed] [Google Scholar]
- 17.Kellner U, Kellner S, Weber BHF, Fiebig B, Weinitz S, Ruether K. Lipofuscin- and melanin-related fundus autofluorescence visualize different retinal pigment epithelial alterations in patients with retinitis pigmentosa. Eye. 2009;23:1349–1359. doi: 10.1038/eye.2008.280. [DOI] [PubMed] [Google Scholar]
- 18.Smith RT, Koniarek JP, Chan J, Nagasaki T, Sparrow JR, Langton K. Autofluorescence characteristics of normal foveas and reconstruction of foveal autofluorescence from limited data subsets. Invest Ophthalmol Vis Sci. 2005;46:2940–2946. doi: 10.1167/iovs.04-0778. [DOI] [PMC free article] [PubMed] [Google Scholar]
- 19.Garway-Heath DF, Poinoosawmy D, Fitzke FW, Hitchings RA. Mapping the visual field to the optic disc in normal tension glaucoma eyes. Ophthalmology. 2000;107:1809–1815. doi: 10.1016/s0161-6420(00)00284-0. [DOI] [PubMed] [Google Scholar]
- 20.Nicholson L, Vazquez-Alfageme C, Clemo M, et al. Quantifying retinal area in ultra-widefield imaging using a 3-dimensional printed eye model. Ophthalmol Retin. 2018;2:65–71. doi: 10.1016/j.oret.2017.03.011. [DOI] [PubMed] [Google Scholar]
- 21.Firdousi R, Parveen S. Local thresholding techniques in image binarization. Int J Eng Comp Sci. 2014;3:4062–4065. [Google Scholar]
- 22.Oishi M, Oishi A, Ogino K, et al. Wide-field fundus autofluorescence abnormalities and visual function in patients with cone and cone-rod dystrophies. Invest Ophthalmol Vis Sci. 2014;55:3572–3577. doi: 10.1167/iovs.14-13912. [DOI] [PubMed] [Google Scholar]
- 23.Fleckenstein M, Charbel Issa P, Fuchs HA, et al. Discrete arcs of increased fundus autofluorescence in retinal dystrophies and functional correlate on microperimetry. Eye. 2009;23:567–575. doi: 10.1038/eye.2008.59. [DOI] [PubMed] [Google Scholar]
- 24.Lima LH, Cella W, Greenstein VC, et al. Structural assessment of hyperautofluorescent ring in patients with retinitis pigmentosa. Retina. 2009;29:1025–1031. doi: 10.1097/IAE.0b013e3181ac2418. [DOI] [PMC free article] [PubMed] [Google Scholar]
- 25.Lee J, Asaoka S, Inoue T, et al. Investigating the usefulness of fundus autofluorescence in retinitis pigmentosa. Ophthalmol Retin. 2018;2:1062–1070. doi: 10.1016/j.oret.2018.03.007. [DOI] [PubMed] [Google Scholar]
- 26.Jolly JK, Wagner SK, Moules J, et al. A novel method for quantitative serial autofluorescence analysis in retinitis pigmentosa using image characteristics. Transl Vis Sci Technol. 2016;5(6):10. doi: 10.1167/tvst.5.6.10. [DOI] [PMC free article] [PubMed] [Google Scholar]
- 27.Delori F, Greenberg JP, Woods RL, et al. Quantitative measurements of autofluorescence with the scanning laser ophthalmoscope. Invest Opthalmol Vis Sci. 2011;52:9379–9390. doi: 10.1167/iovs.11-8319. [DOI] [PMC free article] [PubMed] [Google Scholar]
- 28.Schuerch K, Woods RL, Lee W, et al. Quantifying fundus autofluorescence in patients with retinitis pigmentosa. Invest Opthalmol Vis Sci. 2017;58:1843–1855. doi: 10.1167/iovs.16-21302. [DOI] [PMC free article] [PubMed] [Google Scholar]
- 29.Witmer MT, Parlitsis G, Patel S, Kiss S. Comparison of ultra-widefield fluorescein angiography with the Heidelberg Spectralis® noncontact ultra-widefield module versus the Optos® Optomap®. Clin Ophthalmol. 2013;7:389–394. doi: 10.2147/OPTH.S41731. [DOI] [PMC free article] [PubMed] [Google Scholar]
- 30.Schwartz S, Gonzalez CL, Bhandari R, Oliver SN, Mandava N, Quiroz-Mercado H. Retina evaluation with nonmydriatic ultrawide-field color imaging after cataract extraction surgeries in asymptomatic patients. Ophthalmic Surgery Lasers Imaging Retin. 2015;46:50–55. doi: 10.3928/23258160-20150101-08. [DOI] [PubMed] [Google Scholar]
- 31.Hood D, Lazow M, Locke K, Greenstein V, Birch D. The transition zone between healthy and diseased retina in patients with retinitis pigmentosa. Invest Ophthalmol Vis Sci. 2011;52:101–108. doi: 10.1167/iovs.10-5799. [DOI] [PMC free article] [PubMed] [Google Scholar]
- 32.Rangaswamy N V, Patel HM, Locke KG, Hood DC, Birch DG. A comparison of visual field sensitivity to photoreceptor thickness in retinitis pigmentosa. Invest Ophthalmol Vis Sci. 2010;51:4213–4219. doi: 10.1167/iovs.09-4945. [DOI] [PMC free article] [PubMed] [Google Scholar]


