

Abstract
The folding of newly synthesized proteins to the native state is a major challenge within the crowded cellular environment, as non-productive interactions can lead to misfolding, aggregation and degradation1. Cells cope with this challenge by coupling synthesis with polypeptide folding and by using molecular chaperones to safeguard folding cotranslationally2. However, although most of the cellular proteome forms oligomeric assemblies3, little is known about the final step of folding: the assembly of polypeptides into complexes. In prokaryotes, a proof-of-concept study showed that the assembly of heterodimeric luciferase is an organized cotranslational process that is facilitated by spatially confined translation of the subunits encoded on a polycistronic mRNA4. In eukaryotes, however, fundamental differences—such as the rarity of polycistronic mRNAs and different chaperone constellations—raise the question of whether assembly is also coordinated with translation. Here we provide a systematic and mechanistic analysis of the assembly of protein complexes in eukaryotes using ribosome profiling. We determined the in vivo interactions of the nascent subunits from twelve hetero-oligomeric protein complexes of Saccharomyces cerevisiae at near-residue resolution. We find nine complexes assemble cotranslationally; the three complexes that do not show cotranslational interactions are regulated by dedicated assembly chaperones5–7. Cotranslational assembly often occurs uni-directionally, with one fully synthesized subunit engaging its nascent partner subunit, thereby counteracting its propensity for aggregation. The onset of cotranslational subunit association coincides directly with the full exposure of the nascent interaction domain at the ribosomal tunnel exit. The ribosome-associated Hsp70 chaperone Ssb8 is coordinated with assembly. Ssb transiently engages partially synthesized interaction domains and then dissociates before the onset of partner subunit association, presumably to prevent premature assembly interactions. Our study shows that cotranslational subunit association is a prevalent mechanism for the assembly of hetero-oligomers in yeast and indicates that translation, folding and assembly of protein complexes are integrated processes in eukaryotes.
To test whether protein assembly in eukaryotes initiates during translation, we analyzed 12 hetero-oligomeric complexes of S. cerevisiae (Extended Data Table 1). They were chosen to represent a variety of cellular functions, structural architectures, regulatory features, abundance and interface size. They are all verified complexes3, mainly stable ones3, with surface-exposed C termini for affinity tagging, and cytoplasmic or nuclear localization.
To identify the nascent-chain interaction profiles of complex subunits in vivo, we used selective ribosome profiling (SeRP)9. SeRP9,10 compares the distribution of ribosome-protected mRNA footprints of two distinct samples generated from a single culture. One comprises the ribosome protected footprints of all translated open reading frames (ORFs) orfs (total translatome). The other contains footprints of a selected set of ribosomes, co-purified with a tagged interaction partner (selected translatome). Accumulation of footprints in the selected translatome, as compared to the total translatome, directly indicates when it is during translation that the nascent chain interacts with the affinity-purified tagged protein subunit, at near-residue resolution.
We first analyzed the assembly of fatty acid synthase (FAS), a multifunctional enzyme integrating all the fatty acid biosynthesis steps11. FAS is composed of two multi-domain subunits, α and β, which assemble to a highly intertwined, 2.6 MDa, hetero-dodecameric (α6β6) complex (Fig. 1a,d)11. To capture cotranslational assembly in vivo, we generated two strains, each chromosomally encoding one of the FAS subunits C-terminally fused to GFP for immunopurification (IP). Tagging did not affect function (Extended Data Fig. 1a). SeRP demonstrates FAS assembly initiates cotranslationally in a specific, asymmetric manner. Tagged α does not engage ribosome-nascent chain complexes (RNCs) translating α or β. By contrast, tagged β engages RNCs synthesizing nascent α, leading to a strong, approximately 40-fold enrichment of selected footprints over total ribosome-protected footprints, starting near residue 125 of α, and persisting until synthesis ends (Fig. 1b). This asymmetry of cotranslational interactions contrasts immunoblotting results for the mature FAS, showing each FAS subunit can immunopurify their partner subunit post-translationally with the same 1:1 stoichiometry (Extended Data Fig. 1b). The FAS subunits hence have distinct roles in the cotranslational assembly of the complex.
Figure 1. Cotranslational assembly of the FAS complex.
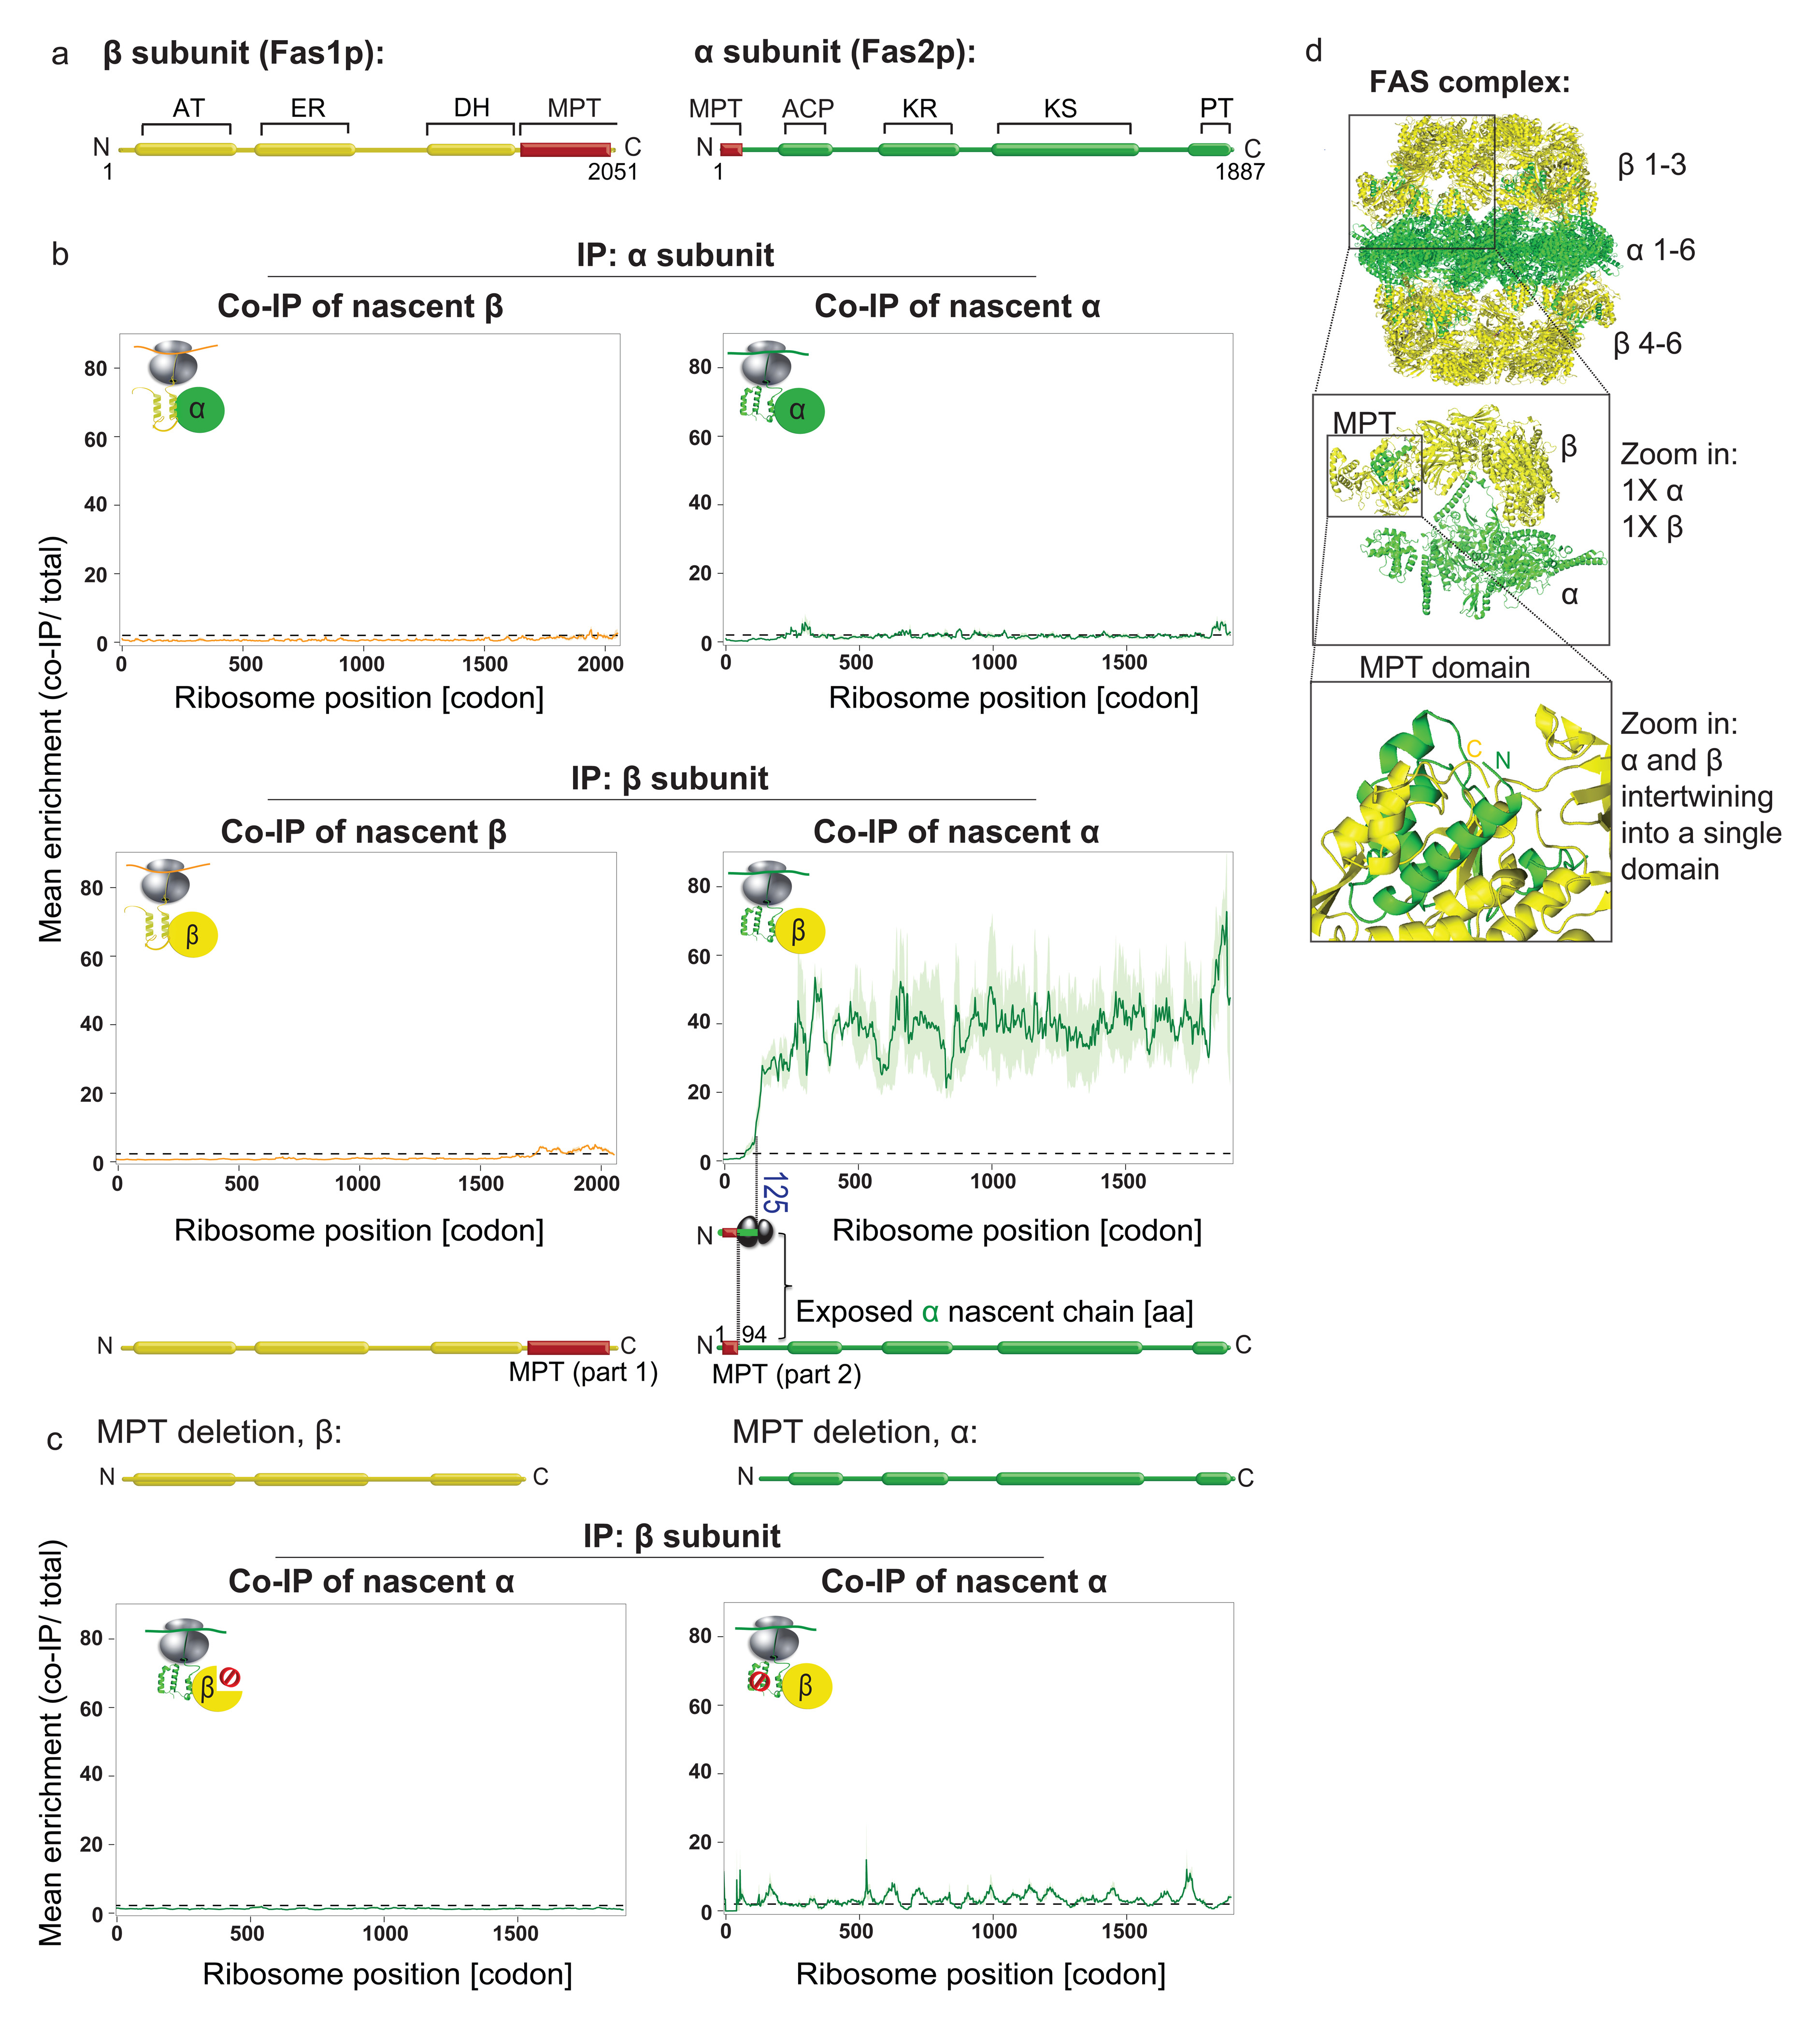
a, Domain organization of FAS subunits: acyltransferase (AT), enoyl-reductase (ER), dehydratase (DH), malonyl/palmitoyl-transferase (MPT), acyl carrier protein (ACP), ketoreductase (KR), ketoacyl synthase (KS), phosphopantetheine transferase (PT). b, Nascent β and α engagement by C-terminally tagged α (top) or by C-terminally tagged β (bottom), analysed by SeRP. CThe ribosome position at which the enrichment stably crosses the twofold threshold (codon 125) is indicated. The area between replicates is shaded, indicating the degree of experimental variation. Data are from two biologically independent experiments. IP, immunopurification. c, Effect of the deletion of the MPT domain segment on cotranslational interactions, analysed as in b. Data are from two biologically independent experiments. d, Structural characteristics of the FAS complex and the MPT domain (PDB: 2UV8).
The onset of cotranslational subunit engagement directly correlates with FAS structural features: it coincides with ribosome exposure of the first 94 amino acids of α— which are intertwined with the last 389 amino acids of β— to form a single catalytic domain, the malonyl/palmitoyl-transferase (MPT) domain (Fig. 1d)11. This implies that cotranslational assembly initiates upon formation of the MPT domain, the most stable interface between the two subunits12. To test whether the MPT interface is indeed required for cotranslational assembly of FAS, we analysed cotranslational interactions of FAS-deletion mutants lacking the MPT segments. Supporting the proposed model, MPT segments deletion, in either α or β, strongly reduces cotranslational interactions (Fig. 1c).
We tested whether cotranslational interactions are nascent-chain dependent by puromycin treatment, triggering the release of nascent chains from ribosomes13. Quantitative reverse transcription PCR (RT-qPCR) after immunopurification of the β-subunit revealed that puromycin reduces the level of co-purified α-encoding mRNAs (Extended Data Fig. 1c,d), suggesting cotranslational assembly relies on subunit association with nascent chains during translation. We next tested the extent of post lysis association of β with nascent α and found it to be very low (Extended Data Fig. 1e-g). We conclude our SeRP setup provides snapshots of physiological interactions with RNCs that were established in vivo. Taken together, our findings indicate that the assembly of the dodecameric (α6β6) FAS initiates cotranslationally by the formation of αβ hetero-dimers, mediated by the interaction of the C terminus of β with the N terminus of nascent α to form the MPT domain (Extended Data Fig. 1h).
Our SeRP data correlate with the differential aggregation propensities of the individual FAS subunits. Upon exposure to various stresses, α becomes highly prone to aggregation and degradation, while β remains soluble14,15. Similarly, β remains stable in mutants lacking α, whereas α is rapidly degraded in mutants lacking β16,17. These findings support a model in which the structurally robust β folds independently, then serves as a scaffold to chaperone the cotranslational folding and assembly of the unstable α, protecting it from aggregation. Thus, cotranslational assembly may ameliorate the challenging folding trajectory of α.
We next analyzed the assembly of a hetero-trimeric complex, the multi-aminoacyl-tRNA synthetase. This complex is composed of the essential methionyl- and glutamyl-tRNA synthetases MetRS and GluRS (encoded by MES1 and GUS1, respectively), both of which are required for charging their specific tRNA with cognate amino acids, and the Arc1p cofactor, which regulates their catalytic activities and subcellular distributions (Fig. 2a,d)18–20. We generated three strains, each chromosomally encoding one of the complex subunits C-terminally fused to GFP. Tagging did not affect function (Extended Data Fig. 2a). SeRP revealed both GluRS and MetRS engage each other cotranslationally, resulting in at least a 30-fold enrichment in footprints, starting at codon 196 and 168 of GUS1 and MES1, respectively, and persisting until synthesis ends. Both catalytic subunits also engage the nascent Arc1p cofactor, with nearly identical onsets approximately at codon 160 of ARC1 ~ (Fig. 2b). For all these nascent chains, the onset of partner subunit engagement occurs upon ribosome exposure of the N-terminus interaction domains, sharing a similar Glutathione-S-transferase (GST)-like fold20. Either catalytic subunit can thus cotranslationally engage all other subunits. In contrast, the fully synthesized Arc1p associates mainly with nascent GluRS (starting at codon 143) in a fluctuating manner, suggesting these interactions are less stable compared to the catalytic subunits (Fig. 2b, lower panels). Our combined findings suggest the assembly of multi-aminoacyl-tRNA synthetase initiates by cotranslational interactions of each of its subunits in a network-like manner (Extended Data Fig. 2b), involving the shared GST-like folds as assembly drivers.
Figure 2. Cotranslational assembly of the aminoacyl-tRNA-synthetase complex.

a, Domain organization of aminoacyl-tRNA-synthetase subunits. b, Engagement of nascent GluRS (left), Arc1 (middle) and MetRS (right) by C-terminally tagged GluRS (top), C-terminally tagged MetRS (middle) or C-terminally tagged Arc1 (bottom), analysed by SeRP. Coloured numbers indicate ribosome positions at which the enrichments stably cross the twofold threshold (dotted line). The area between replicates area shaded, indicating the degree of experimental variation. Data are from two biologically independent experiments. c Illustration of the subunits N′-terminal interfaces and structural fluctuations upon tRNA binding, based on structural data derived from a previous study19.
Notably, both GluRS and MetRS are bi-functional proteins regulating ATP-synthase expression upon glucose depletion. Arc1p is then rapidly degraded; MetRS relocates to the nucleus and GluRS to mitochondria21. As the localization signal of each of the two subunits is buried within the interface domains upon trimerization21, we speculate that cotranslational assembly can regulate dual protein targeting in eukaryotes, by prioritizing cytosolic activity under favorable growth conditions.
To investigate the prevalence of the cotranslational assembly mechanism, we subjected 10 additional complexes to SeRP analysis. In total, 12 complexes composed of 26 individual subunits were analysed. We find that 9 out of 12 complexes exhibit cotranslational subunit interactions, demonstrating the prevalence of this assembly mechanism among stable cytosolic complexes (see PFK, TRP further examples inExtended Data Figs 3,4; Extended Data Table 2). Six out of nine complexes use a directional assembly mode, with one specific subunit being released from the ribosome before engaging the nascent interaction partner or partners (FAS, NatA, NatB, TRP, CPA, eIF2; Extended Data Table 2).
We hypothesized the cotranslationally engaged subunits have a higher propensity to misfold compared to their fully-synthesized partners. Accordingly, FAS subunits display asymmetric misfolding propensities14,15,16,17. To test if this is a general feature, we performed in vivo aggregation and stability assays of subunits in wild-type and single subunit deletion strains for NatA, TRP and CPA. We excluded all complexes which are essential (eIF2)22 or show severe growth phenotype upon subunit deletion (NatB)23. All nascently engaged subunits tested are indeed prone to aggregation or degradation in the absence of their partner subunits. By contrast, subunits that are only engaged after release from the ribosome are much more soluble and stable in the absence of their partner subunits (Extended Data Fig. 5a-c). Our findings suggest that in particular aggregation-prone subunits engage their partner subunits cotranslationally.
Three complexes do not show cotranslational assembly: (i)20S proteasome subunits α1,2; (ii)V-type-ATPase catalytic hexamer (A3,B3); (iii)ribonucleotide reductase RNR (Rnr2p and Rnr4p complex). All three complexes are tightly controlled by dedicated assembly chaperones or inhibitors5–7. We speculate that these dedicated assembly factors function cotranslationally, protecting subunits from misfolding and premature binding to their partner subunits.
The position-resolved cotranslational interaction profiles of all 14 subunits identified in this study enabled us to reveal general features of the assembly process. We find that the onsets of interactions vary, but they are generally stable, persisting until synthesis ends (Fig. 3a, Extended Data Fig. 5d). Analysis of the nascent-chain features revealed that subunits containing extreme C-terminal interaction domains are excluded. In nearly all complexes, subunits are engaged when a complete interaction domain and additional 24-37 amino acids have been synthesized (Fig. 3b). The eukaryotic ribosomal tunnel accommodates approximately 24 amino acids in extended conformation and approximately 38 amino acids in α-helical conformation24. Thus, the sharp onset of assembly (Fig. 3c) directly correlates with the emergence of the entire interface domain from the ribosome exit tunnel. Taken together, our results suggest assembly is facilitated by interface domains cotranslational folding.
Figure 3. Characteristics of cotranslational complex assembly interactions.

a, Onset and persistence of the cotranslational interaction of each subunit with its partner complex subunit or subunits, for all 14 subunits identified as cotranslationally engaged. NAA20 and NAA15 are also known as NAT3 and NAT1, respectively.b, Top, interaction domain exposure correlated to the onset of assembly onset. Bottom, an expanded view of the region surrounding the onset of assembly.c, Normalized mean read density of interaction profiles of 14 cotranslationally engaged subunits, aligned and zoomed-in to the assembly onset of each nascent chain. AU, arbitrary units.
Folding of nascent polypeptides in yeast is facilitated by the Hsp70 family member Ssb, the major ribosome-associated chaperone8,10,25. Ssb is targeted to the ribosome by the RAC complex25 and by direct contacts with the exit tunnel26, ensuring high affinity to short, hydrophobic nascent-chain segments10. This raises the question of how Ssb binding relates to cotranslational complex assembly. Analysis of Ssb SeRP interaction profiles10 shows that all nascent-chains that engage partner subunits have one or multiple Ssb binding peaks. Ssb binds 13 out of 14 subunits before the onset of cotranslational assembly, generally during the synthesis of interaction domains, and dissociates just before subunit engagement (Fig. 4b,c for examples; Fig. 4d,e). Ssb engagement is thus well coordinated with assembly. We propose that Ssb shields hydrophobic patches within interaction domains, protecting them from non-productive interactions and misfolding. Ssb dissociates upon full ribosome exposure of these domains, permitting cotranslational folding and subunit joining. We further investigated Ssb interplay with assembly by a proteome-wide bioinformatics analysis, identifying all putative cotranslationally assembled subunits (for details, see 'Data analysis section' in Methods). Metagene profiling of Ssb binding to these ORFs and/or nascent chains demonstrates that Ssb generally dissociates just prior to putative cotranslational assembly-onset positions, which are characterized by low hydrophobicity (Extended Data Fig.6). We suggest that the low hydrophobicity disfavors Ssb binding, allowing for interface domain folding and subunit interaction (see conclusions for model). To directly assess the effect of Ssb on cotranslational assembly, we attempted SeRP experiments in ssb1∆ssb2∆ cells. However, these experiments repeatedly failed, owing to the low amounts of ribosomes co-purified with tagged subunits. Nevertheless, these results are consistent with Ssb having an important role in cotranslational assembly. Accordingly, ssb1∆ssb2∆ mutants display widespread aggregation of newly synthesized proteins; among which complex subunits are enriched—including most of the complex subunits analyzed here (Extended Data Table 2)27.
Figure 4. Coordination of cotranslational complex assembly with the ribosome-associated chaperone Ssb binding.

a, Illustration of ribosome–nascent-chain binding to Ssb or a partner subunit. b, c, Zoomed-in interaction profiles of Ssb1–GFP and cotranslationally engaged partner subunits with the nascent FAS α (b, Fas2) and nascent GluRS (c), analysed by SeRP. The area between replicates is shaded, indicating the degree of experimental variation. d, Heat map of Ssb1–GFP binding to ribosomes synthesizing the 14 cotranslationally engaged subunits, compared to complex assembly onset. e, Metagene analysis of Ssb1–GFP interaction profiles with 14 cotranslationally engaged nascent chains, aligned and zoomed-in to assembly onset, compared to random position along the ORFs alignment. There is no correlation between the onset and random position alignment (Pearson correlation r=0.01256), thus Ssb depletion at onset positions is significant. The area between replicates is shaded, indicating the degree of experimental variation. b–e, Data are from two biologically independent experiments.
Beyond complex assembly, we hypothesized cotranslational interactions may extend to all protein-protein networks. We tested this possibility by identifying the proteome-wide nascent-chain interactions of some subunits in our dataset, focusing on the subunits of enzymatic pathways. We adapted a recently developed peak detection algorithm10, to identify local binding peaks, which were defined as a greater than threefold enrichment in footprint density over a stretch of more than ten codons. For FAS β, PFK β and Cpa2 subunits we detected additional, transient interactions with distinct sets of RNCs known to be functionally related or directly interacting with the subunit (examples in extended Data Fig. 7). One example is FAS β, which engages nascent acetyl-CoA carboxylase (Acc1p). Acc1p catalyses the step directly preceding FAS in the pathway (Extended Data Fig. 7a). Unlike the stable engagement of FAS β with nascent α for assembly, its association with nascent Acc1p is transient, similar to the interactions between fully synthesized FAS and Acc1p interactions that have previously been reported28. Nonetheless, it is specific, as β does not engage any other nascent member of the fatty acid synthesis pathway (Extended Data Fig. 7a). These findings provide first evidence that metabolic pathways can be coordinated cotranslationally. The extent and function of such nascent-chain interactomes have yet to be revealed.
To conclude, our study provides direct in vivo evidence, at near-residue resolution, that cotranslational subunit engagement is a widespread mechanism for complex assembly in eukaryotes. Our findings are consistent with previous studies, that used indirect approaches to study cotranslational interactions in eukaryotes, such as RNA-IP-microarray (RIP-Chip)29,30, or an in vitro translation system31.
The high misfolding propensities of the subunits which interact as nascent chains with partner subunits underscore the importance of this mechanism. Cotranslational assembly may be a prerequisite for the evolvement of complex folding architectures and the rescue subunits destabilized by accumulating mutations. We furthermore reveal an intricate functional interplay between the Ssb chaperone and the binding of partner subunits, suggesting that nascent subunits are constantly engaged (for model, see Extended Data Fig. 8). Conversely, exposed interfaces may serve as signals for subunit degradation, providing a molecular basis for quality control and the regulation of subunit stoichiometry at the level of the nascent chain. We further speculate that the translation of complex subunits is spatially confined in the cytosol, as this would facilitate timely assembly and prevent prolonged nascent-chain exposure.
Methods
Strains construction
GFP-tagged strains and deletion strains were generated via homologous recombination, constructed according to previously published work32. For the GFP-tag, a cassette containing the monomeric GFP gene and a G418 resistance marker was amplified from the pYM12-mGFP plasmid. For gene deletions, a cassette containing only a selection marker was PCR amplified. All experiments were performed in the BY4741 strain background. S. cerevisiae strains used in this study are listed in Supplementary Table S1.
Yeast cultures
Yeast cultures were cultivated either in liquid yeast extract–peptone–dextrose (YPD)-rich media, or in synthetic dextrose (SD) minimal media (1.7 g/l yeast nitrogen base with ammonium sulfate or 1.7 g/l yeast nitrogen base without ammonium sulfate with 1 g/l monosodium glutamic acid, 2% glucose and supplemented with a complete or appropriate mixture of amino acids) at 30°C. Trp2-GFP, Trp3-GFP strains were grown in SD lacking tryptophan; and Cpa1-GFP, Cpa2-GFP were grown in SD lacking arginine, to induce their expression. For fatty acid supplementation, SD media was supplemented with 0.03% Myristic acid (Sigma, pre-solved in DMSO), 0.1% Tween-40 (Sigma), and 0.05% yeast extract.
Purification of RNCs for SeRP
Approximately 800 ml of cell culture was grown to an OD600nm of 0.5, at 30°C, in appropriate media. Cell collection was performed in the culture medium as follows: cells were collected rapidly by vacuum filtration on 0.45-µm nitrocellulose (Aamersham) blotting membrane and then flash frozen, as previously described by10. Next, cells were lysed by cryogenic grinding in a mixer mill (2 min, 30 Hz, MM400 Retsch) with 900µl of lysis buffer (20 mM Tris-HCl pH 8.0, 140 mM KCl, 6 mM MgCl2, 0.1% NP-40, 0.1 mg/ml cycloheximide (CHX), 1 mM PMSF, 2✕ protease inhibitors (Complete EDTA-free, Roche), 0.02 U/ml DNaseI (recombinant DNaseI, Roche), 20 mg/ml leupeptin, 20 mg/ml aprotinin, 10 mg/ml E-64, 40 mg/ml bestatin). Lysates were cleared by centrifugation (2 min at 30,000g, 4°C).
For each experiment, supernatants were divided for total (200µl) and immunopurification (700µl) translatome samples. Total samples were digested using 10 U /A260 nm of RNaseI for 25 min at 4°C, in rotation, then loaded onto 800 µl of sucrose cushions (25% sucrose, 20 mM Tris-HCl pH 8.0, 140 mM KCl, 10 mM MgCl2, 0.1 mg/ml CHX, 1✕ protease inhibitors) and centrifuged in a TLA120-rotor for 90 min at 75,000 rpm, 4°C. Pellets were resuspended in lysis buffer and transferred to non-stick tubes. 100-200 mg of total RNA were taken for ribosome profiling of the total translatome.
Immunopurification samples were digested using 10 U /A260 nm of RNaseI, together with 100-400 µl of GFP-binder slurry and the suspension was rotated for 25 min, 4°C. Beads were washed three times in wash buffer I (20 mM Tris-HCl pH 8.0, 140 mM KCl, 10 mM MgCl2, 1 mM PMSF, 0.1% NP-40, 0.1 mg/ml CHX, 2✕ protease inhibitors) (3 min, 3✕1 min) and twice in wash buffer II (20 mM Tris-HCl, 140 mM KCl, 10 mM MgCl2, 1 mM PMSF, 0.1 mg/ml CHX, 0.01% NP-40, 10% glycerol, 2✕ protease inhibitors) (5 min, once 1 min and again for 4min). The washed beads were subsequently used for RNA or protein extraction. Affinity purification was analyzed by western blot with aliquots of each step.
cDNA library preparation for deep sequencing
Library preparation was performed mainly as described10. In summary, RNA extraction was performed by mixing 0.75 ml pre-warmed acid phenol (Ambion) with either the purified monosomes of the total translatome or the monosomes bound to affinity beads for the immunopurification translatomes and 40 ml 20% SDS (Ambion). After shaking at 1400 rpm for 5 min at 65°C, samples were incubated 5 min on ice and centrifuged at 20,000g for 2 min. Top aqueous layers were transferred to fresh tubes and mixed again with 0.7 mL acid phenol. Samples were incubated for 5 min at room temperature with occasional vortexing and afterward centrifuged for 2 min at 20,000g. Top aqueous layers were transferred to fresh tubes and mixed with 0.6 mL chloroform, vortexed and centrifuged for 1 min at 20,000g. Nucleic acids were precipitated by adding 78 ml 3 M NaOAc pH 5.5, 2 ml glycoblue and 0.75 ml isopropanol and incubating for 1 hr to 16 hr at -20°C. Samples were centrifuged for 30 min at 20,000g, 4°C and pellets were washed with ice-cold 80% ethanol and resuspended in 10 mM Tris-HCl pH 7.0. Samples were heated at 80°C for 2 min and for total translatome 50 mg of RNA and for IP translatome the entire sample was loaded onto a 15% TBE-Urea polyacrylamide gels (Invitrogen) in 1xTBE (Ambion) and run for 65 min at 200 V. Gels were stained for 20 min with SYBR gold (Invitrogen). To recover ribosomal footprints, the gel pieces were excised that contained RNA fragments with a size between 25 and 33 nt. Gel pieces were placed into 0.5 mL gel breaker tubes, nested into a 1.5 ml tube and centrifuged for 3 min at 20,000g. 0.5 mL 10mM Tris-HCl pH 7.0 was added and tubes were incubated at 70°C for 10 min with maximal shaking in an Eppendorf thermomixer. Gel pieces were removed using a Spin-X cellulose acetate column (Fisher) and the flow through was transferred to a new tube. 55 ml 3 M NaOAc pH 5.5, 2 ml glycoblue and 0.55 ml isopropanol were added. After mixing, tubes were frozen at -20°C for 16 hr. Samples were centrifuged for 30 min at 20,000xg and 4°C and pellets were washed with ice-cold 80% ethanol and resuspended in 15 ml of 10 mM Tris-HCl pH 7.0. For dephosphorylation, 2 µl 10x T4 polynucleotide kinase buffer without ATP (NEB), 1 ml murine RNase inhibitor and 2 µl T4 polynucleotide kinase (NEB) were added to each sample. Samples were incubated at 37°C for 1 hr before heat inactivation of the enzyme for 10 min at 75°C precipitation of nucleic acids by adding 0.5 mL 10mMTris-HCl pH 7.0, 55 µl 3MNaOAc pH 5.5, 2 µl glycoblue and 0.55 µl isopropanol and incubating for 1 hr to 16 hr at -20°C. Samples were centrifuged for 30min at 20,000xg and 4°C, pellets were washed with ice-cold 80% ethanol and resuspended in 6-11 µl of 10 mM Tris-HCl pH 7.0. For linker ligation, a maximum of 5 pmol RNA in 5 µl were denatured for 2 min at 80°C before 8 µl 50% sterile filtered PEG MW 8000, 2 µl DMSO, 2 µl 10x T4 RNA Ligase 2 buffer (NEB), 1 µl murine RNase inhibitor, 1 µl 1 mg/µl linker L1 and 1 µl truncated T4 RNA Ligase 2 (NEB) were added and incubated for 2.5 hr at 37°C or 23°C. Nucleic acids were precipitated as described before and resuspended in 6 µl 10mMTris-HCl pH 7.0. Samples were run on a 10% TBE-Urea polyacrylamide gel (Invitrogen) in 1x TBE (Ambion) for 50 min at 200 V. Gels were stained for 20 min with SYBR gold and desired gel pieces were excised and RNA was extracted as described before. For reverse transcription, RNA was resuspended in 10 µl 10 mM Tris-HCl pH 7.0 and 1 µl 10 mM dNTP (NEB), 1 µl 25 linker L1’L20 and 1.5µl DEPC H20 were added to each sample. Samples were incubated at 65°C for 5 min followed by addition of 4 µl 5x FSB buffer (Invitrogen), 1 µl murine RNase inhibitor, 1 µl 0.1 M DTT (Invitrogen) and 1 µl Superscript III (Invitrogen). Samples were incubated at 50°C for 30 min and afterward 2.3 µl 1 N NaOH was added to hydrolyze RNA and samples were further incubated at 95C°for 15 min. Samples were run on a 10% TBE-Urea polyacrylamide gel for 70 min at 200 V. Gels were stained as described before and desired bands were excised and nucleic acids were extracted as mentioned earlier but using Tris-HCl pH 8.0 and precipitating nucleic acids by adding 32 µl 5 M NaCl, 1 µl 0.5 M EDTA, 2 µl glycoblue and 0.55 µl isopropanol. For circularization, DNA was resuspended in 15 µl 10 mM Tris-HCl pH 8.0 and 2 µl 10x CircLigase buffer (EPICENTRE), 1 µl 1mMATP, 1 µl 50mMMnCl2 and 1 µl CircLigaseTM (EPICENTRE) were added. Samples were incubated at 60°C for 1 hr. Addition of 1 µl CircLigaseTM was repeated and samples were incubated for another hour at 60°C. Afterward, the enzyme was inactivated by incubating 10 min at 80°C. 5 µl of circularized DNA was used for PCR amplification. Therefore, 16.7 µl 5x HF buffer, 1.7 µl 10 mMdNTPs, 0.4 µl 100 mMPCR primer L1’, 0.4 µl 100 mMbarcoding primer, 59.2 µl DEPC H20 and 0.8 µl HF Phusion (NEB) were added. 17 µl PCR mix were aliquoted to 4 separate PCR tubes and the following PCR reaction cycles were run: 1.) 98°C, 30 s; 2.) 98°C, 10 s; 3.) 60°C, 10 s; 4.) 72°C, 5 s. Steps 2 through 4 were repeated ten times and one tube was removed after cycles 7-13. Samples were run on a 8% TBE polyacrylamide gel (Invitrogen) in 1x TBE (Ambion) for 45 min at 180 V. Gels were stained as mentioned before and desired bands were excised and DNA was extracted as described before. After a quality control step using a high sensitivity bioanalyzer chip (Agilent), samples were sequenced on a HiSeq 2000 (Illumina).
Data analysis
Sequenced reads were processed as previously described 10 using standard trimming and genome alignment tools (Cutadapt, Bowtie2, Tophat2) and python scripts adapted to S. cerevisiae. SeRP analyses are based on at least two independent biological replicates that were highly reproducible, as evaluated by Pearson correlation analysis of each gene profile, see details below.
Ratio-based enrichment profiles analysis
The ratio-based enrichment profiles were built by comparing the RPM (reads per million mapped reads) interactome and translatome data at each nucleotide along the ORFs. The reproducibility of replicates of interaction profiles was evaluated by Pearson correlation analysis. If a threshold of 0.6 was passed, genes were processed further.
To exclude genes that are expressed close to the background level or have a low read coverage, we defined minimal requirement thresholds that must be all passed before genes were considered for analysis: (i) at least 64 reads in both subunit-bound and total translatome datasets; (ii) at least 8 RPKM (reads per kilobase of transcript, per million mapped reads) in both translatome datasets; (iii) at least one position after the first 90 nucleotides in the subunit-bound translatome that has a twofold higher read number than the average of the first 90 nucleotides (designated 90 nucleotides background giving the specific background signal for every gene; for genes lacking any read in the 90 nucleotide background, the average read per nucleotide along the complete gene from the corresponding translatome is used).
Enrichment threshold: local footprint density over a sequence stretch of minimal 90 nucleotides must be at least twofold enriched at every position.
Metagene analysis
For metagene analyses genes were normalized to their expression level by dividing the read density of each nucleotide by the average read density per nucleotide of the respective gene. Replicates reproducibility of gene profiles was evaluated by Pearson correlation analysis. If a threshold of 0.6 was passed, genes were processed further.
The genes were aligned to the position of onset of co-translational complex assembly interactions, defined by the single codon position where the enrichment threshold (defined in the previous segment) was crossed for each gene.
Proteome-wide bioinformatics analysis of Ssb1 interplay with putative cotranslational complex assembly interactions
To determine the proteome-wide interplay of Ssb SeRP interaction profiles2 with cotranslational assembly interactions, we performed a bioinformatics analysis to identify all hetero-oligomeric complexes subunits that are putatively cotranslationally assembling, and their putative assembly onset positions.
For the analysis we have employed the following parameters, extrapolated from our experimental data:
Of all PDB-deposited structures of hetero-oligomeric complexes, we identified subunits harboring N′ terminal protein interface domains, located in the first 40% of genes, as our experimental dataset is disenriched for subunits harboring extreme C′-terminal ones.
Complexes involving interface domains smaller than 5 interacting residues were removed, as our experimental dataset was disenriched for this type of complex.
Complexes involving dedicated assembly chaperones/inhibitors were excluded, as our experimental dataset shows this type of complex is less likely to cotranslationally assemble.
We next identified ends of N′ terminal interfaces as assembly onset positions, as our experimental data shows most assembly onsets occur directly upon the emergence of an entire interface domain from the ribosome exit tunnel.
We used a geometric clustering algorithm (http://www.blopig.com/blog/2013/10/get-pdb-intermolecular-protein-contacts-and-interface-residues/ from the Oxford Protein Informatics Group) to identify the patches of interface atoms within each subunit. Atoms directly involved in protein-protein interfaces were defined by an intermolecular distance cutoff of 4.5Å, on the basis of previously published works 34–36.
Interface patch atoms were defined by an intramolecular distance cutoff of 10 Å, according to their Cα distances within the crystal component, on the basis of previously published works 34,35.
Interface patches size threshold: patches must include at least five interacting residues. Structures with resolution greater than10Å were removed from the analysis, in accordance with these defined interface parameters, as the cutoff of 10 Å could not be determined. Membrane protein complexes were removed from the analysis. Structures of truncated proteins, lacking their N′ terminal interfaces, were removed from our analysis.
We aligned all proteins to the position of putative onset of cotranslational complex assembly interactions: to the ends of N ′ terminal interfaces and performed a metagene profile of Ssb1 binding to this subset with Ssb1 SeRP experiments10.
ORFs with low Ssb1 SeRP foot-print coverage were removed from the analysis, using a threshold of 64 total counts per ORF in order to maintain significant reproducibility between SeRP independent biological replicates 10,36. The reproducibility of replicates of interaction profiles was evaluated by Pearson correlation analysis. If a threshold of 0.6 was passed, genes were processed further.
In total, 116 subunits were identified as putatively cotranslationally assembling.
Software and Algorithms
Bowtie2 v.2.2.5.0 (http://bowtie-bio.sourceforge.net/bowtie2/index.shtml). Tophat2 v.2.0.13 (http://ccb.jhu.edu/software/tophat/downloads/). Python v.2.7 and v.3.4 (https://www.python.org/downloads/).
Code availability
Customized python scripts for data analysis are available upon request.
Immunoblotting
Samples were dissolved in standard sample buffer and boiled at 95°C for 5 min. Samples were separated on SDS–PAGE gels (4–12% gradient), transferred to polyvinylidene fluoride membranes, and immunoblotted. The following antibodies were used: polyclonal rabbit FAS antibody16 (a gift from D. H. Wolf), polyclonal rabbit GFP antibody (antiserum from rabbit raised against YFP)37. Proteins were visualized by enhanced chemi-fluorescence reaction.
Imaging
Cells were grown in SC medium containing 2% glucose, 30°C to log phase. For anthranilate synthase subunits co-staining, cells were transferred to growth in SD lacking tryptophan for the last 30 min to induce their expression; similarly for carbamoyl phosphate synthetase subunits co-staining, cells were transferred to growth in SD lacking arginine, for the last 30 min to induce their expression.
Cells were fixed with 37% formaldehyde for 15 min, centrifuged at 1,200g for 12 min and resuspended in 4% paraformaldehyde and 100 mM KPO4 at room temperature for 1 hr.
High-sensitivity confocal imaging was performed on a Leica DMi8 spinning disk system with a Yokogawa CSU-X1 scanner unit. Images were acquired by using a HC PL APO 63×/1.40-0.60 oil objective lens (Leica), the Orca Flash 4.0 LT sCMOS camera (Hamamatsu, C11440-42U) and a quad band filter set and up to four diode laser lines (405 nm, 488 nm, 561 nm, 635 nm) with the MetaMorph Advanced Acquisition software (v .7.8.13.0, by Molecular devices LLC, was used for confocal imaging). Z-stacks (0.2-µm steps) images were acquired for the 488 nm channel. All further processing of acquired images was performed with ImageJ software. A maximal projection of ~3-5 Z-stacks is shown. For the purpose of subunit fused to GFP foci quantification, both manual and automated (“FindFoci” open-source plugin for ImageJ38) quantifications were performed. Approximately 150 cells were analyzed per sample with a total of three repetitions.
Quantitative PCR (qPCR) of pulled GFP tagged proteins
GFP Affinity purification
GFP Affinity purification was performed as described in above (see ‘Purification of RNCs for SeRP’), for immunoprecipitation samples, with the following changes: no RNaseI treatment was performed and the lysis buffer was supplemented with KCl to a final concentration of 500 mM. For puromycin treatment samples, the lysis buffer was first supplemented with puromycin (10µg ml; Invitrogen) and then added to the filtered cells. All subsequent lysis and immunoprecipitation steps were performed in the presence of puromycin. Samples were then directly subjected to phenol RNA extraction, as described 10.
Reverse Transcription
First strand cDNA synthesis for quantitative PCR (qPCR) was performed using the Superscript III First Strand RT PCR kit (Invitrogen). One microgram of isolated RNA was mixed with 5ng/µl random hexameric primers, 1mM dNTPs, adjusted to 10µl and incubated at 65°C for 10min and then chilled on ice. To the RNA-Primer mix a premixed cDNA synthesis mix was added (2µl 10× reverse transcription buffer, 4µl 25mM MgCl2, 2µl 100mM DTT, 20U RNAseOUT, 100U Superscript III). Reaction was incubated for 50min at 50°C in a water bath and terminated by heating the mix to 85°C for 5 min. After cooling on ice 0.5µl RNAse H were added and incubated at 37°C for 20 min. cDNA then was stored at -80°C or used directly for qPCR.
qPCR
qPCR was performed using the DyNAmo Flash SYBR Green qPCR Kit (Thermo Scientific) and a LightCycler 480 (Roche).
Reactions were pipetted in 384-well LightCycler480 multiwell plates (Roche). Per reaction 2.5µl of cDNA (in appropriate dilution) was mixed with 7.5µl reaction Master Mix (5µl Flash SYBR Green Mix, 1.7µl DEPC H2O, 0.4µl per primer (10 mM)) with a multistep pipette to reduce pipetting errors. For analysis the following program was used:
| Pre-incubation: | 95°C, 5min |
| Amplification: | 95°C, 10s |
| 55°C, 20s | |
| 72°C, 20s, single acquisition mode | |
| Melting curve: | 60°C – 90°C, 0.11 °C/s, continuous acquisition mode |
Cpvalues were calculated by derivation by the LightCycler480 software (Roche).
For normalization ACT1 mRNA was used as a housekeeping gene.
CHX chase and flow cytometry analysis
Yeast cells were grown to log phase, then CHX (0.5 mg/ml) was added, and aliquots from each time point were taken. GFP levels of fixed cells at each time point were determined by flow cytometry analysis performed using a BD FACS Canto II equipped with Lasers 405 nm, 488 nm, 635 nm. Detectors used: FSC, SSC, 488-E for GFP with filter 530/30. Cell population gated on FSC/SSC area dot plot, exclusion of debris and cell aggregates by SSC/FSC height and width. Twenty thousand events(cells)/sample. Data are from three biologically independent experiments.
Quantification and Statistical Analysis
Blinding or randomization was not used in any of the experiments. The number of independent biological replicates used for an experiment is indicated in the respective figure legends. The statistical tests and Pvalues used for the interpretation of data are mentioned in the figure legends.
Extended Data
Extended Data Figure 1. Functionality of GFP-tagged FAS complex subunits, characteristics of co- versus post-translational FAS subunit interactions and the FAS assembly model.

a, GFP tagging of the FAS complex subunits does not affect growth under fatty acid depletion conditions, as compared to wild-type (YPD, right compared to YPD + fatty acids, left). A representative image from three biologically independent experiments is shown. b, Immunoblotting of the FAS complex subunits in input, flow through and immunopurification fractions of a typical SeRP experiment analysing samples of strains encoding either GFP- tagged α or β subunits. Data are from three biologically independent experiments. c, Puromycin-induced release of nascent chains (10 µg/ml, 10 min post lysis) decreases the interaction of nascent α with the C-terminally tagged β subunit, analysed by immunopurification followed by RT-qPCR. Data are normalized mean mRNA levels ± s.e.m. with each data point from three biologically independent experiments. d, Polysome profiles of samples following puromycin (puro) treatment (as in c) or CHX treatment. Data representative of three biologically independent experiments are shown. e, Post-lysis binding control: experimental scheme. Two independent cultures, of two strains, expressing either wild-type α subunit and C-terminally GFP- tagged β subunit; or wild-type β subunit and C-terminally TAP-tagged α subunit, were grown to log phase, OD600 nm 0.5. The cells were then mixed in a 1:1 ratio and subsequently lysed, subjected to GFP immunopurification and SeRP. f, Predicted SeRP engagement of nascent wild-type α or α-TAP ORF, by C-terminally GFP tagged β subunit. No post-lysis interactions: no detection of ribosome protected footprints of mRNA encoding TAP (top). Post-lysis interactions: detection of ribosome protected footprints of TAP-encoding mRNA at a similar level to wild-type α subunit ORF (bottom). g, Results of post-lysis binding control: engagement of nascent wild-type α or α-TAP by C-terminally GFP tagged β subunit, analyzed by SeRP, as in Fig.1. Data are from two biologically independent experiments. h, Model of the FAS complex assembly pathway.
Extended Data Figure 2. Functionality of GFP-tagged multi-aminoacyl-tRNA synthetase complex subunits and the assembly model.

a, GFP tagging of the essential multi-aminoacyl-tRNA synthetase complex subunits does not affect growth, as compared to wildtype (YPD). A representative image from three biologically independent experiments is shown. b, Model of the multi-aminoacyl-tRNA synthetase complex assembly pathways.
Extended Data Figure 3. Cotranslational assembly of the anthranilate synthase complex.

a, Domain organization of the anthranilate synthase subunits. b, Engagement of nascent Trp2p (tryptophan 2) and Trp3p (tryptophan 3) by C-terminally-tagged Trp2p subunit (top) compared to engagement of nascent Trp2p and Trp3p by C-terminally-tagged Trp3p subunit (bottom), analysed by SeRP. Data are from two biologically independent experiments. Coloured numbers indicate ribosome positions where the enrichment stably crosses the twofold threshold. The area between replicates is shaded, indicating the degree of experimental variation. c, Crystal structure of the homologous anthranilate synthase complex from the archaea Sulfolobus Solfataricus (~60% sequence similarity, PDB: 1QDL1). d, GFP tagging of the complex subunits does not affect cell growth under tryptophan depletion conditions (YPD, right panel compared to SD lacking tryptophan, left). A representative image from three biologically independent experiments is shown. e, Model of the anthranilate synthase assembly pathway.
Extended Data Figure 4. Cotranslational assembly of the phosphofructokinase complex.

a, Domain organization of the phosphofructokinase (PFK) subunits. b, Engagement of nascent α and β by C-terminally tagged α subunit (top) compared to engagement of nascent α and β by C-terminally tagged β subunit (bottom), analysed by SeRP. Data are from two biologically independent experiments. Coloured numbers indicate ribosome positions when the enrichment stably crosses the twofold threshold. The area between replicates is shaded, indicating the degree of experimental variation. c, Top, crystal structure of the S. cerevisiae PFK complex (PDB: 3O8O2). Bottom, crystal structure of the highly homologous (~75% sequence similarities) Pichia pastoris (also known as Komagataella pastoris) PFK complex, PDB: 3OPY3. Boxed: the N`- terminal glyoxalase I-like interface domains of α and β. This domain is missing in the S. cerevisiae structure, as the first 200aa of each subunit, containing this domain were cleaved before crystallization. d GFP tagging of the complex subunits does not affect cell growth with glucose as carbon source (YPD). A Representative of 3 biologically independent experiments is shown. e, Model of PFK assembly pathways.
Extended Data Figure 5. Aggregation and degradation propensity of individual complex subunits.

a, Stability of individual complex subunits, tagged by GFP, determined by CHX chase, in wild-type and in deletion strains expressing orphan complex subunit. Cells with GFP fluorescence were analysed by FACS. Mean GFP fluorescence ± s.e.m are presented with each data point from three biologically independent experiments overlaid. In each experiment, 20,000 events were recorded. **P=0.0253, two tailed t-test. b, Solubility of individual complex subunits, tagged by GFP, determined by localization patterns changes, in wild-type and in deletion strains expressing orphan complex subunit. Log-phase cells (30°C) were fixed and analyzed by confocal microscopy. A representative image is shown. Scale bar 4µm (left panel). The fraction of cells displaying foci of GFP-tagged subunit per cell was quantified (right panel) (n=155 cells/sample; for 3 biologically independent experiments). The mean and SEM are presented, overlaid with each data point. c, Subunit aggregation is complex-specific. Solubility of the Naa15-GFP subunit of the NatA complex in trp2∆ mutant cells deleted for the Trp2 subunit of the TRP complex, analysed as in b. (n=155 cells/sample; from three biologically independent experiments). Data are mean ± s.e.m. overlaid with each data point. ** P=1.367248 × 10 −11 (middle) and P=7.850135 × 10 −10 of a (lower panel) of a two tailed t-test. d, Characteristics of cotranslational complex assembly interactions. Left, zoom-in on the first 400 codons, displaying the onset and persistence of cotranslational interaction of each subunit with its partner subunit or subunits, for all 14 subunits identified as cotranslationally engaged. Right, the corresponding normalized length of each ORF at the onset of cotranslational interactions with partner subunits, demonstrating the length variability at the onset position.
Extended Data Figure 6. Proteome wide bioinformatics analysis of Ssb1 interplay with putative onset of cotranslational assembly interactions.

a, Metagene analysis of Ssb1–GFP interaction profiles with the nascent chains of 116 yeast proteins identified as putative cotranslationally assembling subunits (putative assembly identification algorithm and parameters detailed in the Supplementary Information). The dark grey line indicates Ssb interaction profiles4, aligned to the subunits putative onset of cotranslational subunit association positions depicted as 0 (onset position alignment). A zoomed-in view of the nascent-chain segments at assembly onset position ±75 amino acids is shown. The orange line indicates Ssb binding profiles for nascent chains aligned to random positions along the ORFs. Data are from two biologically independent experiments. The area between replicates is shaded, indicating the degree of experimental variation. There is no correlation detected between the random and onset position alignment (Pearson correlation r2=0.2911), thus Ssb depletion at positions of onset is significant. b, Average Kyte-Doolittle hydrophobicity plot (7-amino-acid-window) of the 116 nascent-chain segments. A zoomed-in view of the nascent-chain segments at assembly onset position ±75 amino acids is shown, as in a.
Extended Data Figure 7. Cotranslational interactions networks of FAS β, Cpa2 and PFK β metabolic enzymes subunits, analysed by SeRP.

a, Fatty acid synthesis metabolic pathway: nascent Faa1 is not engaged by C-terminally-tagged FAS complex β subunit, while nascent Acc1 shows a transient interaction, crossing the twofold enrichment threshold, at position approximately 250 codons/amino acids (indicated by an arrow). b, Arginine biosynthetic pathway: nascent Arg4 (argininosuccinate lyase) is not engaged by C-terminally-tagged Cpa2 subunit, whereas nascent Arg1 shows several transient interactions crossing the twofold enrichment threshold, at positions indicted by arrows. c, Glycolysis pathway: nascent Fba1 (fructose 1,6-bisphosphate aldolase) is not engaged by C-terminally tagged PFK complex β subunit, while Pyc2 (pyruvate carboxylase isoform) shows several transient interactions crossing the twofold enrichment threshold, at positions indicted by arrows. a-c, Data are from two biologically independent experiments. The area between replicates is shaded, indicating the degree of experimental variation.
Extended Data Figure 8. Model of cotranslational folding and assembly of complex subunits.

a, Nascent chains emerging from the ribosome exit tunnel are first engaged by ribosome-associated chaperones. Upon emergence of a complete interaction domain the nascent chain is engaged by its complex partner subunit. This engagement remains stable throughout the rest of the ORF translation. b, The nascent-chain amino acid composition at the ribosome exit tunnel may direct the interplay between Ssb and partner subunit association. High hydrophobicity and positively charged amino acids (aa) are engaged by Ssb; low hydrophobicity disfavors binding of Ssb at the onset of subunit association, allowing for folding of the interaction domain and subunit joining. c, Modes of cotranslational assembly: most complexes are assembled in a unidirectional manner, in which one dedicated, fully synthesized subunit engages its nascent partner. d, Diverging misfolding propensities of complex subunits: subunits engaged as nascent chains are prone to misfolding, whereas their partner subunits are generally more stable.
Extended Data Table 1.
Characteristics of the selected complexes in S. cerevisiae.
*Indicates the number indicates unique subunits analysed in the study. The total number of subunits in the complex, including repeating subunits, is shown in brackets.
| Complex | Function | Nr. of Subunits* | |
|---|---|---|---|
| 1 | Fatty Acid Synthase | Fatty acid synthesis | 2 (α6β6) |
| 2 | Aminoacyl-tRNA Synthetase complex | Translation | 3 |
| 3 | N-acetyltransferase A | Acetylation | 2 |
| 4 | N-acetyltransferase B | Acetylation | 2 |
| 5 | Anthranilate Synthase | Tryptophan biosynthesis | 2 |
| 6 | Carbamoyl Phosphate Synthetase | Arginine biosynthesis | 2 |
| 7 | Phosphofructokinase | Glycolysis | 2 (α4β4) |
| 8 | Translation Initiation Factor elF2 | Translation | 3 (α,β,γ) |
| 9 | Nascent Chain Associated chaperone Complex (NAC) | Protein folding | 2 |
| 10 | RiboNucleotide Reductase sub-complex RNR2,4 | dNTP synthesis | 2 |
| 11 | V-type ATPase-Peripheral sub-complex, the catalytic core hexamer | Vacuolar membrane ATPase complex | 2 (A3,B3) |
| 12 | 20S Proteasome sub-complex, α1,2 subunits | Degradation | 2 (α1-6, β1-6) |
Extended Data Table 2.
Characteristics of cotranslationally assembling subunits—directionality and aggregation propensities in ssb1/2Δ.
N.D, not detected.
| Complex | Bait Subunit | Nascent Polypeptide engaged | Aggregation propensity in Δssb1/2 | |
|---|---|---|---|---|
| 1 | Fatty Acid Synthase | β | α | α,β |
| 2 | Aminoacyl-tRNA Synthetase | GluRSp, Arc1 p, MetRSp | GluRSp, Arc1 p, MetRSp | GluRSp, Arc1 p, MetRSp |
| 3 | N-acetyltransferase A | Naa10 | Naa15 | Naa10,15 |
| 4 | N-acetyltransferase B | Naa25 | Naa20 | N.D |
| 5 | Anthranilate Synthase | Trp2p | Trp3p | Trp2p |
| 6 | Carbamoyl Phosphate synthetase A | Cpa2p | Cpalp, Cpa2p | N.D |
| 7 | Phosphofructokinase | α, β | α, β | α, β |
| 8 | Translation Initiation Factor elF2 | γ | β | γ, β |
| 9 | Nascent chain Associated Complex | α, β | α, β | N.D |
| 10 | V-type ATPase-Peripheral sub-complex; Vma1,2 | N.D | N.D | Vma1,2 |
| 11 | RiboNucleotide Reductase sub-complex RNR2,4 | N.D | N.D | RNR2 |
| 12 | 20S proteasome; α 1,2 subunits | N.D | N.D | α 1,2 |
Supplementary Material
Extended Data and Supplementary Information are available in the paper online version.
Acknowledgements
We thank members of the Bukau laboratoryfor discussions, D.H. Wolf for FAS antisera and the DKFZ Core facility for sequencing. This work was supported by ERC Advanced grant (743118), SFB1036 and Alexander von Humboldt fellowship to A.S.
Footnotes
Author Contributions A.S, G.K. and B.B. conceived the study and designed the experiments. A.S., K.D., U.F, K.K, D.M and M.Z performed the experiments. A.S, K.D., U.F, K.K, D.M, M.Z, F.T, G.K., and B.B. analyzed the data. A.S, G.K. and B.B. wrote the manuscript with input from all authors.
The authors declare no competing financial interests.
Author Information Reprints and permissions information is available at www.nature.com/reprints.
Data availability
The data supporting the findings of this study have been deposited in the Gene Expression Omnibus (GEO) repository with the accession code: GSE116570. All other data are available from the corresponding authors upon reasonable request. Figure 4 and extended data figure 6 rely also on raw data derived from the data set of Ssb1 SeRP experiments, accession code: GSE93830.
References
- 1.Balchin D, Hayer-Hartl M, Hartl FU. In vivo aspects of protein folding and quality control. Science. 2016;353:aac4354. doi: 10.1126/science.aac4354. [DOI] [PubMed] [Google Scholar]
- 2.Gloge F, Becker AH, Kramer G, Bukau B. Co-translational mechanisms of protein maturation. Current opinion in structural biology. 2014;24:24–33. doi: 10.1016/j.sbi.2013.11.004. [DOI] [PubMed] [Google Scholar]
- 3.Benschop JJ, et al. A consensus of core protein complex compositions for Saccharomyces cerevisiae. Molecular cell. 2010;38:916–928. doi: 10.1016/j.molcel.2010.06.002. [DOI] [PubMed] [Google Scholar]
- 4.Shieh YW, et al. Operon structure and cotranslational subunit association direct protein assembly in bacteria. Science. 2015;350:678–680. doi: 10.1126/science.aac8171. [DOI] [PubMed] [Google Scholar]
- 5.Le Tallec B, et al. 20S proteasome assembly is orchestrated by two distinct pairs of chaperones in yeast and in mammals. Molecular cell. 2007;27:660–674. doi: 10.1016/j.molcel.2007.06.025. [DOI] [PubMed] [Google Scholar]
- 6.Smardon AM, Tarsio M, Kane PM. The RAVE complex is essential for stable assembly of the yeast V-ATPase. The Journal of biological chemistry. 2002;277:13831–13839. doi: 10.1074/jbc.M200682200. [DOI] [PubMed] [Google Scholar]
- 7.Meurisse J, et al. Hug1 is an intrinsically disordered protein that inhibits ribonucleotide reductase activity by directly binding Rnr2 subunit. Nucleic acids research. 2014;42:13174–13185. doi: 10.1093/nar/gku1095. [DOI] [PMC free article] [PubMed] [Google Scholar]
- 8.Pfund C, Huang P, Lopez-Hoyo N, Craig EA. Divergent functional properties of the ribosome-associated molecular chaperone Ssb compared with other Hsp70s. Molecular biology of the cell. 2001;12:3773–3782. doi: 10.1091/mbc.12.12.3773. [DOI] [PMC free article] [PubMed] [Google Scholar]
- 9.Becker AH, Oh E, Weissman JS, Kramer G, Bukau B. Selective ribosome profiling as a tool for studying the interaction of chaperones and targeting factors with nascent polypeptide chains and ribosomes. Nature protocols. 2013;8:2212–2239. doi: 10.1038/nprot.2013.133. [DOI] [PMC free article] [PubMed] [Google Scholar]
- 10.Doring K, et al. Profiling Ssb-Nascent Chain Interactions Reveals Principles of Hsp70-Assisted Folding. Cell. 2017;170:298–311 e220. doi: 10.1016/j.cell.2017.06.038. [DOI] [PMC free article] [PubMed] [Google Scholar]
- 11.Leibundgut M, Jenni S, Frick C, Ban N. Structural basis for substrate delivery by acyl carrier protein in the yeast fatty acid synthase. Science. 2007;316:288–290. doi: 10.1126/science.1138249. [DOI] [PubMed] [Google Scholar]
- 12.Gipson P, et al. Direct structural insight into the substrate-shuttling mechanism of yeast fatty acid synthase by electron cryomicroscopy. Proc Natl Acad Sci U S A. 2010;107:9164–9169. doi: 10.1073/pnas.0913547107. [DOI] [PMC free article] [PubMed] [Google Scholar]
- 13.Hansen WJ, Lingappa VR, Welch WJ. Complex environment of nascent polypeptide chains. The Journal of biological chemistry. 1994;269:26610–26613. [PubMed] [Google Scholar]
- 14.Cherkasov V, et al. Systemic control of protein synthesis through sequestration of translation and ribosome biogenesis factors during severe heat stress. FEBS letters. 2015;589:3654–3664. doi: 10.1016/j.febslet.2015.10.010. [DOI] [PubMed] [Google Scholar]
- 15.Duttler S, Pechmann S, Frydman J. Principles of cotranslational ubiquitination and quality control at the ribosome. Molecular cell. 2013;50:379–393. doi: 10.1016/j.molcel.2013.03.010. [DOI] [PMC free article] [PubMed] [Google Scholar]
- 16.Schuller HJ, Fortsch B, Rautenstrauss B, Wolf DH, Schweizer E. Differential proteolytic sensitivity of yeast fatty acid synthetase subunits alpha and beta contributing to a balanced ratio of both fatty acid synthetase components. Eur J Biochem. 1992;203:607–614. doi: 10.1111/j.1432-1033.1992.tb16590.x. [DOI] [PubMed] [Google Scholar]
- 17.Scazzari M, Amm I, Wolf DH. Quality control of a cytoplasmic protein complex: chaperone motors and the ubiquitin-proteasome system govern the fate of orphan fatty acid synthase subunit Fas2 of yeast. The Journal of biological chemistry. 2015;290:4677–4687. doi: 10.1074/jbc.M114.596064. [DOI] [PMC free article] [PubMed] [Google Scholar]
- 18.Karanasios E, Simader H, Panayotou G, Suck D, Simos G. Molecular determinants of the yeast Arc1p-aminoacyl-tRNA synthetase complex assembly. Journal of molecular biology. 2007;374:1077–1090. doi: 10.1016/j.jmb.2007.10.010. [DOI] [PubMed] [Google Scholar]
- 19.Koehler C, Round A, Simader H, Suck D, Svergun D. Quaternary structure of the yeast Arc1p-aminoacyl-tRNA synthetase complex in solution and its compaction upon binding of tRNAs. Nucleic acids research. 2013;41:667–676. doi: 10.1093/nar/gks1072. [DOI] [PMC free article] [PubMed] [Google Scholar]
- 20.Simader H, et al. Structural basis of yeast aminoacyl-tRNA synthetase complex formation revealed by crystal structures of two binary sub-complexes. Nucleic acids research. 2006;34:3968–3979. doi: 10.1093/nar/gkl560. [DOI] [PMC free article] [PubMed] [Google Scholar]
- 21.Frechin M, et al. Expression of nuclear and mitochondrial genes encoding ATP synthase is synchronized by disassembly of a multisynthetase complex. Molecular cell. 2014;56:763–776. doi: 10.1016/j.molcel.2014.10.015. [DOI] [PubMed] [Google Scholar]
- 22.Hannig EM, Cigan AM, Freeman BA, Kinzy TG. GCD11, a negative regulator of GCN4 expression, encodes the gamma subunit of eIF-2 in Saccharomyces cerevisiae. Molecular and cellular biology. 1993;13:506–520. doi: 10.1128/mcb.13.1.506. [DOI] [PMC free article] [PubMed] [Google Scholar]
- 23.Polevoda B, Cardillo TS, Doyle TC, Bedi GS, Sherman F. Nat3p and Mdm20p are required for function of yeast NatB Nalpha-terminal acetyltransferase and of actin and tropomyosin. The Journal of biological chemistry. 2003;278:30686–30697. doi: 10.1074/jbc.M304690200. [DOI] [PubMed] [Google Scholar]
- 24.Bhushan S, et al. alpha-Helical nascent polypeptide chains visualized within distinct regions of the ribosomal exit tunnel. Nature structural & molecular biology. 2010;17:313–317. doi: 10.1038/nsmb.1756. [DOI] [PubMed] [Google Scholar]
- 25.Gautschi M, Mun A, Ross S, Rospert S. A functional chaperone triad on the yeast ribosome. Proc Natl Acad Sci U S A. 2002;99:4209–4214. doi: 10.1073/pnas.062048599. [DOI] [PMC free article] [PubMed] [Google Scholar]
- 26.Gumiero A, et al. Interaction of the cotranslational Hsp70 Ssb with ribosomal proteins and rRNA depends on its lid domain. Nat Commun. 2016;7 doi: 10.1038/ncomms13563. 13563. [DOI] [PMC free article] [PubMed] [Google Scholar]
- 27.Willmund F, et al. The cotranslational function of ribosome-associated Hsp70 in eukaryotic protein homeostasis. Cell. 2013;152:196–209. doi: 10.1016/j.cell.2012.12.001. [DOI] [PMC free article] [PubMed] [Google Scholar]
- 28.Gavin AC, et al. Proteome survey reveals modularity of the yeast cell machinery. Nature. 2006;440:631–636. doi: 10.1038/nature04532. [DOI] [PubMed] [Google Scholar]
- 29.Duncan CD, Mata J. Widespread cotranslational formation of protein complexes. Plos Genet. 2011;7:e1002398. doi: 10.1371/journal.pgen.1002398. [DOI] [PMC free article] [PubMed] [Google Scholar]
- 30.Halbach A, et al. Cotranslational assembly of the yeast SET1C histone methyltransferase complex. The EMBO journal. 2009;28:2959–2970. doi: 10.1038/emboj.2009.240. [DOI] [PMC free article] [PubMed] [Google Scholar]
- 31.Sakahira H, Nagata S. Co-translational folding of caspase-activated DNase with Hsp70, Hsp40, and inhibitor of caspase-activated DNase. The Journal of biological chemistry. 2002;277:3364–3370. doi: 10.1074/jbc.M110071200. [DOI] [PubMed] [Google Scholar]
- 32.Janke C, et al. A versatile toolbox for PCR-based tagging of yeast genes: new fluorescent proteins, more markers and promoter substitution cassettes. Yeast. 2004;21:947–962. doi: 10.1002/yea.1142. [DOI] [PubMed] [Google Scholar]
- 33.Esmaielbeiki R, Krawczyk K, Knapp B, Nebel JC, Deane CM. Progress and challenges in predicting protein interfaces. Brief Bioinform. 2016;17:117–131. doi: 10.1093/bib/bbv027. [DOI] [PMC free article] [PubMed] [Google Scholar]
- 34.Cazals F, Proust F, Bahadur RP, Janin J. Revisiting the Voronoi description of protein-protein interfaces. Protein Sci. 2006;15:2082–2092. doi: 10.1110/ps.062245906. [DOI] [PMC free article] [PubMed] [Google Scholar]
- 35.Janin J, et al. CAPRI: a Critical Assessment of PRedicted Interactions. Proteins. 2003;52:2–9. doi: 10.1002/prot.10381. [DOI] [PubMed] [Google Scholar]
- 36.Ingolia NT, Ghaemmaghami S, Newman JR, Weissman JS. Genome-wide analysis in vivo of translation with nucleotide resolution using ribosome profiling. Science. 2009;324:218–223. doi: 10.1126/science.1168978. [DOI] [PMC free article] [PubMed] [Google Scholar]
- 37.Haslberger T, et al. Protein disaggregation by the AAA+ chaperone ClpB involves partial threading of looped polypeptide segments. Nature structural & molecular biology. 2008;15:641–650. doi: 10.1038/nsmb.1425. [DOI] [PubMed] [Google Scholar]
- 38.Herbert AD, Carr AM, Hoffmann E. FindFoci: a focus detection algorithm with automated parameter training that closely matches human assignments, reduces human inconsistencies and increases speed of analysis. PLoS One. 2014;9:e114749. doi: 10.1371/journal.pone.0114749. [DOI] [PMC free article] [PubMed] [Google Scholar]
Associated Data
This section collects any data citations, data availability statements, or supplementary materials included in this article.