

Abstract
Diabetes mellitus (DM) during pregnancy has long-lasting implications for the fetus, including cardiovascular morbidity. Previously, we showed that endothelial colony forming cells (ECFCs) from DM human pregnancies have decreased vasculogenic potential. Here, we evaluate whether the molecular mechanism responsible for this phenotype involves the transcription factor, Mesenchyme Homeobox 2 (MEOX2). In human umbilical vein endothelial cells, MEOX2 upregulates cyclin-dependent kinase inhibitor expression, resulting in increased senescence and decreased proliferation. We hypothesized that dysregulated MEOX2 expression in neonatal ECFCs from DM pregnancies decreases network formation through increased senescence and altered cell cycle progression. Our studies show that nuclear MEOX2 is increased in ECFCs from DM pregnancies. To determine if MEOX2 is sufficient and/or required to induce impaired network formation, MEOX2 was overexpressed and depleted in ECFCs from control and DM pregnancies, respectively. Surprisingly, MEOX2 overexpression in control ECFCs resulted in increased network formation, altered cell cycle progression, and increased senescence. In contrast, MEOX2 knockdown in ECFCs from DM pregnancies led to decreased network formation, while cell cycle progression and senescence were unaffected. Importantly, migration studies demonstrated that MEOX2 overexpression increased migration, while MEOX2 knockdown decreased migration. Taken together, these data suggest that altered migration may be mediating the impaired vasculogenesis of ECFCs from DM pregnancies. While initially believed to be maladaptive, these data suggest that MEOX2 may serve a protective role, enabling increased vessel formation despite exposure to a DM intrauterine environment.
According to the Center for Disease Control’s National Diabetes Statistics Report for 2014, 29 million Americans have diabetes mellitus (DM). In 2012, there were 1.7 million newly diagnosed DM cases, demonstrating that the occurrence of this disease continues to increase at an alarming rate (Centers for Disease Control and Prevention, 2014). DM in women of childbearing years is of particular concern. As many as 10% of pregnancies are complicated by DM (Buchanan et al., 2012). Hyperglycemia poses a risk to not only afflicted mothers, but to their children as well. Fetal exposure to DM in utero can lead to a multitude of adverse fetal effects that are immediately recognized upon delivery including congenital anomalies, macrosomia, and hypoglycemia (Hay, 2012). Additionally, compelling evidence demonstrate that adverse outcomes can extend far beyond the neonatal period including increased risk of developing the metabolic syndrome, insulin resistance, type 2 DM, obesity, and high blood pressure (Pettitt et al., 1983, 1988; Martin et al., 1985; Charles et al., 1994; Silverman et al., 1998; Cho et al., 2000; Gillman et al., 2003; Armitage et al., 2005; Boney et al., 2005; Schaefer-Graf et al., 2005; Fetita et al., 2006). Furthermore, exposure to multiple adverse intrauterine conditions can lead to diseases later in life (Hofman and Cutfield, 2006; Simeoni and Barker, 2009; Ghulmiyyah et al., 2011; Reichetzeder et al., 2016). Impaired functions of stem and progenitor cells may contribute to the pathogenesis of these chronic conditions (Ingram et al., 2008).
While it is becoming appreciated that exposure to the DM milieu in utero can result in long-term health consequences, the specific mechanisms behind these pathologies remain largely unknown. Individuals with DM are at an increased risk of developing cardiovascular complications (Winer and Sowers, 2004), which is often preceded by endothelial dysfunction (Avogaro et al., 2011; Hoffman, 2014). It is therefore plausible that many of the cardiovascular complications experienced by children of DM mothers arise from an inability to maintain vascular health. To examine this hypothesis, an endothelial progenitor population involved in angiogenesis and vasculogenesis, endothelial colony forming cells (ECFCs) were studied. Previous studies from our lab showed that ECFCs from DM pregnancies are dysfunctional. These cells display both increased senescence and decreased proliferation in vitro. Further, DM-exposed ECFCs also exhibit impaired vessel formation both in vitro and in vivo (Ingram etal., 2008). While it is evident that ECFCs isolated from cord blood have extensive proliferative capacity and vasculogenic properties, the mechanisms responsible for these phenotypes remain largely unknown.
Due to the numerous long-term adverse effects of intrauterine exposure to DM, a critical need exists to better understand the regulators of this pathophysiological phenotype. One potential protein of interest is Mesenchymal Homeobox 2 (MEOX2). MEOX2 is a transcription factor that is expressed in all cells of the cardiovascular system (Gorski and Walsh, 2003). When overexpressed in human umbilical vein endothelial cells (HUVECs), MEOX2 upregulates expression of the cyclin-dependent kinase inhibitors p16 and p21 (Gorski and Leal, 2003; Chen et al., 2007; Douville et al., 2011). Increased MEOX2 expression also enhances senescence (Douville et al., 2011) and decreases proliferation (Gorski and Leal, 2003). Given that ECFCs from DM pregnancies exhibit increased senescence and reduced vasculogenesis, we tested whether MEOX2 has an important role in contributing to these abnormal phenotypes.
Materials and Methods
Umbilical cord blood collection
Following informed consent, umbilical cord blood samples were collected from healthy pregnancies and pregnancies complicated by types 1 and 2 DM. All pregnancies were singleton gestations. Women with preeclampsia, hypertension, or other illnesses known to affect glucose metabolism were excluded. Infants born with identified chromosomal abnormalities were excluded. This protocol was approved by the Institutional Review Board at the Indiana University School of Medicine.
Cell culture
ECFCs were cultured from the umbilical cord blood by the Angio BioCore at the Indiana University Simon Cancer Center as previously described (Ingram et al., 2008). Early passage ECFCs (<passage 6) were used for experiments. For routine culture, ECFCs were grown in Endothelial Growth Media 2 (EGM2) (Lonza, Walkersville, MD) containing an additional 10% fetal calf serum (FCS) (Atlanta Biologicals, Flowery Branch, GA) and antibiotic-antimycotic solution (Corning, Manassas, VA). HeLa (ATCC Cat# CCL-2, RRID: CVCL_0030) and Lenti-X 293T cells (ATCC Cat# CRL11270, RRID: CVCL_4401) were cultured in Dulbecco’s Modified Eagle Medium (DMEM) (Corning) containing 10% FCS and antibiotic-antimycotic solution.
Western blotting
Nuclear lysates were obtained using the NE-PER Nuclear and Cytoplasmic Extraction Reagents Kit (ThermoFisher, Waltham, MA). Equal amounts of lysate were loaded on precast 4–12% bis-tris gels (Life Technologies, Grand Island, NY), separated by SDS-PAGE, and transferred to nitrocellulose membranes (BioRad, Hercules, CA). Membranes were immunoblotted with the following primary antibodies: mouse anti-Lamin A/C (Cell Signaling Technology, Danvers, MA Cat# 2032, RRID: AB_2136278), mouse anti-MEOX-2 [JJ-7] (Santa Cruz Biotechnology, Dallas, TX Cat# sc-81971, RRID: AB_1126131), rabbit anti-CDKN2A/p16INK4a [EP4353Y3] (Abcam, Cambridge, UK) (Abcam Cat# ab81278, RRID: AB_1640753), rabbit anti-SP-1 (Cell Signaling Technology Cat# 5931, RRID: AB_10621245). Membranes were incubated in secondary antibodies conjugated to horseradish peroxidase (BioRad). Blots were developed with Supersignal West Femto (ThermoFisher), exposed to film, and compiled in Photoshop CS6 (Adobe Photoshop CS6, RRID: SCR_014199). Band intensity was quantified using ImageJ 1.45s (ImageJ, RRID: SCR_003070).
Generation of lentivirus encoding MEOX2 cDNA and short hairpin (sh) MEOX2 constructs
The lentiviral vector plasmid (pUC2CL6IPwo), packaging accessory plasmids (pCD/NL2 and pCD/NL-BH), and envelope plasmid (pVSVG) were generous gifts from Helmut Hanenberg (Heinrich Heine University School of Medicine, Düsseldorf, Germany) (Gavvovidis et al., 2012; Blue et al., 2014). MEOX2 cDNA (RC501948, OriGene Technologies, Inc., Rockville, MD) was subcloned into pUC2CL6IPwo. The lentiviral vector plasmid (pGIPZ) containing an shMEOX2 construct was obtained from GE Dharmacon (Lafayette, CO) (RHS4430–200162184; Clone ID: V2LHS_207280). Both lentiviral vectors contain a puromycin resistance cassette, which enabled selection of transduced cells. Lentiviral particles were produced by transfection of Lenti-X 293T cells with the appropriate lentiviral vector (1.16 μg/ml), a packaging accessory plasmid (1.16 μg/ml), and a VSVG envelope plasmid (1.67 μg/ml) using Fugene 6 (Roche Applied Science, Indianapolis, IN). The pUC2CL6IPwo vector required the use of the pCD/NL2 packaging plasmid, while the pGIPZ vector was tat-dependent and required the pCD/NL-BH packaging plasmid. Lentiviral supernatants were collected, and filtered through a 0.45-μm asymmetric polyethersulfone filter unit (ThermoFisher). Supernatants were used immediately or stored at —80°C for future use.
Lentiviral transduction of ECFCs
ECFCs were plated at 250,000 cells per dish in 100 mm type I collagen-coated tissue culture dishes. The following day, lentiviral supernatant was added to each dish at dilutions of 1:2–1:10. The media was changed 24 h after transduction, and cells were incubated overnight at 37°C. Transduced cells were selected in media containing 1 μg/ml puromycin (ThermoFisher) for 2 days. MEOX2 expression was evaluated by Western blotting to confirm overexpression or knockdown.
siRNA transfection
ECFCs from diabetic pregnancies were transfected with short-interfering RNAs (siRNAs) (20 μM) using Lipofectamine RNAiMAX (ThermoFisher) according to the manufacturer’s instructions. ECFCs were transfected with either a non targeting smart-pool siRNA (siControl) (D-001810–10-05, ON-TARGETplus, GE Dharmacon) or human MEOX2 siRNA (siMEOX2) (J-012176–08, ON-TARGETplus, GE Dharmacon). Media was changed after 24 h. Cells were passaged 48 h following transfection and plated for cell-cycle analysis, matrigel network formation, and transwell migration assays. MEOX2 expression was examined by Western blotting to confirm knockdown 3 days following transfection.
Flow cytometric analysis of p16 expression
ECFCs were harvested using trypsin (Corning), and permeabilized and fixed with Cytofix/Cytoperm (BD Biosciences, San Jose, CA). Cells were stained with the PE mouse anti-p16 (BD Biosciences Cat# 556561, RRID:AB_396465), and analyzed on an LSRII (Becton Dickinson, San Jose, CA) in the Indiana University Simon Cancer Center Flow Cytometry Core. HeLa cells, which have detectable levels of p16 at baseline, were used as a positive control. A minimum of 10,000 events was recorded per sample. Mean fluorescence intensity was quantified using FlowJo Single Cell Analysis Software vX.0.6 (FlowJo, RRID: SCR_008520).
Senescence assays
ECFCs were plated in type I collagen-coated six-well tissue culture plates at 10,000 cells per well. After 3 days, senescence-associated β-galactosidase staining was performed as previously described (Blue et al., 2014). At least 100 total cells per well were scored, and the percentage of b-galactosidase positive cells was determined.
Cell-cycle analysis
ECFCs were plated in 100 mm type I collagen-coated tissue culture dishes at 400,000 cells per dish. After 24 h, cells were incubated with BrdU labeling reagent (Invitrogen, Grand Island, NY) for 1 h. Cells were stained as previously described using Alexa Flour 488 mouse anti-BrdU (Invitrogen) and 7-AAD (Life Technologies) (Blue et al., 2015). Samples were analyzed by flow cytometry on the LSRII 407 nm laser and a minimum of 10,000 events were recorded per sample. Analysis was performed using FlowJo Single Cell Analysis Software vX.0.6.
Matrigel network formation assay
ECFCs were plated in 100 mm type I collagen-coated tissue culture dishes at 400,000 cells per dish. After 1 day in culture, cells were trypsinized and plated at 4,500 cells per well in triplicate in angiogenesis 15 μ-slides (Ibidi USA, Inc., Madison, WI). Wells were coated with 10 μl matrigel matrix (Corning) and cells were plated in EGM2 media. Phase contrast images were obtained using a Spot camera (Spot Imaging, Sterling Heights, MI) on an Axiovert 35 microscope (Zeiss, Thornwood, NY) at times indicated in the figure legend. The number of closed networks per well was scored and averaged for each condition.
Transwell migration assays
ECFCs were plated in 100 mm dishes at 400,000 cells per dish. After 1 day in culture, cells were serum-starved in Endothelial Basal Media 2 (EBM2) (Lonza) for 1 h and then trypsinized. Cells were plated on type I collagen-coated 8.0 mm pore size transwell inserts (Corning). ECFCs were plated at 3–5 × I04 cells per insert. The number of cells was kept constant for each replicate. Inserts were placed in 24-well dishes containing EGM2, 10% FCS, and antibiotic antimycotic solution, and incubated for 4h at 37°C. Transwell surfaces were wiped with cotton swabs to remove non-migrated cells and then fixed with cold 100% methanol for 15 min. After fixation, cells were washed with phosphate-buffered saline and stained with 1% crystal violet in 10% acetic acid for 10 min at room temperature. After brief destaining, phase contrast images were obtained using a Spot camera on an Axiovert 35 microscope, and the number of migrated cells was scored.
Statistical analysis
Data illustrated are mean ± SEM. Paired and unpaired t-tests and repeated measures 2-way ANOVAs were conducted when appropriate, as denoted in the figure legends. Prism 6 (Graphpad Prism, RRID: SCR_002798) was used for all statistical analyses, and significance was noted when P < 0.05.
Results
MEOX2 is increased in ECFCs from DM pregnancies
To determine whether nuclear MEOX2 is increased in ECFCs from DM pregnancies, Western blotting analyses were conducted. These data confirmed increased nuclear MEOX2 in ECFCs from DM pregnancies compared to control samples (Fig. 1A and B). While some heterogeneity in MEOX2 levels was evident in DM-exposed samples, nuclear MEOX2 was consistently higher in these samples compared to controls.
Fig. 1.
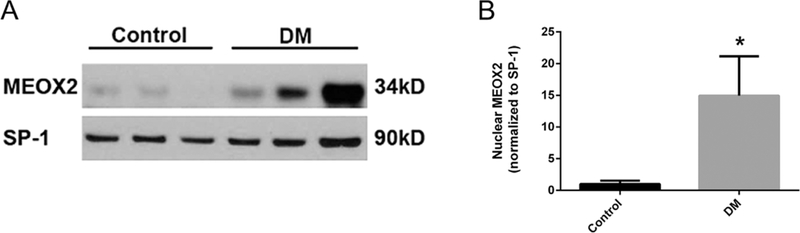
ECFCs from DM pregnancies have increased nuclear MEOX2. (A) Representative Western blot. Nuclear lysates from ECFCs were separated by SDS-PAGE. Blots were probed for MEOX2 and SP-1, as a loading control. (B) Quantitation of nuclear MEOX2 expression. n = 8 control, n = 11 DM, *P < 0.05 by unpaired t-test.
MEOX2 overexpression is sufficient to alter senescence, cell cycle progression, and network formation of ECFCs
MEOX2 has been implicated in upregulating pI6 to cause senescence HUVECS (Douville et al., 2011). Previously, we showed that ECFCs from DM pregnancies have increased senescence, decreased cell cycle progression, and decreased network formation (Ingram et al., 2008). Therefore, we questioned whether increased MEOX2 expression in control ECFCs was sufficient to induce impaired function. To test this hypothesis, MEOX2 was overexpressed in ECFCs from control pregnancies using a lentiviral vector. ECFCs transduced with an empty lentiviral vector were used as a control. Overexpression was confirmed by Western blotting (Fig. 2A).
Fig. 2.
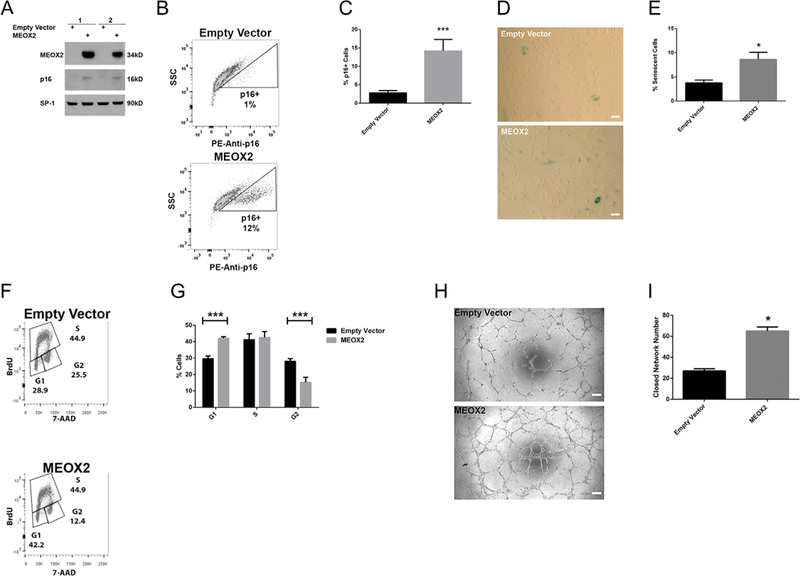
MEOX2 overexpression in control ECFCs increases senescence, alters cell cycle progression, and enhances network formation. MEOX2 was overexpressed in control ECFCs using lentiviral transduction techniques. (A) Representative Western blot illustrating MEOX2 and p16 expression. Nuclear lysates were analyzed for MEOX2, p16, and SP-1 as a loading control. Numbers represent separate transductions of ECFCs from different pregnancies. (B) Representative gating strategy of intracellular p16 expression in transduced ECFCs. p16 expression was measured by intracellular flow cytometry staining. Solid line represents empty vector control. (C) Quantitation of p16 + cells by flow cytometry. Unstained HeLa cells were used as a negative control. HeLa cells stained with PE mouse anti-p16 were used as a positive control. n = 4 transductions, ***P < 0.001 by paired t-test. (D) Representative images from 3-day senescence-associated-β-galactosidase assays with transduced ECFCs (100 × magnification). Scale bars represent 100 μm. (E) Quantitation of 3-day senescence-associated-β-galactosidase assays, n = 4 transductions, *P < 0.05 by paired t-test. (F) Representative gating strategy to measure cell cycle progression of transduced ECFCs. Cell-cycle analysis was conducted using flow cytometric analysis of BrdU and 7-AAD staining. (G) Quantitation of cell-cycle analysis of transduced ECFCs, n = 3 transductions, ***P < 0.001 by repeated measures 2-way ANOVA. (H) Representative images from matrigel network formation assay with transduced ECFCs at 8h post-plating (50× magnification). Scale bar represents 200 μm. (I) Quantitation of matrigel network formation assay with transduced ECFCs at 8 h post-plating, n= 3 transductions, *P < 0.05 by paired t-test.
Because pI6 is a known mediator of senescence (Ekholm and Reed, 2000; Lundberg et al., 2000), pI6 expression was initially examined. MEOX2 overexpression in control ECFCs resulted in an increase in pI6 compared to ECFCs transduced with the empty vector (Fig. 2A). To further validate this result on a single-cell basis, flow cytometric analysis was employed to detect intracellular pI6. These data confirmed an increase in pI6 in a subset of ECFCs that overexpress MEOX2 (Fig. 2B and C). Additionally, β-galactosidase senescence assays showed that MEOX2 overexpression increased the number of senescent cells (Fig. 2D and E).
Our previous data demonstrate that ECFCs from DM pregnancies have reduced proliferation (Ingram et al., 2008). Therefore, we questioned whether increased MEOX2 was sufficient to alter cell cycle progression of control ECFCs. MEOX2 overexpression altered cell cycle progression measured by flow cytometry (Fig. 2F and G). Specifically, increased MEOX2 resulted in an increase in the proportion of ECFCs in the G1 phase and a decrease in the proportion of ECFCs in the G2 phase. The proportion of ECFCs in S phase was unaltered.
Given that MEOX2 overexpression in control cells led to increased senescence and altered cell cycle progression, the effect of MEOX2 on ECFC vasculogenic function was evaluated in vitro. Surprisingly, MEOX2 overexpression in control ECFCs increased the number of closed networks compared to the empty vector controls (Fig. 2H and I). Further, MEOX2 overexpression in DM samples also increased the number of closed networks compared to the empty vector controls (Supplemental Fig. SIA and B). Together, these data suggest that MEOX2 overexpression is sufficient to induce changes in senescence, cell cycle progression, and network formation. However, there is a disconnect between the observed phenotypes, suggesting that MEOX2 regulation of senescence and cell cycle progression does not negatively impact overall network formation.
MEOX2 is required to alter network formation, but not senescence or cell cycle progression
To determine whether MEOX2 was required to induce changes in ECFCs from DM pregnancies, MEOX2 was depleted using either an shRNA or siRNA approach. Knockdown was confirmed by Western blotting for both approaches (Fig. 3A and B). Despite effective MEOX2 knockdown, levels of ECFC senescence were no different compared to ECFCs transduced with shControl (Fig. 3C and D). Further, flow cytometric cell-cycle analysis indicated that MEOX2 knockdown in ECFCs from DM (Fig. 3E and F) and control (Supplemental Fig. S2A and B) pregnancies did not alter cell cycle progression. To examine whether MEOX2 knockdown improved network formation of DM-exposed ECFCs, matrigel assays were conducted. Although MEOX2 knockdown in control ECFCs did not affect network formation (Supplemental Fig. S2C and D), MEOX2 knockdown in ECFCs from DM pregnancies resulted in decreased network formation compared to siControls (Fig. 3G and H), complimentary to the MEOX2 overexpression assays (Fig. 2H and I).
Fig. 3.
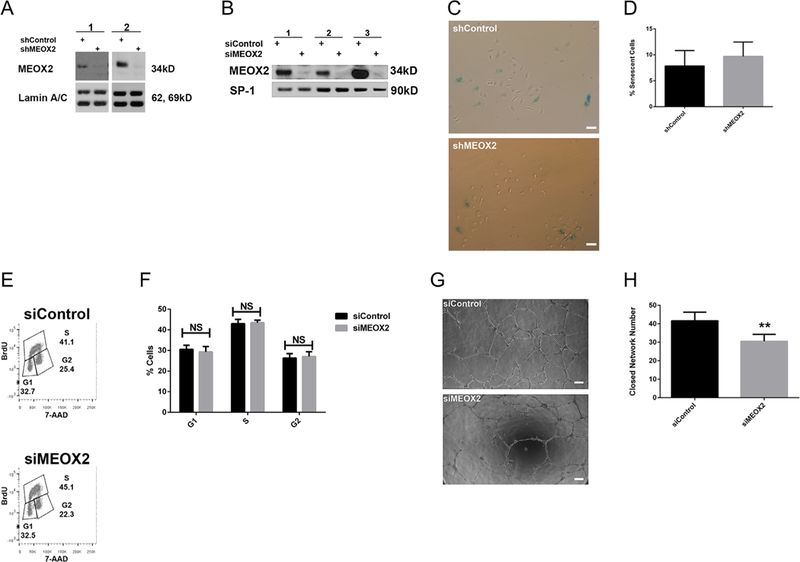
MEOX2 knockdown in ECFCs from DM pregnancies does not alter senescence or cell cycle progression, but decreases network formation. MEOX2 was knocked down in cells from DM pregnancies using shRNA or siRNA techniques. (A) Representative Western blot depicting MEOX2 expression when knocked down by shRNA. Nuclear lysates analyzed for MEOX2. Lamin A/C was used as a loading control. Numbers represent separate transfections of ECFCs from different pregnancies. (B) Representative Western blot showing MEOX2 expression when knocked down by siRNA. Nuclear lysates analyzed for MEOX2. SP-1 was used as a loading control. Numbers represent separate transfections of ECFCs from different pregnancies. (C) Representative images from 3-day senescence-associated-β-galactosidase assays with transduced ECFCs (100× magnification). Scale bars represent 100 μm. (D) Quantitation of 3-day senescence-associated-β-galactosidase assays, n = 9 transductions, P > 0.05 by paired t-test. (E) Representative gating strategy to measure cell cycle progression of transfected ECFCs. Cell-cycle analysis was conducted using flow cytometric analysis of BrdU and 7-AAD staining. (F) Quantitation of cell-cycle analysis of transfected ECFCs, n = 9 transfections, P > 0.05 by repeated measures 2-way ANOVA. (G) Representative images from matrigel network formation assay with transfected ECFCs at 8 h post-plating (50× magnification). Scale bar represents 200 μm. (H) Quantitation of matrigel network formation assay with transfected ECFCs at 8h post-plating, n = 12 transfections, **P < 0.01 by paired t-test.
MEOX2 alters migration in ECFCs
Together, the data indicate that MEOX2 is both sufficient and required to alter network formation, supporting a regulatory role in vasculogenesis. Migration is a critical step in establishing vascular networks (Rahfii and Lyden, 2003). Therefore, ECFC migratory capacity was first examined in ECFCs from control and DM pregnancies. A 50% reduction in migration was observed in ECFCs from DM pregnancies (25.3 ± 3.0 vs. 12.7 ± 2.5 ECFCs/high power field, n = 6, P < 0.01 by unpaired t-test), congruent with our previously published network formation data (Ingram et al., 2008). To examine a potential regulatory role of migration, MEOX2 was overexpressed in ECFCs from control and DM pregnancies, and depleted in ECFCs from DM pregnancies. Interestingly, MEOX2 overexpression in ECFCs from control (Fig. 4A and B) and DM (Supplemental Fig. S1C and D) pregnancies increased migration, consistent with the observed increases in network formation (Fig. 2H and I). Conversely, MEOX2 knockdown in ECFCs from DM pregnancies decreased migration (Fig. 4C and D), congruent with decreased network formation (Fig. 3G and H). Collectively, these data suggest that upregulated nuclear MEOX2 in DM-exposed ECFCs is a compensatory mechanism to enhance migration and vasculogenesis.
Fig. 4.
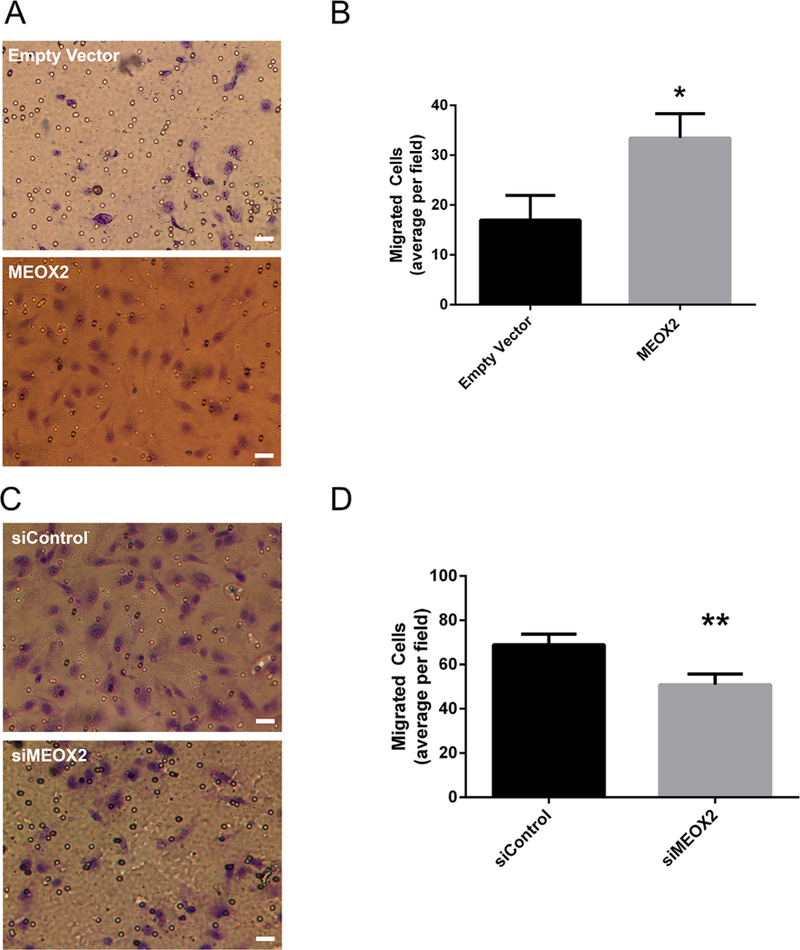
MEOX2 alters ECFC migration. (A) Representative images of transwell migration assay with transduced ECFCs (320 × magnification). Scale bar represents 30 μm. MEOX2 was overexpressed in ECFCs from control pregnancies using lentiviral techniques and cells were subjected to a transwell migration assay. Cells were stained with 1% crystal violet. (B) Quantitation of transwell migration assay with transduced ECFCs, n = 5 transductions, *P < 0.05 by paired t-test. (C) Representative images of transwell migration assay with transduced ECFCs (320× magnification). Scale bar represents 30 μm. MEOX2 was knocked down in ECFCs from DM pregnancies using siRNA techniques, and cells were subjected to a transwell migration assay. Cells were stained with 1% crystal violet. (D) Quantitation of transwell migration assay with transfected ECFCs, n = 6 transfections, **P < 0.01 by paired t-test.
Discussion
Fetal exposure to a diabetic intrauterine environment can lead to a multitude of adverse effects throughout the life of a child (Pettitt et al., 1983, 1988; Martin et al., 1985; Charles et al., 1994; Silverman et al., 1998; Cho et al., 2000; Gillman et al., 2003; Armitage et al., 2005; Boney et al., 2005; Schaefer-Graf et al., 2005; Fetita et al., 2006). While the predisposition for the development of chronic conditions is becoming widely accepted as a point of great clinical concern, the underlying molecular mechanisms contributing to the development of these disorders are largely unknown. In these studies, we found evidence that the transcription factor, MEOX2, is likely involved in regulating vascular network formation.
Previously, MEOX2 was shown to increase cellular senescence, via upregulation of cyclin-dependent kinase inhibitors p16 and p21, and decrease proliferation in HUVECs, suggesting that MEOX2 serves a maladaptive role (Douville et al., 2011). Initially, MEOX2 overexpression in control ECFCs increased p16 expression and senescence, and decreased cell cycle progression, which is consistent with the data reported in the literature (Douville et al., 2011). However, knockdown of MEOX2 in ECFCs from DM pregnancies did not alter senescence or cell cycle progression. Because differences were not seen in the knockdown samples, these data suggest that MEOX2 alone is not sufficient to alter senescence or proliferation in cells from DM pregnancies. ECFCs from DM pregnancies were exposed to long-term dynamic changes in glycemia, hyperinsulinemia, dyslipidemia, and other metabolic and inflammatory perturbations over the course of 9 months. It is likely that this exposure has caused alterations in the expression and/or function of additional proteins, which may also regulate senescence and proliferation. Therefore, we speculate that altering MEOX2 levels independently of these additional proteins is not sufficient to induce changes in the senescent or proliferation phenotypes. Nevertheless, MEOX2 impacted network formation. Specifically, overexpression of MEOX2 in ECFCs from control and DM pregnancies increased network formation. Conversely, MEOX2 knockdown in ECFCs from DM pregnancies resulted in decreased network formation. These data suggest that MEOX2 does regulate ECFC network formation, but this regulation is independent of alterations in senescence or cell cycle progression. Moreover, instead of serving a maladaptive role in vasculogenesis, MEOX2 expression in ECFCs may serve to enhance network formation.
Research addressing the role of MEOX2 in vasculogenesis is limited. Consistent with the data presented here, moderate MEOX2 overexpression positively correlated with network formation in human and mouse brain endothelial cells (BECs) (Soto et al., 2016). Further, MEOX2 depletion in human BECs and MEOX2 heterozygous mice reduced network formation in vitro and in vivo, respectively (Wu et al., 2005; Soto et al., 2016). Taken together, these physiologically relevant data also suggest a protective role of MEOX2 in regulating vasculogenesis.
Because our data suggest that MEOX2-regulation of DM-exposed ECFC network formation was not due to alterations in senescence or cell cycle progression, ECFCs were examined for migration differences. Migration is a critical step in establishing vascular networks (Rahfii and Lyden, 2003). However, few studies examine the role of MEOX2 in cellular migration. In HUVECs, adenoviral infection with vectors containing either human or rat MEOX2 cDNAs decreased migration, though this phenotype was only observed at high concentrations of viral particles per cell (Patel et al., 2005). In contrast, we showthat MEOX2 overexpression in ECFCs from control and DM pregnancies increases migration, while MEOX2 knockdown in ECFCs from DM pregnancies reduces migratory function. These migration data correlate with the observed effects of MEOX2 on ECFC network formation, suggesting a possible connection between MEOX2-regulation of these two phenotypes. In ECFCs, MEOX2 appears to enhance network formation in matrigel by increasing the migratory capacity of ECFCs. Given the apparent discrepancy between previous findings in HUVECs and our data, we speculate that MEOX2 function may differ across cell types (Patel et al., 2005) or under different experimental conditions. While HUVECs do contain ECFCs (Ingram et al., 2005), the enrichment for ECFCs in the total cell population is highly variable between samples and dependent on culture methods. HUVECs are routinely studied as a source of differentiated endothelial cells, raising the possibility that differentiation status of endothelial cells may affect the role of MEOX2. Here, primary human ECFCs isolated from multiple uncomplicated and DM pregnancies were utilized to ensure reproducibility and to enhance the validity of the results. Given our previous data demonstrating that later passage ECFCs exhibit alterations in function (Blue et al., 2014), we consistently utilized early passage cells (<6). It is unclear whether a similar approach was taken in prior studies (Patel et al., 2005). Nevertheless, the consistency of our findings in numerous control and DM-exposed ECFCs support the supposition that MEOX2 has an important role in the regulation of migration and vasculogenesis.
Given the identification of a link between MEOX2-regulation of migration and in vitro network formation, future studies are needed to identify the cellular and molecular mechanisms responsible. In order for ECFCs to migrate to form de novo networks, cells must adhere to extracellular matrix (ECM) proteins, degrade the surrounding ECM, and engage in cytoskeletal rearrangement through actin remodeling (Ridley et al., 2003). Ultimately, detailed studies that directly assess each of these processes are warranted in order to discover the molecular underpinnings of ECFC dysfunction following intrauterine DM exposure.
Importantly, differential MEOX2 expression in humans has been shown to have important clinical implications linked to vascular dysfunction. For example, reduced MEOX2 is associated with increased cardiac dysfunction, coronary heart disease, and Alzheimer’s disease (Wu et al., 2005; Coppiello et al., 2015; Yang et al., 2015; Soto et al., 2016). Because these disorders often result in poor quality of life, enhanced morbidities, and increased mortality, an improved understanding of whether MEOX2 has a direct pathologic role in the development of these diseases is of utmost importance. Our studies in DM-exposed ECFCs have provided insight into the role of MEOX2 in the regulation of migration and network formation. Future mechanistic studies could be applied to other disease states, enabling a more complete understanding of these pathologic conditions, and ultimately resulting in future therapeutic advances.
Supplementary Material
Acknowledgments
The authors thank Dr. Angelo Cardoso, Dr. Jamie Case, Julie Mund, Dr. Karen Pollok, Matt Repass, Emily Sims (Angio BioCoreatthe Indiana University Simon Cancer Center), Cavya Chandra, Rashell Naida, Zia Nuss, and Amna Sohail (Indiana University School of Medicine) for excellent technical assistance, and Dr. Helmut Hanenberg (Heinrich Heine University School of Medicine) for the gift of the lentiviral plasmids. The authors also thank Dr. Jeffrey Elmendorf, Dr. Paul Herring, and Dr. Jonathan Tune (Indiana University School of Medicine) for scholarly discussion, and Janice Walls (Indiana University School of Medicine) for administrative support. This work was supported by the National Institutes of Health (R01 HL094725 [L.S.H.], P30 CA82709 [Indiana University Simon Cancer Center], and U10 HD063094 [L.S.H.]) and the Riley Children’s Foundation (L.S.H.). Additionally, this publication was made possible with partial support from: Grant # UL1 TR001108 (C.R.G., A. Shekhar, PI) from the National Institutes of Health, National Center for Advancing Translational Sciences, Clinical and Translational Sciences Award, and the National Heart, Lung, and Blood Institute of The National Institutes of Health under Award # T32 HL007910 (K.M.V., H. Broxmeyer, PI).
Contract grant sponsor: National Institutes of Health;
Contract grant numbers: R0I HL094725, P30 CA82709, UI0 HD063094, UL I TR00II08, T32 HL0079I0-I5.
Contract grant sponsor: Riley Children’s Foundation, Indianapolis, IN, USA.
Footnotes
Conflicts of interest: No potential conflicts of interest relevant to this article were reported.
Supporting Information
Additional supporting information may be found in the online version of this article at the publisher’s web-site.
Literature Cited
- Armitage JA, Taylor PD, Poston L. 2005. Experimental models of developmental programming: Consequences of exposure to an energy rich diet during development. J Physiol 565:3–8. [DOI] [PMC free article] [PubMed] [Google Scholar]
- Avogaro A, Albiero M, Menegazzo L, de Kreutzenberg S, Fadini GP. 2011. Endothelial dysfunction in diabetes: The role of reparatory mechanisms. Diabetes Care 34: S285–S290. [DOI] [PMC free article] [PubMed] [Google Scholar]
- Blue EK, DiGiuseppe R, Derr-Yellin E, Acosta JC, Pay SL, Hannenber H, Schellinger MM, Quinney SK, Mund JA, Case J, Haneline LS. 2014. Gestational diabetes induces alterations in the function of neonatal endothelial colony-forming cells. Pediatr Res 75:266–272. [DOI] [PMC free article] [PubMed] [Google Scholar]
- Blue EK, Sheehan BM, Nuss ZV, Boyle FA, Hocutt CM, Gohn CR, Varberg KM, McClintick JN, Haneline LS. 2015. Epigenetic regulation of PLAC8 contributes to altered function of endothelial colony forming cells exposed to intrauterine gestational diabetes mellitus. Diabetes 64:2664–2675. [DOI] [PMC free article] [PubMed] [Google Scholar]
- Boney CM, Verma A, Tucker R, Vohr BR. 2005. Metabolic syndrome in childhood: Association with birth weight, maternal obesity, and gestational diabetes mellitus. Pediatrics 115:e290–e296. [DOI] [PubMed] [Google Scholar]
- Buchanan TA, Xiang AH, Page KA. 2012. Gestational diabetes mellitus: Risks and management during and after pregnancy. Nat Rev Endocrinol 8:639–649. [DOI] [PMC free article] [PubMed] [Google Scholar]
- Centers for Disease Control and Prevention. 2014. National Diabetes Statistics Report: Estimates of diabetes and its burden in the United States, 2014. Atlanta, GA: U.S. Department of Health and Human Services. [Google Scholar]
- Charles MA, Pettitt DJ, Hanson RL, Bennett PH, Saad MF, Liu QZ, Knowler WC. 1994. Familial and metabolic factors related to blood pressure in Pima Indian children. Am J Epidemiol 140:123–131. [DOI] [PubMed] [Google Scholar]
- Chen Y, Leal AD, Patel S, Gorski DH. 2007. The homeobox gene GAX activates p2IWAFI/ CIPI expression in vascular endothelial cells through direct interaction with upstream AT-rich sequences. J Biol Chem 282:507–517. [DOI] [PMC free article] [PubMed] [Google Scholar]
- Cho NH, Silverman BL, Rizzo TA, Metzger BE. 2000. Correlations between the intrauterine metabolic environment and blood pressure in adolescent offspring of diabetic mothers. J Pediatr 136:587–592. [DOI] [PubMed] [Google Scholar]
- Coppiello G, Collantes M, Sirerol-Piquer MS, Vandenwijngaert S, Schoors S, Swinnen M, Vandersmissen I, Herijgers P, Topal B, van Loon J, Goffin J, Prosper F, Carmeliet P, Garcia-Verdugo JM, Janssens S, Penuelas I, Aranguren XL, Luttun A. 2015. Meox2/TcfI5 heterodimers program the heart capillary endothelium for cardiac fatty acid uptake. Circulation 131:8I5–826. [DOI] [PubMed] [Google Scholar]
- Douville JM, Cheung DY, Herbert KL, Moffatt T, Wigle JT.2011. Mechanisms of MEOXI and MEOX2 regulation of the cyclin dependent kinase inhibitors p2I and pI6 in vascular endothelial cells. PLoS ONE 6:e29099. [DOI] [PMC free article] [PubMed] [Google Scholar]
- Ekholm S, Reed SI. 2000. Regulation of GI cyclin-dependent kinases in the mammalian cell cycle. Curr Opin Cell Biol 12:676–684. [DOI] [PubMed] [Google Scholar]
- Fetita LS, Sobngwi E, Serradas P, Calvo F, Gautier JF. 2006. Consequences of fetal exposure to maternal diabetes in offspring. J Clin Endocrinol Metab 91:37I8–3724. [DOI] [PubMed] [Google Scholar]
- Gavvovidis I, Rost I, Trimborn M, Kaiser FJ, Purps J, Wiek C, Hanenberg H, Neitzel H, Schindler D. 2012. A novel MCPHI isoform complements the defective chromosome condensation of human MCPHI-deficient cells. PLoS ONE 7:e40387. [DOI] [PMC free article] [PubMed] [Google Scholar]
- Ghulmiyyah LM, Costantine MM, Yin H, Tamayo E, Clark SM, Hankins GD, Saade GR, Longo M. 2011. The role of oxidative stress in the developmental origin of adult hypertension. Am J Obstet Gynecol 205:155. [DOI] [PMC free article] [PubMed] [Google Scholar]
- Gillman MW, Rifas-Shiman S, Berkey CS, Field AE, Colditz GA. 2003. Maternal gestational diabetes, birth weight, and adolescent obesity. Pediatrics 111:e22I–e226. [DOI] [PubMed] [Google Scholar]
- Gorski DH, Leal AJ. 2003. Inhibition of endothelial cell activation by the homeobox gene Gax. J Surg Res 111:9I–99. [DOI] [PubMed] [Google Scholar]
- Gorski DH, Walsh K. 2003. Control of vascular cell differentiation by homeobox transcription factors. Trends Cardiovasc Med 13:2I3–220. [DOI] [PubMed] [Google Scholar]
- Hay WW Jr. 2012. Care of the infant of the diabetic mother. Curr Diab Rep 12:4–I5. [DOI] [PubMed] [Google Scholar]
- Hoffman RP. 2014. Vascular endothelial dysfunction and nutritional compounds in early type I diabetes. Current Diab Rev 10:20I–207. [DOI] [PubMed] [Google Scholar]
- Hofman PL, Cutfield WS. 2006. Insulin sensitivity in people born pre-term, with low or very low birth weight and small for gestational age. J Endocrinol Ivest 29:2–8. [PubMed] [Google Scholar]
- Ingram DA, Lien IZ, Mead LE, Estes M, Prater DN, Derr-Yellin E, DiMeglio LA, Haneline LS. 2008. In vitro hyperglycemia or a diabetic intrauterine environment reduces neonatal endothelial colony-forming cell numbers and function. Diabetes 57:724–73I. [DOI] [PubMed] [Google Scholar]
- Ingram DA, Mead LE, Moore DB, Woodard W, Fenoglio A, Yoder MC. 2005. Vessel wall-derived endothelial cells rapidly proliferate because they contain a complete hierarchy of endothelial progenitor cells. Blood I05:2783–2786. [DOI] [PubMed] [Google Scholar]
- Lundberg AS, Hahn WC, Gupta P, Weinberg RA. 2000. Genes involved in senescence and immortalization. Curr Opin Cell Biol 12:705–709. [DOI] [PubMed] [Google Scholar]
- Martin AO, Simpson JL, Ober C, Freinkel N. 1985. Frequency of diabetes mellitus in mothers of probands with gestational diabetes: Possible maternal influence on the predisposition to gestational diabetes. Am J Obstet Gynecol 151:471–475. [DOI] [PubMed] [Google Scholar]
- Patel S, Leal AD, Gorski DH.2005Thehomeoboxgenegaxinhibitsangiogenesisthroughinhibitionof nuclear facttor-kB-dependent endothelial cell gene expression. Cancer Res 65:1414–1424. [DOI] [PubMed] [Google Scholar]
- Pettitt DJ, Aleck KA, Baird HR, Carraher MJ, Bennett PH, Knowler WC. 1988. Congenital susceptibility to NIDDM. Role of intrauterine environment. Diabetes 37:622–628. [DOI] [PubMed] [Google Scholar]
- Pettitt DJ, Baird HR, Aleck KA, Bennett PH, Knowler WC. I983. Excessive obesity in offspring of Pima Indian women with diabetes during pregnancy. N Engl J Med 308:242–245. [DOI] [PubMed] [Google Scholar]
- Rahfii S, Lyden D. 2003. Therapeutic stem and progenitor cell transplantation for organ vascularization and regeneration. Nature Med 9:702–712. [DOI] [PubMed] [Google Scholar]
- Reichetzeder C, Dwi Putra SE, Li J, Hocher B. 2016. Developmental origins of disease— Crisis precipitates change. Cell Physiol Biochem 39:919–938. [DOI] [PubMed] [Google Scholar]
- Ridley AJ, Schwartz MA, Burridge K, Firtel RA, Ginsberg MH, Borisy G, Parsons JT, Horwitz AR. 2003. Cell migration: Integrating signals from front to back. Science 302:1704–1709. [DOI] [PubMed] [Google Scholar]
- Schaefer-Graf UM, Pawliczak J, Passow D, Hartmann R, Rossi R, Buhrer C, Harder T, Plagemann A, Vetter K, Kordonouri O. 2005. Birth weight and parental BMI predict overweight in children from mothers with gestational diabetes. Diabetes Care 28:1745–1750. [DOI] [PubMed] [Google Scholar]
- Silverman BL, Rizzo TA, Cho NH, Metzger BE. 1998. Long-term effects of the intrauterine environment. The northwestern university diabetes in pregnancy center. Diabetes Care 21:B142–B149. [PubMed] [Google Scholar]
- Simeoni U, Barker DJ. 2009. Offspring of diabetic pregnancy: Long-term outcomes. Semin Fetal Neonatal Med 14:119–124. [DOI] [PubMed] [Google Scholar]
- Soto I, Grabowska WA, Onos KD, Graham LC, Jackson HM, Simeone SN, Howell GR. 2016. Meox2 haploinsufficiency increases neuronal cell loss in a mouse model of Alzheimer’s disease. Neurobiol Aging 42:50–60. [DOI] [PMC free article] [PubMed] [Google Scholar]
- Winer N, Sowers JR. 2004. Epidemiology of diabetes. J Clin Pharmacol 44:397–405. [DOI] [PubMed] [Google Scholar]
- Wu Z, Guo H, Chow N, Sallstrom J, Bell RD, Deane R, Brooks AI, Kanagala S, Rubio A, Sagare A, Liu D, Li F, Armstrong D, Gasiewicz T, Zidovetzki R, Song X, Hofman F, Zlokovic BV. 2005. Role of the MEOX2 homeobox gene in neurovascular dysfunction in Alzheimer disease. Nat Med 11:959–965. [DOI] [PubMed] [Google Scholar]
- Yang WY, Petit T, Thijs L, Zhang ZY, Jacobs L, Hara A, Wei FF, Salvi E, Citterio L, Delli Carpini S, Gu YM, Knez J, Cauwenberghs N, Barcella M, Barlassina C, Manunta P, Coppiello G, Aranguren XL, Kuznetsova T, Cusi D, Verhamme P, Luttun A, Staessen JA. 20I5. Coronary risk in relation to genetic variation in MEOX2 and TCFI5 in a Flemish population. BMC Genet 16:116. [DOI] [PMC free article] [PubMed] [Google Scholar]
Associated Data
This section collects any data citations, data availability statements, or supplementary materials included in this article.