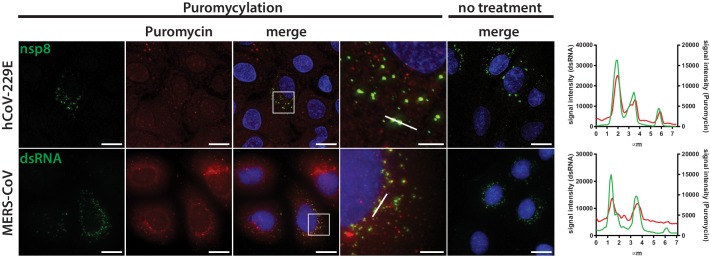
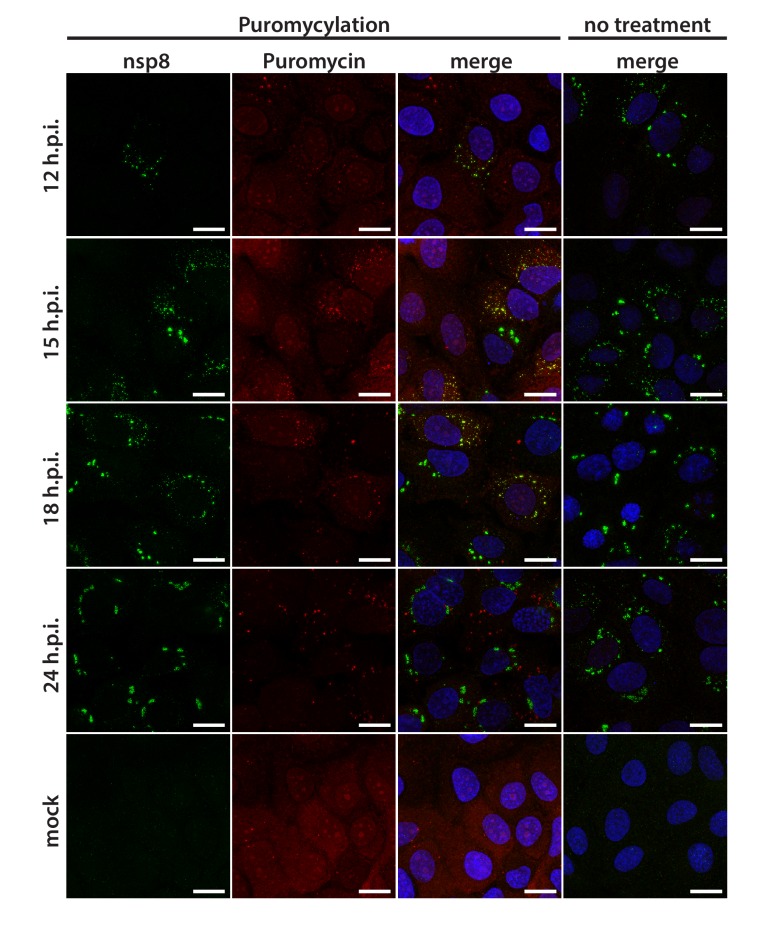
Figure 7. Active translation near sites of HCoV-229E and MERS-CoV mRNA synthesis.
Visualization of active translation during HCoV-229E and MERS-CoV infections. Huh7 cells were infected with HCoV-229E and MERS-CoV (MOI = 1) for 12 hr and 6 hr, respectively. Cells were pulsed with cycloheximide, emetine and puromycin for 5 min to label translating ribosomes and subjected to a coextraction/fixation procedure to remove free puromycin. Non-infected and/or non-pulsed cells were used as control. Cells were labelled using anti-nsp8 (HCoV-229E) or dsRNA (MERS-CoV) and anti-puromycin antibodies. Nuclei are counterstained with DAPI. Z-projection of deconvolved z-stacks acquired with a DeltaVision Elite High-Resolution imaging system are shown. Intensity profiles in magnified regions are shown. Scale bar: 20 µm; insets 5 µm.


