Abstract
The maintenance of biodiversity is crucial for ecosystem processes such as plant biomass production, as higher species richness is associated with increased biomass production in plant communities. However, the effects of evenness and functional diversity on biomass production are understudied. We manipulated the composition of an experimental grassland by sowing various seed mixtures and examined the effects of diversity and evenness on biomass production after three years. We found that biomass production increased with greater species and functional richness but decreased with greater species and functional evenness. Standing biomass increased but species number and functional richness decreased with increasing proportion of perennial grasses. Our findings emphasise the importance of productive dominant species, as the proportion of perennial grasses had a positive effect on standing biomass, while species and functional evenness had a negative effect on it. Thus, our findings support the theory that, besides diversity, dominance effects and the so-called mass ratio hypothesis may also play a key role in explaining primary biomass production.
Introduction
Habitat fragmentation, degradation, overexploitation and biological invasions are causing a global decline in biodiversity1. The maintenance of biodiversity is crucial, as it influences ecosystem functioning. For example, higher biodiversity in general is predicted to increase the biomass production and stability of ecosystems, and to decrease their invasibility2. Thus, understanding the consequences of the widespread loss of biodiversity has become one of the most important tasks of ecological research3,4. Energy enters into terrestrial ecosystems mostly by means of plant biomass production; thus, the impact of global biodiversity loss on plant production indirectly affects all ecosystem processes and associated services provided to humanity5,6.
The upper limits of primary production are clearly determined by the abiotic environment, but biotic characteristics such as biodiversity also shape biomass production6,7. One of the most debated questions in ecology is whether biomass production affects plant biodiversity or vice versa8–10. In initial observational studies of mature natural communities11,12 results usually showed a unimodal (hump-shaped) relationship between biomass production and diversity9. Namely, with increasing plant production diversity first increases, then after a certain point starts to decrease, as communities with high biomass are usually dominated by highly productive competitive species13,14. The unimodal relationship with plant productivity has also been demonstrated for strategy richness and for the variance of many traits15. However, the existence of a unimodal relationship between plant biomass production and diversity is debated8,16. More recent studies have presented primary production as the dependent rather than the independent variable6,17, usually by demonstrating that biomass production generally increases with plant diversity in newly established experimental communities18,19. One of the most important conclusions of these studies is that although high community biomass production tends to decrease biodiversity, the opposite, namely that decreasing diversity generally increases biomass production, cannot be inferred6. Later studies have linked these opposing viewpoints by emphasising that community biomass and diversity are both influenced by the resource supply rate of the habitat10,20.
Three main potential explanations exist for the positive relationship between biodiversity and biomass production observed in experimental studies. Firstly, the so-called sampling or selection effect suggests that a more diverse community has a higher probability of including highly productive species21. Secondly, complementarity effects occur when differences in species resource acquisition in space and time allow a more complete utilization of resources, resulting in the increased biomass production of more diverse communities22. Thirdly, facilitative effects of some co-occurring species can also positively influence biomass production by allowing the establishment and survival of other species23–25. Studies found sampling effects to be of greater importance than complementarity effects26,27; however, biodiversity effects cannot be explained solely by sampling effects, which occur far less generally than previously thought28,29. Sampling, complementarity and facilitative effects are mutually non-exclusive and the net effect of biodiversity on biomass production can be seen as the sum of these three effects7.
Linking diversity with ecosystem functions by niche complementarity is based on the distribution of species with different traits in the niche space, i.e. functional diversity30,31. There is growing awareness that besides species diversity functional diversity and composition (functional group and/or functional trait composition and diversity) are also important drivers of biomass production and may be more strongly linked to biomass production than species richness per se32,33. Considering functional diversity can contribute to our understanding of the consequences of biodiversity loss upon ecosystems34. There is considerable evidence for the importance of functional group richness and composition18,35,36, and also functional diversity and composition37. Further investigations of the interrelations of species and functional diversity, community structure and biomass production are necessary to advance understanding of biodiversity effects and the underlying processes33. As environmental and habitat conditions likely drive functional diversity, the effects of variation in functional diversity should be studied in a given vegetation type to provide meaningful comparisons.
Evenness measures how equally abundances – most frequently expressed as surface cover and/or biomass – are distributed among species and is inversely related to dominance. Effects of evenness on biomass production are far less studied than the effects of species and functional richness38. Some studies have demonstrated that evenness has a positive effect on biomass production32,39,40. Similarly, Nijs & Roy41 predicted that evenness should have a positive linear effect on biomass production. However, negative effects of evenness have also been demonstrated42, as a community may be most productive when it is dominated by a highly productive species43. Similarly, the mass ratio hypothesis44 proposes that the rate of an ecosystem function such as biomass production is primarily determined by the traits of the dominant species. Most biodiversity experiments used unnaturally high evenness levels45,46 (but see van Rooijen et al.47), further underlining the need to study the effect of evenness on biomass production in natural ecosystems41,43.
The results of previous biodiversity experiments were inconclusive about the effects of evenness and functional diversity on biomass production and further insights into the exact role of species diversity in determining community biomass production are also needed. Thus, we aimed to study the above-mentioned effects in experimental grasslands. To this end, we directed the development of grasslands established on former channels immediately after filling them up with soil by sowing seed mixtures with different grass/forb ratio. We hypothesised that (i) standing biomass is positively correlated with species and functional diversity. In line with the mass ratio hypothesis44, we expected that the abundance of the perennial grass functional group has a crucial role in determining both biomass production and diversity. Thus, we also hypothesised that (ii) the proportion of perennial grasses’ biomass is positively correlated to standing biomass, but negatively correlated to species diversity, evenness, and functional diversity.
Methods
Study area
The study site was in the Hortobágy National Park in East-Hungary, near the settlement Tiszafüred. The national park is characterised by open habitats, such as alkali grasslands, marshes and loess steppes48. The region has a moderately continental climate, with a mean annual precipitation of 550 mm and mean annual temperature of 9.5 °C, but with high variability between years49.
The drainage and watering channels established in the area in the 1950s and ‘60s altered the natural water regime of the region and lowered the groundwater table50. In response, several landscape-scale restoration projects were initiated aiming to eliminate these channels48. The experiment was located in the Villongó area (47°34′, 20°59′), within an approximately 100-ha area, which is characterised by Cynodonti-Poetum angustifoliae loess pastures51,52. Channels in the Villongó area were filled in October 2012, using the soil of the channel embankments, which were built from the excavated soil. After filling up the channels and levelling the surface, no other restoration measures were applied. The whole area was subsequently subject to low-intensity sheep grazing. Data on the composition of the surrounding vegetation is in Supplementary Dataset 1.
Treatments and sampling
To generate an experimental gradient in diversity and evenness we used seed sowing treatments (Table 1). We used a randomized block design with three replicates, each of which contained five 5 m × 5 m plots along the channel. Instead of directly manipulating species numbers, the treatments were designed to manipulate the ratio of grasses and forbs (Table 1). We randomly assigned one of the five treatments to plots in each block. The sown species were selected from grassland-specialist species frequently occurring in the region of the study. We collected seeds in 2012 from natural populations of several locations in the study region and sowed them in late October 2012 (for sown species and seed amounts see Table 1). Seeds were sown on bare ground after filling up the channels with soil. No other pioneer vegetation was present on the site of the experimental plots. This way we directly manipulated initial community composition under uniform environmental conditions. After seed sowing, vegetation development was not manipulated, no weeding and no further treatment was applied, to let natural colonisation and assembly processes occur53.
Table 1.
Thousand-seed mass (TSM) of the sown species and the total mass and number of seeds sown in each treatment.
| Treatments | ||||||
|---|---|---|---|---|---|---|
| TSM (g) | Forb | G5F25 | G15F15 | G25F5 | Grass | |
| Grass sowing (kg/ha) | — | 5 | 15 | 25 | 30 | |
| Forb sowing (kg/ha) | 30 | 25 | 15 | 5 | — | |
| Grass sowing (seed/m2)* | — | 1500 | 4400 | 7300 | 8800 | |
| Forb sowing (seed/m2)* | 5200 | 4300 | 2600 | 900 | — | |
| Grass sowing | ||||||
| Festuca rupicola | 0.342 | — | 1460 | 4382 | 7304 | 8764 |
| Forb sowing | ||||||
| Achillea collina | 0.052 | 939 | 783 | 470 | 157 | — |
| Bunias orientalis | 33.444 | 10 | 8 | 5 | 2 | — |
| Carthamus lanatus | 15.141 | 5 | 4 | 2 | 1 | — |
| Centaurea jacea ssp. angustifolia | 1.055 | 8 | 7 | 4 | 1 | — |
| Centaurea scabiosa | 4.859 | 95 | 79 | 47 | 16 | — |
| Centaurea solstitialis | 1.162 | 68 | 57 | 34 | 11 | — |
| Filipendula vulgaris | 0.681 | 183 | 153 | 92 | 31 | — |
| Galium verum | 0.337 | 906 | 755 | 453 | 151 | — |
| Hypericum perforatum | 0.108 | 1432 | 1194 | 716 | 239 | — |
| Knautia arvensis | 3.137 | 18 | 15 | 9 | 3 | — |
| Lotus corniculatus | 1.091 | 33 | 27 | 16 | 5 | — |
| Lycopsis arvensis | 6.109 | 7 | 6 | 3 | 1 | — |
| Pimpinella saxifraga | 0.567 | 285 | 238 | 143 | 48 | — |
| Plantago media | 0.240 | 341 | 284 | 170 | 57 | — |
| Rapistrum perenne | 6.677 | 58 | 49 | 29 | 10 | — |
| Salvia nemorosa | 0.842 | 643 | 536 | 322 | 107 | — |
| Silene vulgaris | 0.703 | 132 | 110 | 66 | 22 | — |
Seed numbers were calculated using the sown mass and the thousand-seed mass of the species. *Rounded to the nearest hundred. Notations: ‘G’ and ‘F’ in treatment names stand for ‘Grass’ and ‘Forb’, respectively.
We focused on aboveground standing biomass as a proxy of plant biomass production, as there is a sigmoidal relationship between aboveground standing biomass and net primary productivity across a wide range of plants and habitats54. We collected biomass samples in late May 2015, near the peak of standing biomass in the region13. We collected total aboveground biomass from 12 quadrats (20 cm × 20 cm) from every 5 m × 5 m plot; thus, a total of 180 samples were collected (12 quadrats × 5 treatments × 3 experimental blocks). To avoid edge effects, biomass samples were collected from the inner 4 m × 4 m area of each plot. We then dried samples at 65 °C (24 h) and sorted them to vascular plant species and litter. We measured the dry mass of the sorted species and litter with an accuracy of 0.01 g. Nomenclature follows Király55.
Statistical analyses
As we did not remove the spontaneously colonising species and the experimental communities contained a considerable amount of non-sown species, we calculated all measures (both standing biomass and all diversity measures) considering both the sown and the spontaneously colonising species together. We used species richness and species evenness as species diversity measures, calculated for each plot considering both the sown and the spontaneously colonising species. As suggested by Mouchet et al.56, we calculated three functional diversity indices, functional richness (FRic), functional evenness (FEve) and functional divergence (FDiv), as these constitute a relevant combination that considers different facets of functional diversity and were built to be complementary57. We calculated these indices using LHS traits (leaf-height-seed traits, i.e. SLA, canopy height and seed mass, as proposed by Westoby58), which capture basic processes of plant functioning26. Trait data for the studied species are available in Supplementary Dataset 2. For the calculation of FRic, FEve and FDiv indices we used the FD library59 in R statistical environment60. We obtained canopy height and seed mass data from sources containing regionally measured data55,61,62, and SLA data from the LEDA Traitbase63. The proportion of perennial grasses’ biomass (PG%) was calculated as the proportion of perennial grasses’ biomass to the total biomass in each plot. Species number, species evenness and functional diversity indices (FRic, FEve and FDiv) were calculated for the biomass sample size (0.04 m2).
We used linear mixed models (LMMs) to test the effect of species number, species evenness and functional diversity (FRic, FEve, FDiv) on the standing biomass of plots, with experimental block included as a random factor. We also used LMMs to test the effect of PG% on the species number, species evenness and functional diversity (FRic, FEve, FDiv) of plots. LMMs were performed using the ‘lmer’ function in the package ‘lme4’64 in R. In order to achieve normally distributed residual errors some of the variables (standing biomass and FRic) were log transformed, and species number was standardized using the ‘scale’ function in R. Measures for the different facets of biodiversity were either weakly correlated to each other or not correlated, the strongest correlation was observed between species richness and FRic (r = 0.705), which is on the threshold of considering two variables non-collinear65 (Table S1 in Supplementary Table). Marginal and conditional R2 values were obtained using the function ‘r.squaredGLMM’ provided in the package ‘MuMIn’66. Marginal R2 is the proportion of variance explained by the fixed effects, while conditional R2 is the proportion explained by the full model, including both fixed and random effects67.
As the visual inspection of species evenness plotted against PG% clearly indicated a unimodal relationship, we fitted both a linear and a quadratic model to the data and compared them using the Akaike Information Criterion (AIC)68,69, where smaller AIC values indicate better models. We considered a difference in AIC values higher than 2 (ΔAIC > 2) to indicate moderate support for a difference between the models, while ΔAIC > 10 to indicate strong support for a difference69. All statistical analyses were carried out in R statistical environment60.
Results
We found a total of 83 species in the plots, of which 68 species were non-sown. The mean number of species per 5 m × 5 m plot was 34.1 (min = 24, max = 52), of which a mean of 6.5 species were sown (min = 2, max = 13), and a mean of 27.5 species were non-sown (min = 20, max = 40). Thus, the composition and diversity of the plots after 3 years were considerably different from those of the sown mixtures. Festuca rupicola was the most abundant in the majority of plots where it was sown, but other perennial grasses (Agropyron repens, Agrostis stolonifera, Alopecurus pratensis, Cynodon dactylon, F. pseudovina, Koeleria cristata, Poa angustifolia, P. bulbosa and P. pratensis) colonised the plots spontaneously. Where no grass was sown, mostly the short-lived grass Bromus mollis or the perennial grass Poa angustifolia was the most abundant. In some plots sown dicot species (Achillea collina, Hypericum perforatum, Plantago media or Salvia nemorosa) were the most abundant. Species’ biomass data of all the plots are in Supplementary Dataset 3.
Both species richness and evenness, and functional diversity (FRic – Functional richness; FEve – Functional evenness; FDiv – Functional divergence) had a significant effect on the standing biomass of plots (Table 2). Species richness and FRic had a relatively strong positive effect on standing biomass, while species evenness, FEve and FDiv had weak negative effects on it (Figs 1–5).
Figure 2.
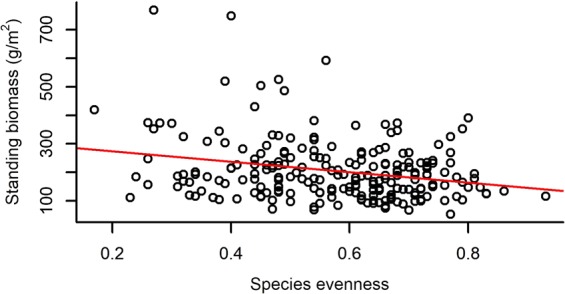
The relationship of species evenness and standing biomass (for the results of LMMs see Table 2). Marginal R2 = 0.066 (the proportion of variance explained by the fixed effects).
Figure 3.
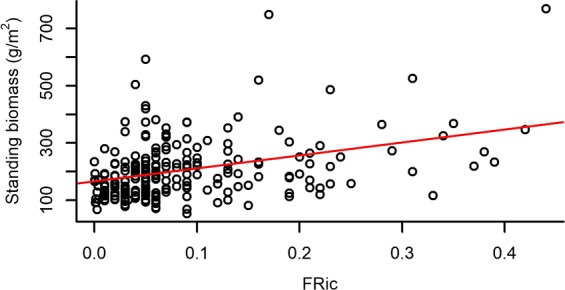
The relationship of functional richness (FRic) and standing biomass (for the results of LMMs see Table 2). Marginal R2 = 0.148 (the proportion of variance explained by the fixed effects).
Figure 4.
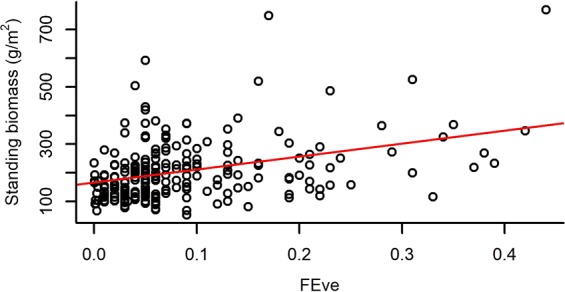
The relationship of functional evenness (FEve) and standing biomass (for the results of LMMs see Table 2). Marginal R2 = 0.053 (the proportion of variance explained by the fixed effects).
Table 2.
The effect of different community characteristics on standing biomass.
| χ 2 | df | P | marginal R2 | conditional R2 | |
|---|---|---|---|---|---|
| Species number | 37.318 | 1 | <0.0001 | 0.179 | 0.197 |
| Species evenness | 12.582 | 1 | <0.0001 | 0.066 | 0.083 |
| FRic | 31.480 | 1 | <0.0001 | 0.148 | 0.169 |
| FEve | 10.484 | 1 | 0.001 | 0.053 | 0.102 |
| FDiv | 6.888 | 1 | 0.009 | 0.035 | 0.065 |
The effect of every variable was tested with linear mixed models. Marginal R2 is the proportion of variance explained by the fixed effects, while conditional R2 is the proportion explained by the full model, including both fixed and random effects. Notations: FRic – Functional richness, FEve – Functional evenness, FDiv – Functional divergence.
Figure 1.
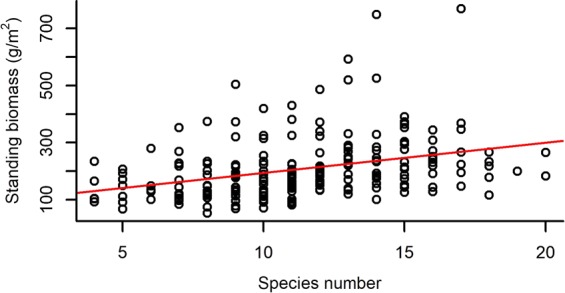
The relationship of species number and standing biomass (for the results of LMMs see Table 2). Marginal R2 = 0.179 (the proportion of variance explained by the fixed effects).
Figure 5.
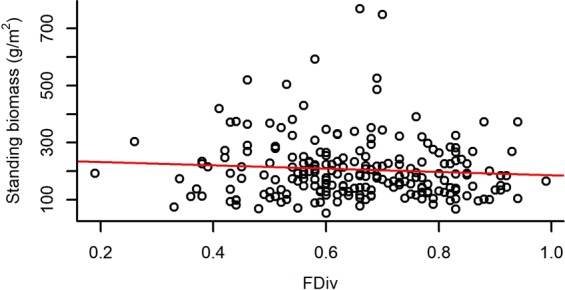
The relationship of functional divergence (FDiv) and standing biomass (for the results of LMMs see Table 2). Marginal R2 = 0.035 (the proportion of variance explained by the fixed effects).
As the visual inspection of species evenness plotted against the proportion of the perennial grasses’ biomass (hereafter PG%) indicated a unimodal relationship, we fitted both a linear (χ2 = 17.099, Df = 1, P < 0.0001) and a quadratic model (χ2 = 126.14, Df = 2, P < 0.0001) to the data. The high difference in the AIC values of the two models (ΔAIC = 78.57; AIC = −175.92 and AIC = −254.49, respectively) strongly supported that the relationship of species evenness and PG% is unimodal.
PG% ranged from 0.16% to 97.05% with a mean of 55.12%, and it had a significant effect on every studied variable except for FEve (Table 3). Higher PG% had a slight positive effect on standing biomass and FDiv, whereas it had a relatively strong negative effect on species number and FRic and showed a notably strong unimodal relationship with species evenness (Figs 6–10).
Figure 7.
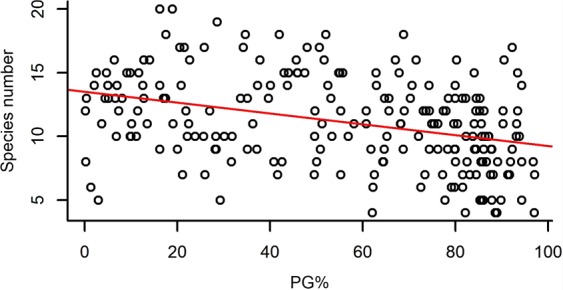
The relationship of the proportion of perennial grasses’ biomass to total biomass (PG%) and species number. (For the results of GLMMs see Table 3). Marginal R2 = 0.130 (the proportion of variance explained by the fixed effects).
Figure 8.
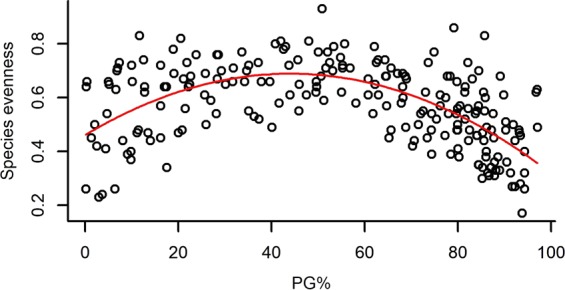
The relationship of the proportion of perennial grasses’ biomass to total biomass (PG%) and species evenness with the fitted second order polynomial curve. (For the results of LMMs see Table 3). Marginal R2 = 0.392 (the proportion of variance explained by the fixed effects).
Figure 9.
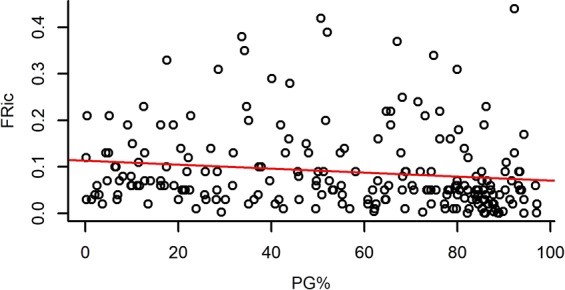
The relationship of the proportion of perennial grasses’ biomass to total biomass (PG%) and functional richness (FRic) (For the results of GLMMs see Table 3). Marginal R2 = 0.061 (the proportion of variance explained by the fixed effects).
Table 3.
The effect of the proportion of perennial grasses’ biomass (PG%) on community characteristics.
| χ 2 | df | P | marginal R2 | conditional R2 | |
|---|---|---|---|---|---|
| Standing biomass | 6.4004 | 1 | 0.011 | 0.034 | 0.076 |
| Species number | 29.728 | 1 | <0.0001 | 0.130 | 0.235 |
| Species evenness2 | 126.14 | 2 | <0.0001 | 0.392 | 0.443 |
| FRic | 12.301 | 1 | 0.0005 | 0.061 | 0.132 |
| FEve | 0.323 | 1 | 0.570 | — | — |
| FDiv | 5.004 | 1 | 0.025 | 0.027 | 0.027 |
Notations: FRic – Functional richness, FEve – Functional evenness, FDiv – Functional divergence.
The effect of PG% on every variable was tested with linear mixed models. Marginal R2 is the proportion of variance explained by the fixed effects, while conditional R2 is the proportion explained by the full model, including both fixed and random effects.
Figure 6.
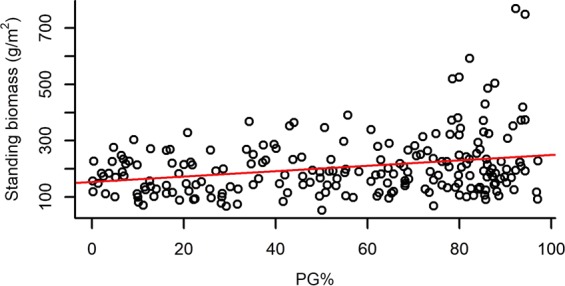
The relationship of the proportion of perennial grasses’ biomass to total biomass (PG%) and standing biomass. (For the results of LMMs see Table 3). Marginal R2 = 0.034 (the proportion of variance explained by the fixed effects).
Figure 10.
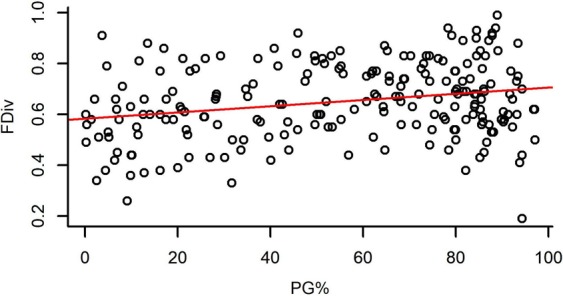
The relationship of the proportion of perennial grasses’ biomass to total biomass (PG%) and functional divergence (FDiv) (For the results of LMMs see Table 3). Marginal R2 = 0.027 (the proportion of variance explained by the fixed effects).
As PG% showed a unimodal relationship with species evenness, we tested whether this was due to negative correlation between the abundance of annual grass species and the abundance of perennial grasses; i.e. that with low abundance of perennial grasses, the high abundance of annual grasses causes low species evenness. We found that the proportion of annual grasses’ biomass to total biomass (AG%) is indeed strongly negatively correlated to PG% (Spearman rank correlation, rho = −0.761, P < 0.0001, see Fig. S1 in Supplementary Figures), and that AG% also shows a humped-back relationship with species evenness (second order polynomial model, R2 = 0.337, P < 0.0001, see Fig. S2 in Supplementary Figures).
Discussion
The net effect of biodiversity on biomass production can be seen as the sum of sampling, complementarity and facilitative effects7, usually indicating a positive relationship between diversity and biomass production27,36,70, especially at a constant resource level71. Thus, our finding that species number was significantly positively correlated with standing biomass is in line with our first hypothesis and most prior studies. Roscher et al.72 found a significant relationship between total biomass production and total species richness (i.e. sown and spontaneously colonising species) both in weeded and non-weeded plots, but the relationship disappeared in the non-weeded plots when only the sown species were taken into account. This result is in accordance with our finding that total aboveground biomass is significantly affected by total species richness (considering both sown and colonising species) without weeding the plots. Conversely, no or weak effect of species richness on biomass production has also been reported37,73. Others have stated that although mixtures produce more biomass than monocultures, this effect reaches a limit at very low species richness. For example, Roscher et al.74 found that the positive effect of species richness was limited at 2 or 3 species (compared to monocultures). In contrast, in our case the positive effect of species richness on biomass production could be detected even at much higher species numbers (see Fig. 1).
Among our most interesting findings was the negative relationship between standing biomass and both species and functional evenness (FEve). Both niche complementarity and facilitative effects can be the strongest at high evenness levels75,76, as evenness determines the relative importance of inter- vs. intraspecific interactions45. Intraspecific competition is expected to be more intense than interspecific competition and the increased level of species evenness (i.e. lower variance in the abundances of different species) is usually accompanied by the decreased level of intraspecific competition77. Moreover, high functional evenness indicates effective resource utilization, which supports the development of productive communities57,78. Consequently, evenness is generally expected and reported to be positively correlated to biomass production in plant comminites39,41,79. On the contrary, the mass ratio hypothesis predicts that the rate of an ecosystem process (such as biomass production) is mostly determined by the identity and traits of dominant species44. Namely, considering uniform environmental conditions, a community can have the highest biomass production if it is strongly dominated by a highly productive species, from which it can be inferred that evenness is negatively correlated with biomass production43. Accordingly, some studies have found negative42 or no relationship75 between species evenness and biomass production. Vile et al.80 found that the biomass production of a community can be predicted from the potential relative growth rate of species weighted by their abundances, which is in line with the mass ratio hypothesis. Thus, our result that species and functional evenness both had a negative effect on standing biomass is also in line with the mass ratio hypothesis. The fact that the proportion of perennial grasses’ biomass (PG%) had a positive, although weak effect on total standing biomass, meaning that plots with a high abundance of perennial grass species were the most productive, also corroborates the mass ratio hypothesis. The negative effect of functional divergence (FDiv) on standing biomass may further strengthen this relationship, possibly indicating that the trait values of perennial grasses are close to the centre of the community trait space; thus, high abundance of these species causes low FDiv.
The perennial grass functional group played a key role in determining not only biomass production, but also species diversity, species evenness and functional richness (FRic) and functional divergence (FDiv). In line with our second hypothesis, species number and functional richness decreased with the increasing abundance of perennial grasses, but species evenness and PG% showed a humped-back relationship. As we demonstrated, this was caused by the abundance of perennial grasses (mostly Festuca rupicola, F. pseudovina and Poa angustifolia) being strongly negatively correlated to the abundance of annual grasses (mostly Bromus mollis). Thus, the high abundance of annual grasses resulted in low evenness in plots with a low abundance of perennial grasses, while evenness reached the highest values in plots where neither perennial nor annual grasses had high abundance. In this case annual grasses such as Bromus mollis could take over the role of perennial grasses in the community regarding biomass production.
The fact that species and functional richness (FRic) were positively correlated to standing biomass emphasises the importance of biodiversity in the maintenance of primary production and demonstrates that complementary effects probably influenced biomass production. Although complementarity effects are usually considered to be of more importance than sampling effects29,81, some studies found biodiversity effects to be more strongly associated with sampling or dominance effects than with complementarity48,82. In our experiment, sampling effects may have been more important in determining biomass production than complementarity effects, because species and functional evenness were negatively correlated with community biomass and plots with a high abundance of productive perennial grasses generally had more biomass.
In field studies it is rather difficult to find a wide range of diversity under homogeneous environmental conditions. Thus, field studies without experimental manipulation of diversity are usually confounded by differing environmental conditions5,35. On the contrary, greenhouse and mesocosm experiments have the advantage of uniform conditions, but they usually use species numbers that are considerably lower than in a natural community39,81,83, and because of the small scale of the experiments the validity of the results to natural ecosystems is limited. We have overcome these obstacles by experimentally manipulating diversity and evenness under homogeneous field conditions. This way, the range of diversity was broad enough with uniform environmental conditions. Thus, the scale of ecological processes was also more meaningful for natural ecosystems35,84.
Biodiversity is likely to determine ecosystem functions more strongly when positive interactions among species (facilitation or complementary resource use) drive the function in question, such as biomass production. In such cases decreased dominance and increased evenness can result in the increase of this function43. On the contrary, if the identity and traits of the dominant species are more important for an ecosystem process such as biomass production, strong dominance accompanied by low evenness can result in higher biomass production85,86. In this case it seems that both diversity and dominance effects are important determinants of biomass production. Our results emphasise that although facilitative and complementarity effects can play a key role in determining ecosystem functions, thus conserving biodiversity is indispensable to maintain them, we should not underestimate the importance of dominance effects.
Supplementary information
Acknowledgements
We would like to thank Emmeline Topp for the linguistic corrections. We are also grateful to S. Radócz, B. Kelbert and E. Tóth for their help in sample sorting, and to I. Kapocsi and L. Gál for their support regarding study site selection and for the consultations. OTKA K 116639 (BT), NKFI KH 126477 (BT), NKFIH K 119225 (PT), OTKA PD 115627 (BD), OTKA PD 111807 (OV), NKFI FK 124404 (OV), NKFI KH 126476 (OV), NKFI ERC-16-M 127070 (OV), NKFIH PD 124548 (TM) and NKFI PD 128302 (KT). JS was supported by NTP-NFTÖ-18-B by the Ministry of Human Capacities. BD and OV were supported by the Bolyai János Research Scholarship of the Hungarian Academy of Sciences. BD and OV were supported by the ÚNKP-17-4-III-DE-160 and ÚNKP-17-4-III-DE-151 New National Excellence Program of the Ministry of Human Capacities.
Author Contributions
O.V., B.T. and P.T. conceived the ideas and designed methodology; J.S., A.K., O.V., B.D., R.K., K.T. and T.M. collected the data; J.S. and A.K. analysed the data; J.S. led the writing of the manuscript and all authors contributed critically to the drafts and gave final approval for publication.
Data Availability
All data are available in the Supplementary Datasets.
Competing Interests
The authors declare no competing interests.
Footnotes
Publisher’s note: Springer Nature remains neutral with regard to jurisdictional claims in published maps and institutional affiliations.
Electronic supplementary material
Supplementary information accompanies this paper at 10.1038/s41598-018-37190-6.
References
- 1.Singh JS. The biodiversity crisis: A multifaceted review. Curr. Sci India. 2002;82:638–647. [Google Scholar]
- 2.Tilman D. The ecological consequences of changes in biodiversity: a search for general principles. Ecol. 1999;80:1455–1474. [Google Scholar]
- 3.Loreau M, et al. Biodiversity and ecosystem functioning: current knowledge and future challenges. Science. 2001;294:804–808. doi: 10.1126/science.1064088. [DOI] [PubMed] [Google Scholar]
- 4.Morin X, et al. Long-term response of forest productivity to climate change is mostly driven by change in tree species composition. Sci. Rep. 2018;8:5627. doi: 10.1038/s41598-018-23763-y. [DOI] [PMC free article] [PubMed] [Google Scholar]
- 5.Cardinale BJ, et al. Impacts of plant diversity on biomass production increase through time because of species complementarity. P. Natl. Acad. Sci. USA. 2007;104:18123–18128. doi: 10.1073/pnas.0709069104. [DOI] [PMC free article] [PubMed] [Google Scholar]
- 6.Naeem S, Håkansson K, Lawton JH, Crawley MJ, Thompson LJ. Biodiversity and plant productivity in a model assemblage of plant species. Oikos. 1996;76:259–264. doi: 10.2307/3546198. [DOI] [Google Scholar]
- 7.Loreau M, Hector A. Partitioning selection and complementarity in biodiversity experiments. Nature. 2001;412:72–76. doi: 10.1038/35083573. [DOI] [PubMed] [Google Scholar]
- 8.Adler PB, et al. Productivity is a poor predictor of plant species richness. Science. 2011;333:1750–1753. doi: 10.1126/science.1204498. [DOI] [PubMed] [Google Scholar]
- 9.Fraser LH, et al. Worldwide evidence for a unimodal relationship between productivity and plant species richness. Science. 2015;349:302–305. doi: 10.1126/science.aab3916. [DOI] [PubMed] [Google Scholar]
- 10.Gross K, Cardinale BJ. Does species richness drive community production or vice versa? Reconciling historical and contemporary paradigms in competitive communities. Amer. Nat. 2007;170:207–220. doi: 10.1086/518950. [DOI] [PubMed] [Google Scholar]
- 11.Al-Mufti MM, Sydes CL, Furness SB, Grime JP, Band SR. A quantitative analysis of shoot phenology and dominance in herbaceous vegetation. J. Ecol. 1977;65:759–791. doi: 10.2307/2259378. [DOI] [Google Scholar]
- 12.Wheeler BD, Giller KE. Species richness of herbaceous fen vegetation in Broadland, Norfolk in relation to the quantity of above-ground plant material. J. Ecol. 1982;70:179–200. doi: 10.2307/2259872. [DOI] [Google Scholar]
- 13.Kelemen A, Török P, Valkó O, Miglécz T, Tóthmérész B. Mechanisms shaping plant biomass and species richness: plant strategies and litter effect in alkali and loess grasslands. J. Veg. Sci. 2013;24:1195–1203. doi: 10.1111/jvs.12027. [DOI] [Google Scholar]
- 14.Mittelbach GG, et al. What is the observed relationship between species richness and productivity? Ecology. 2001;82:2381–2396. doi: 10.1890/0012-9658(2001)082[2381:WITORB]2.0.CO;2. [DOI] [Google Scholar]
- 15.Cerabolini B, et al. Why are many anthropogenic agroecosystems particularly species-rich? Plant Biosyst. 2016;150:550–557. doi: 10.1080/11263504.2014.987848. [DOI] [Google Scholar]
- 16.Grace JB, et al. Response to Comment on “Productivity is a poor predictor of plant species richness”. Science. 2012;335:1441. doi: 10.1126/science.1214939. [DOI] [PubMed] [Google Scholar]
- 17.Tilman D, Wedin D, Knops J. Productivity and sustainability influenced by biodiversity in grassland ecosystems. Nature. 1996;379:718–720. doi: 10.1038/379718a0. [DOI] [Google Scholar]
- 18.Spehn EM, et al. Ecosystem effects of biodiversity manipulations in European grasslands. Ecol. Monogr. 2005;75:37–63. doi: 10.1890/03-4101. [DOI] [Google Scholar]
- 19.van Ruijven J, Berendse F. Diversity–productivity relationships: initial effects, long-term patterns, and underlying mechanisms. Proc. Nat. Acad. Sci. USA. 2005;102:695–700. doi: 10.1073/pnas.0407524102. [DOI] [PMC free article] [PubMed] [Google Scholar]
- 20.Cardinale BJ, Bennett DM, Nelson CE, Gross K. Does productivity drive diversity or vice versa? A test of the multivariate productivity–diversity hypothesis in streams. Ecology. 2009;90:1227–1241. doi: 10.1890/08-1038.1. [DOI] [PubMed] [Google Scholar]
- 21.Hector A. The effect of diversity on productivity: detecting the role of species complementarity. Oikos. 1998;82:597–599. doi: 10.2307/3546380. [DOI] [Google Scholar]
- 22.Naeem S, Thompson LJ, Lawler SP, Lawton JH, Woodfin RM. Declining biodiversity can alter the performance of ecosystems. Nature. 1994;368:734–737. doi: 10.1038/368734a0. [DOI] [Google Scholar]
- 23.Kelemen A, et al. Both facilitation and limiting similarity shape the species coexistence in dry alkali grasslands. Ecol. Complex. 2015;21:34–38. doi: 10.1016/j.ecocom.2014.11.004. [DOI] [Google Scholar]
- 24.Kelemen A, et al. Net outcome of competition and facilitation in a wet meadow changes with plant’s life stage and community productivity. Preslia. 2015;87:347–361. [Google Scholar]
- 25.Loreau M. Separating sampling and other effects in biodiversity experiments. Oikos. 1998;82:600–602. doi: 10.2307/3546381. [DOI] [Google Scholar]
- 26.Lepš J, de Bello F, Lavorel S, Berman S. Quantifying and interpreting functional diversity of natural communities: practical considerations. Preslia. 2006;78:481–501. [Google Scholar]
- 27.Roscher C, et al. Overyielding in experimental grassland communities–irrespective of species pool or spatial scale. Ecol. Lett. 2005;8:419–429. doi: 10.1111/j.1461-0248.2005.00736.x. [DOI] [Google Scholar]
- 28.Hector A, et al. Plant diversity and productivity experiments in European grasslands. Science. 1999;286:1123–1127. doi: 10.1126/science.286.5442.1123. [DOI] [PubMed] [Google Scholar]
- 29.Tilman D, et al. Diversity and productivity in a long-term grassland experiment. Science. 2001;294:843–845. doi: 10.1126/science.1060391. [DOI] [PubMed] [Google Scholar]
- 30.Mason NW, Mouillot D, Lee WG, Wilson JB. Functional richness, functional evenness and functional divergence: the primary components of functional diversity. Oikos. 2005;111:112–118. doi: 10.1111/j.0030-1299.2005.13886.x. [DOI] [Google Scholar]
- 31.Bílá K, et al. Disentangling community functional components in a litter‐macrodetritivore model system reveals the predominance of the mass ratio hypothesis. Ecol. Evol. 2014;4:408–416. doi: 10.1002/ece3.941. [DOI] [PMC free article] [PubMed] [Google Scholar]
- 32.Díaz S, Cabido M. Vive la difference: plant functional diversity matters to ecosystem processes. Trends Ecol. Evol. 2001;16:646–655. doi: 10.1016/S0169-5347(01)02283-2. [DOI] [Google Scholar]
- 33.Hooper DU, et al. Effects of biodiversity on ecosystem functioning: a consensus of current knowledge. Ecol. Monogr. 2005;75:3–35. doi: 10.1890/04-0922. [DOI] [Google Scholar]
- 34.Marquard E, et al. Plant species richness and functional composition drive overyielding in a six-year grassland experiment. Ecology. 2009;90:3290–3302. doi: 10.1890/09-0069.1. [DOI] [PubMed] [Google Scholar]
- 35.Balvanera P, et al. Quantifying the evidence for biodiversity effects on ecosystem functioning and services. Ecol. Lett. 2006;9:1146–1156. doi: 10.1111/j.1461-0248.2006.00963.x. [DOI] [PubMed] [Google Scholar]
- 36.Bessler H, et al. Aboveground overyielding in grassland mixtures is associated with reduced biomass partitioning to belowground organs. Ecology. 2009;90:1520–1530. doi: 10.1890/08-0867.1. [DOI] [PubMed] [Google Scholar]
- 37.Roscher C, et al. Using plant functional traits to explain diversity–productivity relationships. PLoS One. 2012;7:e36760. doi: 10.1371/journal.pone.0036760. [DOI] [PMC free article] [PubMed] [Google Scholar]
- 38.Wilsey BJ, Polley HW. Reductions in grassland species evenness increase dicot seedling invasion and spittle bug infestation. Ecol. Lett. 2002;5:676–684. doi: 10.1046/j.1461-0248.2002.00372.x. [DOI] [Google Scholar]
- 39.Kirwan L, et al. Evenness drives consistent diversity effects in intensive grassland systems across 28 European sites. J. Ecol. 2007;95:530–539. doi: 10.1111/j.1365-2745.2007.01225.x. [DOI] [Google Scholar]
- 40.Schmitz M, et al. Consistent effects of biodiversity on functioning under varying density and evenness. Folia Geobot. 2013;48:335–353. doi: 10.1007/s12224-013-9177-x. [DOI] [Google Scholar]
- 41.Nijs I, Roy J. How important are species richness, species evenness and interspecific differences to productivity? A mathematical model. Oikos. 2000;88:57–66. doi: 10.1034/j.1600-0706.2000.880107.x. [DOI] [Google Scholar]
- 42.Mulder CPH, et al. Species evenness and productivity in experimental plant communities. Oikos. 2004;107:50–63. doi: 10.1111/j.0030-1299.2004.13110.x. [DOI] [Google Scholar]
- 43.Hillebrand H, Bennett DM, Cadotte MW. Consequences of dominance: a review of evenness effects on local and regional ecosystem processes. Ecology. 2008;89:1510–1520. doi: 10.1890/07-1053.1. [DOI] [PubMed] [Google Scholar]
- 44.Grime JP. Benefits of plant diversity to ecosystems: immediate, filter and founder effects. J. Ecol. 1998;86:902–910. doi: 10.1046/j.1365-2745.1998.00306.x. [DOI] [Google Scholar]
- 45.Schwartz MW, et al. Linking biodiversity to ecosystem function: implications for conservation ecology. Oecologia. 2000;122:297–305. doi: 10.1007/s004420050035. [DOI] [PubMed] [Google Scholar]
- 46.Wilsey BJ, Polley HW. Realistically low species evenness does not alter grassland species-richness–productivity relationships. Ecology. 2004;85:2693–2700. doi: 10.1890/04-0245. [DOI] [Google Scholar]
- 47.van Rooijen NM, et al. Plant species diversity mediates ecosystem stability of natural dune grasslands in response to drought. Ecosystems. 2015;18:1383–1394. doi: 10.1007/s10021-015-9905-6. [DOI] [Google Scholar]
- 48.Valkó O, et al. Filling up the gaps—Passive restoration does work on linear landscape elements. Ecol. Eng. 2017;102:501–508. doi: 10.1016/j.ecoleng.2017.02.024. [DOI] [Google Scholar]
- 49.Lukács BA, et al. Rainfall fluctuations and vegetation patterns in alkali grasslands—self-organizing maps in vegetation analysis. Tuexenia. 2015;35:381–397. [Google Scholar]
- 50.Deák B, et al. Micro-topographic heterogeneity increases plant diversity in old stages of restored grasslands. Basic Appl. Ecol. 2015;16:291–299. doi: 10.1016/j.baae.2015.02.008. [DOI] [Google Scholar]
- 51.Borhidi, A., Kevey, B. & Lendvai, G. Plant Communities of Hungary. (Akadémiai Kiadó, 2012).
- 52.Deák B, et al. Fine-scale vertical position as an indicator of vegetation in alkali grasslands - case study based on remotely sensed data. Flora. 2014;209:693–697. doi: 10.1016/j.flora.2014.09.005. [DOI] [Google Scholar]
- 53.Bezemer TM, van der Putten WH. Ecology: Diversity and stability in plant communities. Nature. 2007;446:E6. doi: 10.1038/nature05749. [DOI] [PubMed] [Google Scholar]
- 54.Jenkins DG, Pierce S. General allometric scaling of net primary production agrees with plant adaptive strategy theory has tipping points. J. Ecol. 2017;105:1094–1104. doi: 10.1111/1365-2745.12726. [DOI] [Google Scholar]
- 55.Király, G. Új magyar füvészkönyv. Magyarország hajtásos növényei. (Aggteleki Nemzeti Park Igazgatóság, 2009).
- 56.Mouchet MA, Villéger S, Mason NW, Mouillot D. Functional diversity measures: an overview of their redundancy and their ability to discriminate community assembly rules. Funct. Ecol. 2010;24:867–876. doi: 10.1111/j.1365-2435.2010.01695.x. [DOI] [Google Scholar]
- 57.Villéger S, Mason NWH, Mouillot D. New multidimensional functional diversity indices for a multifaceted framework in functional ecology. Ecology. 2008;89:2290–2301. doi: 10.1890/07-1206.1. [DOI] [PubMed] [Google Scholar]
- 58.Westoby M. A leaf-height-seed (LHS) plant ecology strategy scheme. Plant Soil. 1998;199:213–227. doi: 10.1023/A:1004327224729. [DOI] [Google Scholar]
- 59.Laliberté E, Legendre P. A distance‐based framework for measuring functional diversity from multiple traits. Ecology. 2010;91:299–305. doi: 10.1890/08-2244.1. [DOI] [PubMed] [Google Scholar]
- 60.R Development Core Team. R: A language and environment for statistical computing. (R Foundation for Statistical Computing, Vienna, Austria; 2017).
- 61.Török P, et al. New thousand-seed weight records of the Pannonian flora and their application in analysing social behaviour types. Acta Bot. Hung. 2013;55:429–472. doi: 10.1556/ABot.55.2013.3-4.17. [DOI] [Google Scholar]
- 62.Török P, et al. New measurements of thousand-seed weights of species in the Pannonian flora. Acta Bot. Hung. 2016;58:187–198. doi: 10.1556/034.58.2016.1-2.10. [DOI] [Google Scholar]
- 63.Kleyer M, et al. The LEDA Traitbase: A database of life-history traits of Northwest European flora. J. Ecol. 2008;96:1266–1274. doi: 10.1111/j.1365-2745.2008.01430.x. [DOI] [Google Scholar]
- 64.Bates D, Mächler M, Bolker B, Walker S. Fitting linear mixed-effects models using lme4. J. Stat. Softw. 2015;67:1–48. doi: 10.18637/jss.v067.i01. [DOI] [Google Scholar]
- 65.Dormann C, et al. Collinearity: a review of methods to deal with it and a simulation study evaluating their performance. Ecography. 2012;36:27–46. doi: 10.1111/j.1600-0587.2012.07348.x. [DOI] [Google Scholar]
- 66.Barton, K. MuMIn: multi-model inference. R package version 1.0. (R Foundation for Statistical Computing, 2011).
- 67.Nakagawa S, Schielzeth H. A general and simple method for obtaining R2 from generalized linear mixed-effects models. Methods in Ecology and Evolution. 2013;4:133–142. doi: 10.1111/j.2041-210x.2012.00261.x. [DOI] [Google Scholar]
- 68.Akaike, H. In Selected Papers of Hirotugu Akaike Information theory and an extension of the maximum likelihood principle. (eds Parzen, E., Tanabe, K. & Kitagawa, G). 199–213 (Springer, 1998).
- 69.Burnham, K. P. & Anderson, D. R. Model Selection and Multimodel Inference: A Practical Information-Theoretic Approach. (Springer-Verlag, 2002).
- 70.Zhou Z, Sun OJ, Huang J, Gao Y, Han X. Land use affects the relationship between species diversity and productivity at the local scale in a semi‐arid steppe ecosystem. Funct. Ecol. 2006;20:753–762. doi: 10.1111/j.1365-2435.2006.01175.x. [DOI] [PMC free article] [PubMed] [Google Scholar]
- 71.Chalamandrier L, Albouy C, Pellissier L. Species pool distributions along functional trade-offs shape plant productivity–diversity relationships. Sci. Rep. 2017;7:15405. doi: 10.1038/s41598-017-15334-4. [DOI] [PMC free article] [PubMed] [Google Scholar]
- 72.Roscher C, Temperton VM, Buchmann N, Schulze ED. Community assembly and biomass production in regularly and never weeded experimental grasslands. Acta Oecol. 2009;35:206–217. doi: 10.1016/j.actao.2008.10.003. [DOI] [Google Scholar]
- 73.Drake JM. Why does grassland productivity increase with species richness? Disentangling species richness and composition with tests for overyielding and superyielding in biodiversity experiments. Proc. Roy. Soc. B-Biol. Sci. 2003;270:1713–1719. doi: 10.1098/rspb.2003.2423. [DOI] [PMC free article] [PubMed] [Google Scholar]
- 74.Roscher C, Schumacher J, Weisser WW, Schmid B, Schulze ED. Detecting the role of individual species for overyielding in experimental grassland communities composed of potentially dominant species. Oecologia. 2007;154:535–549. doi: 10.1007/s00442-007-0846-4. [DOI] [PubMed] [Google Scholar]
- 75.Polley HW, Wilsey BJ, Derner JD. Do species evenness and plant density influence the magnitude of selection and complementarity effects in annual plant species mixtures? Ecol. Lett. 2003;6:248–256. doi: 10.1046/j.1461-0248.2003.00422.x. [DOI] [Google Scholar]
- 76.Polley HW, Wilsey BJ, Tischler CR. Species abundances influence the net biodiversity effect in mixtures of two plant species. Basic Appl. Ecol. 2007;8:209–218. doi: 10.1016/j.baae.2006.02.006. [DOI] [Google Scholar]
- 77.Tilman, D. Resource competition and community structure. (Princeton University Press, 1982). [PubMed]
- 78.Kelemen A, et al. Old-field succession revisited – New aspects revealed by trait-based analyses of perennial-crop-mediated succession. Ecol. Evol. 2017;7:1–9. doi: 10.1002/ece3.2869. [DOI] [PMC free article] [PubMed] [Google Scholar]
- 79.Wilsey BJ, Potvin C. Biodiversity and ecosystem functioning: importance of species evenness in an old field. Ecology. 2000;81:887–892. doi: 10.1890/0012-9658(2000)081[0887:BAEFIO]2.0.CO;2. [DOI] [Google Scholar]
- 80.Vile D, Shipley B, Garnier E. Ecosystem productivity can be predicted from potential relative growth rate and species abundance. Ecol. Lett. 2006;9:1061–1067. doi: 10.1111/j.1461-0248.2006.00958.x. [DOI] [PubMed] [Google Scholar]
- 81.van Ruijven J, Berendse F. Positive effects of plant species diversity on productivity in the absence of legumes. Ecol. Lett. 2003;6:170–175. doi: 10.1046/j.1461-0248.2003.00427.x. [DOI] [Google Scholar]
- 82.Robinson GR, Quinn JF, Stanton ML. Invasibility of experimental habitat islands in a California winter annual grassland. Ecology. 1995;76:786–794. doi: 10.2307/1939344. [DOI] [Google Scholar]
- 83.Kreyling J, et al. Species richness effects on grassland recovery from drought depend on community productivity in a multisite experiment. Ecol. Lett. 2017;20:1405–1413. doi: 10.1111/ele.12848. [DOI] [PubMed] [Google Scholar]
- 84.Grace JB, et al. Does species diversity limit productivity in natural grassland communities? Ecol. Lett. 2007;10:680–689. doi: 10.1111/j.1461-0248.2007.01058.x. [DOI] [PubMed] [Google Scholar]
- 85.Mokany K, Ash J, Roxburgh S. Functional identity is more important than diversity in influencing ecosystem processes in a temperate native grassland. J. Ecol. 2008;96:884–893. doi: 10.1111/j.1365-2745.2008.01395.x. [DOI] [Google Scholar]
- 86.Roscher C, et al. A functional trait-based approach to understand community assembly and diversity–productivity relationships over 7 years in experimental grasslands. Persp. Plant Ecol. Evol. Syst. 2013;15:139–149. doi: 10.1016/j.ppees.2013.02.004. [DOI] [Google Scholar]
Associated Data
This section collects any data citations, data availability statements, or supplementary materials included in this article.
Supplementary Materials
Data Availability Statement
All data are available in the Supplementary Datasets.


