Abstract
Hypoxia-related gene (HRG) expression is associated with survival outcomes of colorectal cancer (CRC). Our aim was developing a nomogram predicting CRC overall survival (OS) with HRGs and clinicopathological factors. The Cancer Genome Atlas (TCGA) database was used as discovery cohort and two Gene Expression Omnibus databases (GSE39582 and GSE41258) served as validation cohorts. A genetic risk score model prognosticating OS was developed using mRNA expression level of HRGs. Nomogram predicting OS was developed using genetic risk score model and clinicopathological variables. The genetic risk score model included four HRGs (HSPA1L, PUM1, UBE2D2, and HSP27) and successfully prognosticated OS of discovery and two validation cohorts (p < 0.001 for TCGA discovery set, p < 0.003 for the GSE39582 and p = 0.042 for the GSE41258 datasets). Nomogram included genetic risk score, age, and TNM stage. Harrell’s concordance indexes of the nomogram were higher than those of TNM stage alone in the discovery set (0.77 vs. 0.69, p < 0.001), GSE39582 (0.65 vs. 0.63, p < 0.001), and GSE41258 datasets (0.78 vs. 0.77, p < 0.001). Our nomogram successfully predicted OS of CRC patients. The mRNA expression level of the HRGs might be useful as an ancillary marker for prognosticating CRC outcome.
Introduction
Globally, colorectal cancer (CRC) is the second most common cause of cancer related mortality and the fourth most frequently diagnosed malignancy1. Treatment plans and clinical outcomes of CRC are primarily based on well documented conventional clinicopathologic risks and prognostic factors such as age, tumor stage, diet, alcohol consumption or smoking etc2,3. With the recent progress in genetic profiling including microsatellite instability, molecular signature, and oncogene analysis, new prognostic data for treatment of CRC have now become more diverse4,5.
Hypoxic tumor microenvironments are associated with poor outcomes and survival6,7. Hypoxic foci are formed when cancer cell metabolic requirements surpass the intravascular oxygen availability of a tumor. Genes whose expression changes are triggered under such conditions are referred to as hypoxia-related genes (HRG)7. Their prognostic abilities on outcome of major malignancies such as breast or gastric cancer have been well documented8,9. Prolific research has been conducted on the prognostic and predictive values of molecular profiles associated with hypoxia and CRC survival outcomes7,10–12.
Although the role of HRG expression on outcome prediction in CRC has been demonstrated, most studies lack systematic methodology and focus primarily on separate gene expression and its correlation with CRC outcomes regardless of the clinical setting13–17. The aim of this study was to formulate a nomogram to predict overall survival (OS) of CRC using a genetic risk score which is based on the mRNA expression level of HRGs, as well as clinicopathological variables.
Results
Baseline characteristics
The discovery TCGA cohort consisted of 355 patients who were diagnosed with CRC at a mean age of 64.5 years and followed-up for a median and mean interval of 22 months (0–148 months) and 31 months, respectively. The validation GSE39582 cohort consisted of 557 patients who were diagnosed at a mean age of 66.8 years and followed-up for a median and mean interval of 52 months (0–201 months) and 57 months, respectively. The validation GSE41258 cohort included 185 patients who were diagnosed at a mean age of 63.5 years and followed-up for a median and mean interval of 66 months (0–203 months) and 68 months, respectively (Table 1).
Table 1.
Patient characteristics of datasets.
| Discovery cohort | Validation cohort | Validation cohort | |||
|---|---|---|---|---|---|
| TCGA (n = 355) | GSE39582 (n = 557) | GSE41258 (n = 185 | |||
| Characteristic | n (%) | Characteristic | n (%) | Characteristic | n (%) |
| Age at diagnosis | Age at diagnosis | Age at diagnosis | |||
| Mean (SD) | 64.5 (13.3) | Mean (SD) | 66.8 (13.3) | Mean (SD) | 63.5 (14.0) |
| AJCC TNM stage | AJCC TNM stage | AJCC TNM stage | |||
| I | 56 (15.8) | I | 31 (5.6) | I | 28 (15.1) |
| II | 135 (38.0) | II | 262 (47.0) | II | 50 (27.0) |
| III | 112 (31.5) | III | 204 (36.6) | III | 49 (26.5) |
| IV | 52 (14.7) | IV | 60 (10.8) | IV | 58 (31.4) |
| Survival event | Survival event | Survival event | |||
| Dead | 78 (22.0) | Dead | 190 (34.1) | Dead | 102 (55.1) |
| Alive | 277 (78.0) | Alive | 367 (65.9) | Alive | 83 (44.9) |
| Median follow-up time, months (range) | Median follow-up time, months (range) | Median follow-up time, months (range) | |||
| 22 (0–148) | 52 (0–201) | 66 (0–203) | |||
| Median time to survival event, months (range) | Median time to survival event, months (range) | Median time to survival event, months (range) | |||
| 17 (1–100) | 31 (0–183) | 34 (0–196) | |||
TCGA: The cancer genome atlas; GEO: gene expression omnibus; SD: standard deviation; AJCC: American Joint Committee on Cancer.
Genetic risk score model construction
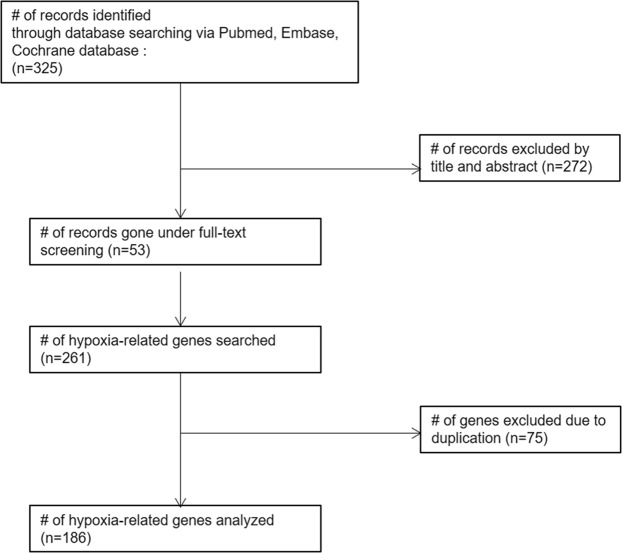
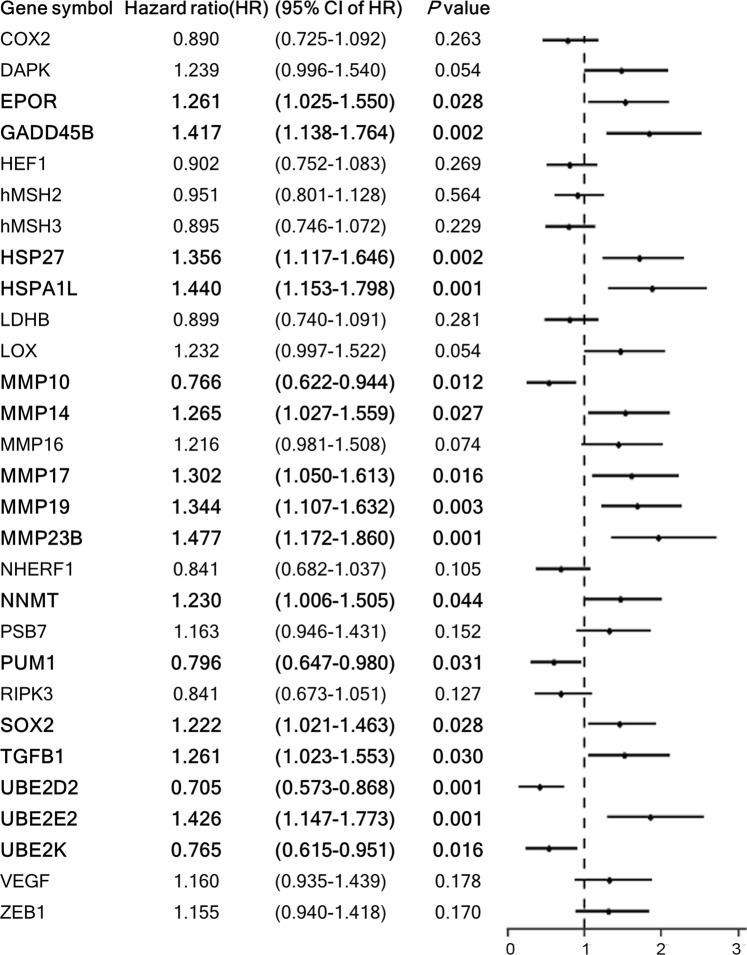
Among the 325 publications searched, 53 articles relevant to CRC gene-expression in hypoxic conditions were reviewed. One hundred and eighty-six genes were selected from the reviewed articles (Fig. 1). Twenty-nine HRGs were significantly associated with OS by log-rank test, and their relationship with OS was further investigated by univariate Cox regression, which demonstrated 16 genes to be associated with OS (Fig. 2).
Figure 1.
Gene selection flow chart.
Figure 2.
Twenty-nine hypoxia-related genes which were significantly associated with OS by log-rank test. Among them, 16 genes were associated with overall survival in univariate analysis and are highlighted in bold.
Pairwise Pearson correlation coefficients among the 16 genes revealed two gene groups that were closely related amongst each other among which the one with the highest hazard ratio (HR) was selected; EPOR and TGFB1 groups (HR for EPOR, 1.2608, was higher), and MMP23B, MMP14, MMP17, MMP19, NNMT, TGFB1, UBE2E2 cluster (MMP23B had the highest HR of 1.4766). And other genes that were not closely associated among each other (UBE2K, HSPA1L, HSP27, MMP10, SOX2, UBE2D2, PUM1) were included in the stepwise Cox regression analysis, resulting in the following genetic risk score model:
Genetic risk score = 0.520*HSPA1L −1.156*PUM1 −1.239*UBE2D2 + 0.309*HSP27 (Fig. 3).
Figure 3.
Genetic risk score model developed with 4 hypoxia-related genes.
Prognostic value of genetic risk score
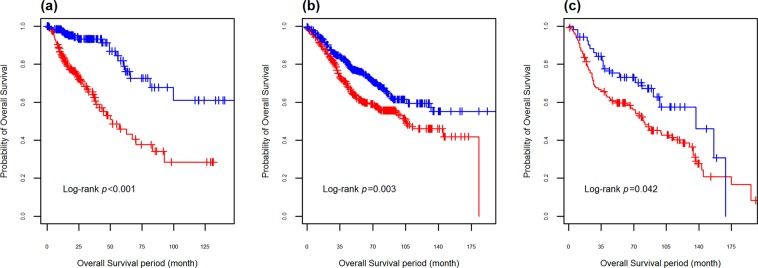
The genetic risk score was categorized at the optimal cutoff point (high risk vs. low risk) based on the receiver operating characteristics (ROC) curve. The prognostic ability of the genetic risk score model was demonstrated by the significant difference between the survival curves of the high risk and low risk group observed in both discovery (TCGA) and validation (GSE39582, GSE41258) cohorts (p < 0.001, p = 0.003 and p = 0.042) (Fig. 4).
Figure 4.
Kaplan-Meier plot of the genetic risk score (high risk vs. low risk, threshold: median score) for (a) TCGA discovery set, (b) GSE39582 validation set, and (c) GSE41258 validation set.
Incorporating clinical factors to predict cancer survival
The genetic risk score (high risk vs. low risk) was associated with OS in the univariate analysis (p < 0.001). After statistical adjustment for other variables with multivariate Cox analysis, the genetic risk score, TNM stage, and age were independently prognostic of OS (Table 2).
Table 2.
Univariate and multivariate Cox-regression results of factors related to overall survival.
| Univariate analysis | Multivariate analysis | ||||||
|---|---|---|---|---|---|---|---|
| Variables | Hazard Ratio (95% CI) | P value | Variables | Hazard Ratio (95% CI) | P value | ||
| Genetic risk score (High risk vs. low risk) | 4.221 | (2.536–7.026) | <0.001 | Genetic risk score (High risk vs. low risk) | 3.402 | (2.873–3.93) | <0.001 |
| Age | 1.025 | (1.007–1.044) | 0.006 | Age | 1.029 | (1.009–1.049) | 0.004 |
| Male gender | 1.264 | (0.805–1.985) | 0.307 | Male gender | 1.062 | (0.598–1.527) | 0.798 |
| AJCC TNM stage | <0.001 | AJCC TNM stage | <0.001 | ||||
| I | 1.000 (reference) | I | 1.000 (reference) | ||||
| II | 1.450 | (0.547–3.845) | II | 1.057 | (0.066–2.048) | ||
| III | 2.820 | (1.090–7.293) | III | 2.082 | (1.115–3.049) | ||
| IV | 6.511 | (2.461–17.225) | IV | 5.733 | (4.739–6.726) | ||
| KRAS mutation | 0.797 | (0.505–1.257) | 0.325 | KRAS mutation | 0.805 | (0.31–1.3) | 0.389 |
| BRAF mutation | 1.257 | (0.692–2.285) | 0.464 | BRAF mutation | 1.327 | (0.504–2.151) | 0.508 |
| MSI-high | 0.800 | (0.422–1.515) | 0.481 | MSI-high | 0.759 | (−0.106–1.6) | 0.526 |
AJCC: American Joint Committee on Cancer; MSI: microsatellite instability.
A set of prognostic models for OS was constructed by combining the genetic risk score (high risk vs. low risk), TNM stage, and age into the multivariate Cox regression model.
In the TCGA discovery set, Harrell’s concordance index (C-index) for the model which included TNM stage and genetic risk score was higher than that of TNM stage alone (0.75 vs. 0.69, p < 0.001). C-index for the model including age, TNM stage, and genetic risk score was higher than that of the model which included TNM stage and genetic risk score (0.77 vs. 0.75, p < 0.001).
In the GSE39582 validation set, C-index for the model which included TNM stage and genetic risk score was higher than that of TNM stage alone (0.65 vs. 0.63, p < 0.001). C-index for the model which included age, TNM stage, and genetic risk score was higher than that of the model which included TNM stage and genetic risk score (0.70 vs. 0.65, p < 0.001).
In the GSE41258 validation set, C-index for the model which included TNM stage and genetic risk score was higher than that of TNM stage alone (0.78 vs. 0.77, p < 0.001). C-index for the model which included age, TNM stage, and genetic risk score was same as that of the model which included TNM stage and genetic risk score (0.78 for both).
Nomogram including genetic risk score and clinical attributes
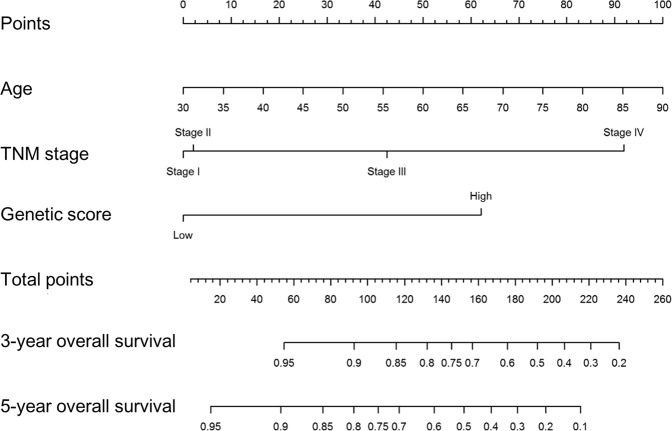
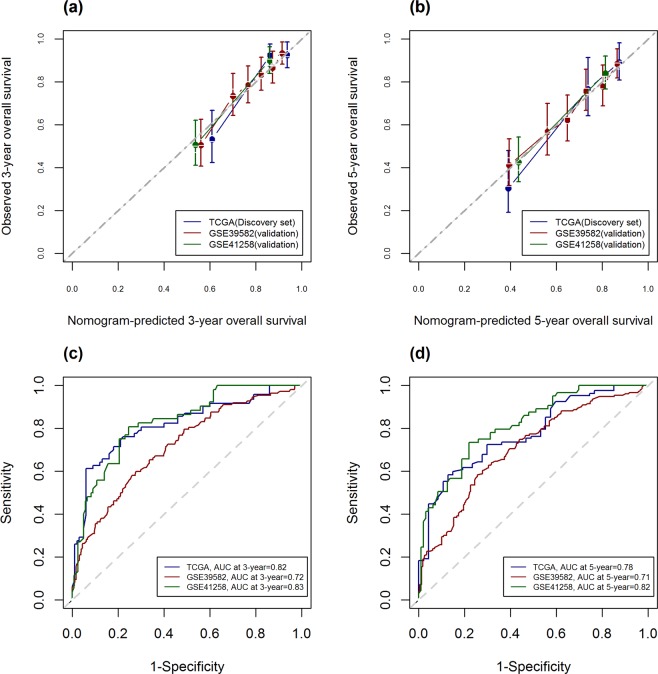
Based on the C-index values, a nomogram integrating the genetic risk score (high risk vs. low risk), age, and TNM stage was constructed (Fig. 5). Total points were calculated by adding the points of the genetic score, age, and TNM stage. The calibration curve for predicting 3 and 5-year OS indicated that the nomogram-predicted survival closely corresponded with actual survival outcomes. The 3-year nomogram’s area under curve (AUC) was 0.82 in the TCGA discovery set, 0.72 in the GSE39582 and 0.83 in the GSE41258 cohort. The 5-year nomogram’s AUC was 0.78 in the TCGA cohort, 0.71 in the GSE39582 and 0.82 in the GSE41258 cohort. (Fig. 6).
Figure 5.
Nomogram predicting 3- and 5-year overall survival of colorectal cancer patients.
Figure 6.
Calibration curve for nomogram-predicting (a) 3-year and (b) 5-year overall survival. The X-axis is nomogram-predicted survival probability and the Y-axis is observed survival probability respectively. Red, green and blue solid lines represent the performance of the nomogram relative to the 45-degree line, indicating perfect prediction. Receiver operating characteristic curves assessing the discriminating ability of the nomogram in predicting (c) 3-year and (d) 5-year overall survival.
Discussion
This study is the first to construct a nomogram of CRC OS that encompasses both clinical attributes and effect of HRGs quantified by a risk score system. Our genetic risk score and nomogram’s CRC prognostic ability was proven to be superior to conventional TNM stage for predicting prognosis in both the discovery TCGA cohort and the validation GSE39582 and GSE41258 datasets.
Hypoxia is a common feature in malignancy that promotes invasive and metastatic tumor behavior18. Expression of HRG is involved in cellular processes such as differentiation, angiogenesis, survival, migration, and metastasis19. In breast cancer, analysis of HRGs has been proposed as a tool for developing novel therapeutic strategies with molecular signatures20. The prognostic ability of HRGs is reported in many other malignancies, including gastric cancer, leukemia, and CRC8,21,22.
Our genetic risk scoring model was based upon a combination of HSPAL1L, PUM1, UBE2D2, and HSP gene mRNA expressions that were selected from among 186 HRGs to quantitatively predict the prognosis of CRC. The heat-shock 70-kDa protein-1-like (HSPA1L) gene is pivotal in tumor niche condition-induced HIF-1α activation and cellular prion protein (PrPC) regulation and leads to CRC proliferation23. The ubiquitin conjugating enzymes E2 (UBE2) gene family prevents HIF1α and 2α degradation by proteasome systems, and UBE2 inhibitors act as antitumor agents24. Abnormal pumilio RNA binding family member 1 (PUM1) gene expression is closely related to carcinogenesis and chromosomal mutations25, and heat shock protein 27 (HSP27) expression has a protective effect on hypoxic injury related umbilical cord blood-derived mesenchymal stem cell apoptosis26. Although the most researched HRG is the HIF (hypoxia-inducible factor) gene family which is important in mediating response to hypoxia at the cellular level27,28, the TCGA database indicated that mRNA expression levels of the HIF1A, HIF1B, HIF2A, and HIF3A genes were not statistically associated with OS and DFS (data not shown).
There are many published nomograms designed to predict the outcome of CRC29. A Chinese group developed a nomogram on CRC OS and recurrence-free survival for stage I~III patients30, and a French group targeted metastatic stage IV CRC patients who were refractory to chemotherapy31. The C indexes of these studies were 0.80 and 0.7, respectively. However, there is no single nomogram that encompasses the long-term OS outcome of all clinical stages of CRC. Ours is the first to included basic clinical variables integrated with a genetic risk score model of selected HRGs across all CRC stages.
The strength of this study was that we established validation sets of heterogenous patients from the GSE39582 and GSE41258 dataset to validate the generalizability of our genetic risk score model and nomogram. We believe this approach has important clinical implications because we validated the prognostic ability of the genetic risk score model and nomograms using mRNA data produced through different platforms. Discovery TCGA data was produced by RNA sequencing using the Illumina HiSeq. 2000 mRNA-Seq and the validation sets (GSE39582 and GSE41258) mRNA expression profiles were acquired by the Affymetrix microarray. Similar comparison of mRNA gene expression through different platforms in the literature further strengthens the generalizability of our results32,33.
There are several limitations to our study. One is the short follow-up period of the discovery set patients. The median follow-up period of the discovery set, which the gene risk model and nomogram was built on, was 22 months. To address the issue of the short follow-up duration, we formulated a nomogram based on both the 3-year and 5-year survival rates to better fit the median follow-up period. Another limitation is that mRNA gene expression values are not readily available especially in clinical settings due to the high cost of fresh tissue storage and processing. However, its applicability may become wider when costs decrease and mRNA expression can be stably obtained through formalin-fixed paraffin-embedded tissue. The final limitation is the inability to adjust for confounders pertaining to lifestyle factors, such as diet or smoking, operative extent and treatment modality. We could not account for these factors because TCGA and GEO databases do not provide information on them.
In conclusion, our study is the first to construct a nomogram for all stages of CRC OS encompassing both clinical and genetic variables related to HRGs. Our genetic risk score and nomogram demonstrated superior prognostic ability for CRC OS in all of the TCGA discovery and two external validation sets compared to conventional TNM staging. Considering the effect HRGs have on survival outcomes of CRC patients, our results may be applicable in the clinical setting in the near future. A more precise 5-year OS nomogram could be obtained by expanding the record duration of the discovery dataset patients with additional follow-up and subsequent modifying of our present results.
Methods
Data sources and processing
Gene mRNA expression data and related clinical information of CRC patients in the TCGA project (discovery cohort) were obtained from the CBioPortal (http://www.cbioportal.org). The mRNA-Seq data from TCGA was produced using the Illumina HiSeq 2000 platform and processed by the RNAseqV2 pipeline, which uses MapSplice for alignment and RSEM for quantification. To validate the prognostic potential of the genetic risk score, two independent datasets were obtained through the GEO database (GSE39582, GSE41258) (validation cohort, http://www.ncbi.nlm.nih.gov/geo/). Keywords “colorectal cancer” and “gene expression” were used for searching. Datasets satisfying the following criteria were considered: (1) gene expression profile data, (2) tissue samples from primary colorectal adenocarcinoma, and (3) availability of patient survival data. The GSE39582 and GSE41285 datasets, containing the largest and the second largest samples among those satisfying our criteria, were used for validation34,35. Gene expression profiles of the dataset were determined using the Affymetrix U133 Plus 2.0 chip. GSE39582 contained log2 signal intensity values and the gene expression levels of the TCGA and GSE41258 dataset were transformed to log2 scale. The median duration of record length (henceforth mentioned as follow-up period) was described in months. Information about CRC stage of both datasets was assessed according to the TNM stages specified by the 8th edition of the American Joint Committee on Cancer36. To prevent the clinical data from becoming too specific the sub-stages were not assigned.
Genetic risk score model construction
A qualitative review of literature related to CRC was conducted through the PubMed/MEDLINE database, using the following advanced search combination: (Colon OR Rectum OR Colorectal) AND (Cancer OR Neoplasm) AND Hypoxia AND Gene. Articles with relevant titles were fully reviewed for information about genes analyzed in hypoxic conditions to assess the outcome of CRC. Based on the literature, we selected appropriate genes for further analysis and construction of a genetic risk score. Among closely correlated genes (Pearson correlation coefficient r > 0.4), those with highest univariate predictive power (defined by HR per 1 standard deviation change) were selected to avoid potential collinearity37,38. To build the genetic risk score model, genes whose expression levels were significantly associated with OS were further selected through stepwise Cox regression analysis39. In the stepwise procedure, p < 0.05 was used as entry criterion and p > 0.1 as removal criterion40. The prognostic value of the genetic risk score model was assessed with both discovery and validation cohorts. The optimal cut-off point for the genetic risk score was determined based on ROC curve analysis. Hypoxia-related activities of the selected genes were confirmed using the gene ontology database (http://www.geneontology.org/).
Incorporating clinical factors to predict cancer survival
To evaluate the prognostic value of the genetic risk score in the context of other clinical variables, univariate and multivariate Cox analyses for OS were performed, including the genetic risk score and the conventional clinicopathologic variables (age, gender, TNM stage, KRAS mutation, BRAF mutation, and microsatellite instability). The discriminating ability of the multivariate Cox regression model was evaluated using the C-index41 of 1 indicating perfect discrimination and of 0.5 indicating random guess.
Nomogram construction
A nomogram was constructed to predict 3- and 5-year CRC OS by combining the results of the genetic risk score model with clinical attributes. The predictive accuracy of the nomogram was assessed by calibration plot42,43. Time-dependent sensitivities and specificities of the nomogram were evaluated by AUC for both 3-year and 5-year OS ROC curve44. All statistical analyses were performed using R statistical software (version 3.4.1)45. Nomogram and calibration plots were generated with the rms package46 and the time-dependent ROC curve analysis was conducted with the timeROC package47 of R software. Comparisons of C-index between the nomogram and American Joint Committee on Cancer staging systems were performed with the Hmisc package48 of R software. Null hypotheses of no difference were rejected if p-values were less than 0.05.
Acknowledgements
This research was supported by a grant from the National Research Foundation of Korea (NRF) funded by the Korean government (Ministry of Science, ICT & Future Planning, NRF-2016R1E1A1A01942072, http://www.nrf.re.kr/index) and the Korea Health Technology R&D Project through the Korea Health Industry Development Institute (KHIDI), funded by the Ministry of Health & Welfare, Republic of Korea (grant number: HI17C0048).
Author Contributions
Conception and design of the study: J.H.L., S.J., K.K., Y.J.C. Generation, collection, assembly, analysis and/or interpretation of data; J.H.L., S.J., S.C.H., J.H.L., E.K.C., W.S.P., E.K., R.S., K.K., Y.J.C. Drafting or revision of the manuscript; J.H.L., S.J., S.C.H., J.H.L., E.K.C., W.S.P., E.K., R.S., K.K., Y.J.C. Approval of the final version of the manuscript: J.H.L., S.J., W.S.P., E.K., R.S., K.K., Y.J.C.
Data Availability
The data that support the findings of this study are available from the Cancer Genome Atlas (TCGA, http://cancergenome.nih.gov/) COADREAD project and Gene Expression Omnibus (GEO, https://www.ncbi.nlm.nih.gov/geo/), accession number GSE39582 and GSE41258.
Competing Interests
The authors declare no competing interests.
Footnotes
Publisher’s note: Springer Nature remains neutral with regard to jurisdictional claims in published maps and institutional affiliations.
Joon-Hyop Lee and Sohee Jung contributed equally.
Contributor Information
Kwangsoo Kim, Email: kksoo@snuh.org.
Young Jun Chai, Email: kevinjoon@naver.com.
References
- 1.Day LW, Velayos F. Colorectal cancer screening and surveillance in the elderly: updates and controversies. Gut Liver. 2015;9:143–151. doi: 10.5009/gnl14302. [DOI] [PMC free article] [PubMed] [Google Scholar]
- 2.Hsing AW, et al. Risk factors for colorectal cancer in a prospective study among U.S. white men. Int J Cancer. 1998;77:549–553. doi: 10.1002/(SICI)1097-0215(19980812)77:4<549::AID-IJC13>3.0.CO;2-1. [DOI] [PubMed] [Google Scholar]
- 3.Wu AH, Paganini-Hill A, Ross RK, Henderson BE. Alcohol, physical activity and other risk factors for colorectal cancer: a prospective study. Br J Cancer. 1987;55:687–694. doi: 10.1038/bjc.1987.140. [DOI] [PMC free article] [PubMed] [Google Scholar]
- 4.Kloor M, Staffa L, Ahadova A, von Knebel Doeberitz M. Clinical significance of microsatellite instability in colorectal cancer. Langenbeck’s archives of surgery. 2014;399:23–31. doi: 10.1007/s00423-013-1112-3. [DOI] [PubMed] [Google Scholar]
- 5.Nique Carbajal C, Sanchez Renteria F, Lettiero B, Wernhoff P, Dominguez-Valentin M. [Molecular characterization of hereditary colorectal cancer in Peru] Revista de gastroenterologia del Peru: organo oficial de la Sociedad de Gastroenterologia del Peru. 2014;34:299–303. [PubMed] [Google Scholar]
- 6.Magnon C, et al. Radiation and inhibition of angiogenesis by canstatin synergize to induce HIF-1alpha-mediated tumor apoptotic switch. J Clin Invest. 2007;117:1844–1855. doi: 10.1172/JCI30269. [DOI] [PMC free article] [PubMed] [Google Scholar]
- 7.D’Ignazio, L., Batie, M. & Rocha, S. Hypoxia and Inflammation in Cancer, Focus on HIF and NF-kappaB. Biomedicines5, :10.3390/biomedicines5020021 (2017). [DOI] [PMC free article] [PubMed]
- 8.Haja Mohideen AM, et al. Examining the polymorphisms in the hypoxia pathway genes in relation to outcome in colorectal cancer. PLoS One. 2014;9:e113513. doi: 10.1371/journal.pone.0113513. [DOI] [PMC free article] [PubMed] [Google Scholar]
- 9.Gan, L. et al. Extracellular matrix protein 1 promotes cell metastasis and glucose metabolism by inducing integrin beta4/FAK/SOX2/HIF-1alpha signaling pathway in gastric cancer. Oncogene, 10.1038/onc.2017.363 (2017). [DOI] [PubMed]
- 10.Wu, Y. et al. Clinicopathologic significance of HIF-1alpha, CXCR4, and VEGF expression in colon cancer. Clin Dev Immunol2010, 10.1155/2010/537531 (2010). [DOI] [PMC free article] [PubMed]
- 11.Zhao, Z. et al. GADD45B as a Prognostic and Predictive Biomarker in Stage II Colorectal Cancer. Genes9, 10.3390/genes9070361 (2018). [DOI] [PMC free article] [PubMed]
- 12.Wang JZ, et al. Hypoxia-induced Rab11-family interacting protein 4 expression promotes migration and invasion of colon cancer and correlates with poor prognosis. Mol Med Rep. 2018;17:3797–3806. doi: 10.3892/mmr.2017.8283. [DOI] [PubMed] [Google Scholar]
- 13.Newton IP, Kenneth NS, Appleton PL, Nathke I, Rocha S. Adenomatous polyposis coli and hypoxia-inducible factor-1{alpha} have an antagonistic connection. Mol Biol Cell. 2010;21:3630–3638. doi: 10.1091/mbc.E10-04-0312. [DOI] [PMC free article] [PubMed] [Google Scholar]
- 14.Koukourakis MI, et al. Beclin 1 over- and underexpression in colorectal cancer: distinct patterns relate to prognosis and tumour hypoxia. Br J Cancer. 2010;103:1209–1214. doi: 10.1038/sj.bjc.6605904. [DOI] [PMC free article] [PubMed] [Google Scholar]
- 15.Furlan D, et al. Up-regulation of the hypoxia-inducible factor-1 transcriptional pathway in colorectal carcinomas. Hum Pathol. 2008;39:1483–1494. doi: 10.1016/j.humpath.2008.02.013. [DOI] [PubMed] [Google Scholar]
- 16.Kim SH, et al. Human enhancer of filamentation 1 Is a mediator of hypoxia-inducible factor-1alpha-mediated migration in colorectal carcinoma cells. Cancer Res. 2010;70:4054–4063. doi: 10.1158/0008-5472.CAN-09-2110. [DOI] [PMC free article] [PubMed] [Google Scholar]
- 17.Ma DF, et al. Hypoxia-inducible adenosine A2B receptor modulates proliferation of colon carcinoma cells. Hum Pathol. 2010;41:1550–1557. doi: 10.1016/j.humpath.2010.04.008. [DOI] [PubMed] [Google Scholar]
- 18.Harris AL. Hypoxia–a key regulatory factor in tumour growth. Nat Rev Cancer. 2002;2:38–47. doi: 10.1038/nrc704. [DOI] [PubMed] [Google Scholar]
- 19.Favaro E, Lord S, Harris AL, Buffa FM. Gene expression and hypoxia in breast cancer. Genome Med. 2011;3:55. doi: 10.1186/gm271. [DOI] [PMC free article] [PubMed] [Google Scholar]
- 20.El Guerrab A, et al. Quantification of hypoxia-related gene expression as a potential approach for clinical outcome prediction in breast cancer. PLoS One. 2017;12:e0175960. doi: 10.1371/journal.pone.0175960. [DOI] [PMC free article] [PubMed] [Google Scholar]
- 21.Tang W, et al. Influence of hypoxia-related genetic polymorphisms on the prognosis of patients with metastatic gastric cancer treated with EOF. Oncol Lett. 2018;15:1334–1342. doi: 10.3892/ol.2017.7414. [DOI] [PMC free article] [PubMed] [Google Scholar]
- 22.Silveira VS, et al. Hypoxia-related gene expression profile in childhood acute lymphoblastic leukemia: prognostic implications. Leuk Lymphoma. 2014;55:1751–1757. doi: 10.3109/10428194.2013.858812. [DOI] [PubMed] [Google Scholar]
- 23.Lee, J. H. et al. Role of HSPA1L as a cellular prion protein stabilizer in tumor progression via HIF-1alpha/GP78 axis. Oncogene, 10.1038/onc.2017.263 (2017). [DOI] [PubMed]
- 24.Gombodorj N, et al. Inhibition of Ubiquitin-conjugating Enzyme E2 May Activate the Degradation of Hypoxia-inducible Factors and, thus, Overcome Cellular Resistance to Radiation in Colorectal Cancer. Anticancer Res. 2017;37:2425–2436. doi: 10.21873/anticanres.11582. [DOI] [PubMed] [Google Scholar]
- 25.Guan X, et al. PUM1 promotes ovarian cancer proliferation, migration and invasion. Biochem Biophys Res Commun. 2018;497:313–318. doi: 10.1016/j.bbrc.2018.02.078. [DOI] [PubMed] [Google Scholar]
- 26.Son TW, et al. Netrin-1 protects hypoxia-induced mitochondrial apoptosis through HSP27 expression via DCC- and integrin alpha6beta4-dependent Akt, GSK-3beta, and HSF-1 in mesenchymal stem cells. Cell Death Dis. 2013;4:e563. doi: 10.1038/cddis.2013.94. [DOI] [PMC free article] [PubMed] [Google Scholar]
- 27.Vadde R, et al. Role of hypoxia-inducible factors (HIF) in the maintenance of stemness and malignancy of colorectal cancer. Crit Rev Oncol Hematol. 2017;113:22–27. doi: 10.1016/j.critrevonc.2017.02.025. [DOI] [PubMed] [Google Scholar]
- 28.Chen Z, et al. Prognostic value and clinicopathological differences of HIFs in colorectal cancer: evidence from meta-analysis. PLoS One. 2013;8:e80337. doi: 10.1371/journal.pone.0080337. [DOI] [PMC free article] [PubMed] [Google Scholar]
- 29.Kawai K, et al. Nomograms for colorectal cancer: A systematic review. World J Gastroenterol. 2015;21:11877–11886. doi: 10.3748/wjg.v21.i41.11877. [DOI] [PMC free article] [PubMed] [Google Scholar]
- 30.Ying HQ, et al. The prognostic value of preoperative NLR, d-NLR, PLR and LMR for predicting clinical outcome in surgical colorectal cancer patients. Medical oncology. 2014;31:305. doi: 10.1007/s12032-014-0305-0. [DOI] [PubMed] [Google Scholar]
- 31.Manceau G, et al. Hsa-miR-31-3p expression is linked to progression-free survival in patients with KRAS wild-type metastatic colorectal cancer treated with anti-EGFR therapy. Clin Cancer Res. 2014;20:3338–3347. doi: 10.1158/1078-0432.CCR-13-2750. [DOI] [PubMed] [Google Scholar]
- 32.Yamada A, et al. A RNA-Sequencing approach for the identification of novel long non-coding RNA biomarkers in colorectal cancer. Sci Rep. 2018;8:575. doi: 10.1038/s41598-017-18407-6. [DOI] [PMC free article] [PubMed] [Google Scholar]
- 33.Luo J, et al. Clinical value of miR-182-5p in lung squamous cell carcinoma: a study combining data from TCGA, GEO, and RT-qPCR validation. World journal of surgical oncology. 2018;16:76. doi: 10.1186/s12957-018-1378-6. [DOI] [PMC free article] [PubMed] [Google Scholar]
- 34.Marisa L, et al. Gene expression classification of colon cancer into molecular subtypes: characterization, validation, and prognostic value. PLoS Med. 2013;10:e1001453. doi: 10.1371/journal.pmed.1001453. [DOI] [PMC free article] [PubMed] [Google Scholar]
- 35.Sheffer M, et al. Association of survival and disease progression with chromosomal instability: a genomic exploration of colorectal cancer. Proc Natl Acad Sci USA. 2009;106:7131–7136. doi: 10.1073/pnas.0902232106. [DOI] [PMC free article] [PubMed] [Google Scholar]
- 36.Amin, M. B. et al. AJCC Cancer Staging Manual 8th edition. 8th edn, (Springer International Publishing, 2017).
- 37.Goliasch G, et al. Refining Long-Term Prediction of Cardiovascular Risk in Diabetes - The VILDIA Score. Sci Rep. 2017;7:4700. doi: 10.1038/s41598-017-04935-8. [DOI] [PMC free article] [PubMed] [Google Scholar]
- 38.Seagle BL, et al. Discovery of candidate tumor biomarkers for treatment with intraperitoneal chemotherapy for ovarian cancer. Sci Rep. 2016;6:21591. doi: 10.1038/srep21591. [DOI] [PMC free article] [PubMed] [Google Scholar]
- 39.Pinto JA, et al. A prognostic signature based on three-genes expression in triple-negative breast tumours with residual disease. NPJ genomic medicine. 2016;1:15015. doi: 10.1038/npjgenmed.2015.15. [DOI] [PMC free article] [PubMed] [Google Scholar]
- 40.Krebs MG, et al. Evaluation and prognostic significance of circulating tumor cells in patients with non-small-cell lung cancer. Journal of clinical oncology: official journal of the American Society of Clinical Oncology. 2011;29:1556–1563. doi: 10.1200/JCO.2010.28.7045. [DOI] [PubMed] [Google Scholar]
- 41.Uno H, Cai T, Pencina MJ, D’Agostino RB, Wei LJ. On the C-statistics for evaluating overall adequacy of risk prediction procedures with censored survival data. Statistics in medicine. 2011;30:1105–1117. doi: 10.1002/sim.4154. [DOI] [PMC free article] [PubMed] [Google Scholar]
- 42.Iasonos A, Schrag D, Raj GV, Panageas KS. How to build and interpret a nomogram for cancer prognosis. Journal of clinical oncology: official journal of the American Society of Clinical Oncology. 2008;26:1364–1370. doi: 10.1200/JCO.2007.12.9791. [DOI] [PubMed] [Google Scholar]
- 43.Zheng Y, Heagerty PJ. Prospective accuracy for longitudinal markers. Biometrics. 2007;63:332–341. doi: 10.1111/j.1541-0420.2006.00726.x. [DOI] [PubMed] [Google Scholar]
- 44.Weiser MR, Gonen M, Chou JF, Kattan MW, Schrag D. Predicting survival after curative colectomy for cancer: individualizing colon cancer staging. Journal of clinical oncology: official journal of the American Society of Clinical Oncology. 2011;29:4796–4802. doi: 10.1200/JCO.2011.36.5080. [DOI] [PMC free article] [PubMed] [Google Scholar]
- 45.R: A language and environment for statistical computing v. 3.4.1 (R Foundation for Statistical Computing, Vienna, Austria, 2016).
- 46.Rms: Regression Modeling Strategies. R Package version 5.1-2. Available at, http://CRAN.R-project.org/package=rms.
- 47.timeROC: Time-dependent ROC curve and AUC for censored survival data. R Package version 0.3. Available at, http://CRAN.R-project.org/package=timeROC.
- 48.Hmisc: Harrell Miscellaneous. R Package version 4.1-1. Available at, http://CRAN.R-project.org/package=Hmisc.
Associated Data
This section collects any data citations, data availability statements, or supplementary materials included in this article.
Data Availability Statement
The data that support the findings of this study are available from the Cancer Genome Atlas (TCGA, http://cancergenome.nih.gov/) COADREAD project and Gene Expression Omnibus (GEO, https://www.ncbi.nlm.nih.gov/geo/), accession number GSE39582 and GSE41258.


