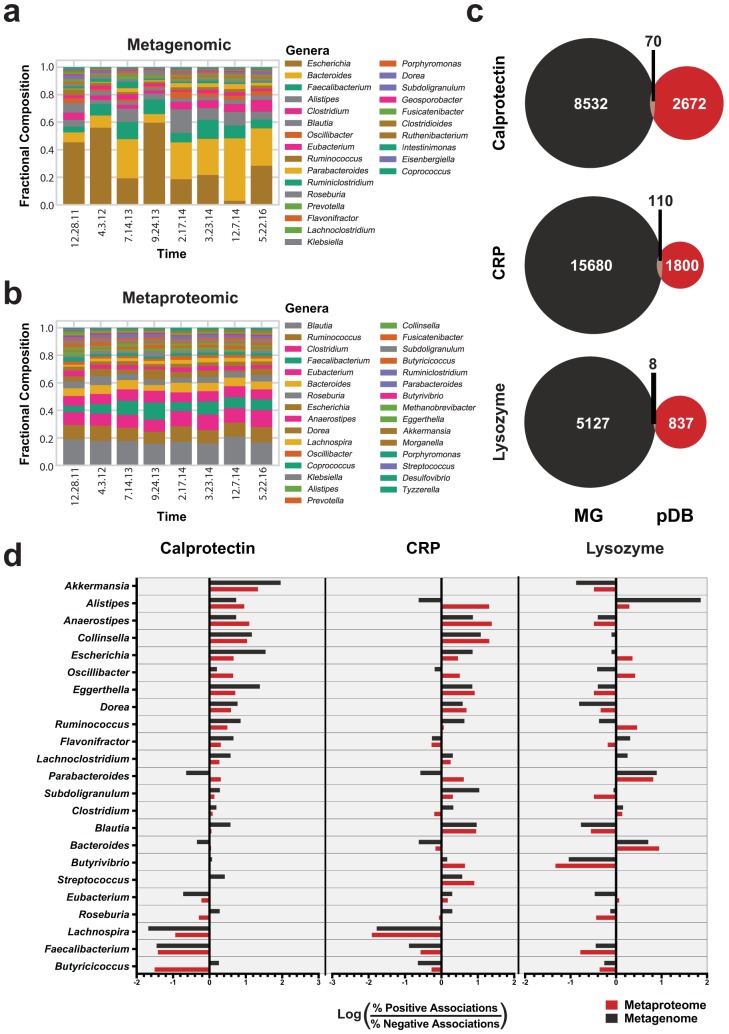
FIG 4.
Genus-level associations with clinical markers. (a and b) Bar plot displaying the fractional composition of the most abundant genera (>0.03) in the metagenome (a) and the metaproteome (b) in each of the samples analyzed. (c) Comparison of genes and proteins significantly associated with each clinical marker. Venn diagrams show the number of genes and proteins with a large effect size (|r| > 0.7) with respect to clinical markers based on linear regression. (d) Genera associated with clinical markers. The associated proteins with genus-level taxonomy analyzed as described for panel c were compared by determining the log ratios of the compositions of proteins with positive and negative associations. The log ratio is plotted on the x axis for each clinical marker, and bars represent the association with each genus. Metaproteome values are plotted in red, and metagenome values are plotted in black. The numbers of genes and proteins included in this analysis are listed in Table S2.

