Abstract.
Contrast-enhanced digital mammography (CEDM) reveals neovasculature of breast lesions in a two-dimensional contrast enhancement map. Contrast-enhanced digital breast tomosynthesis (CEDBT) provides contrast enhancement in three dimensions, which may improve lesion characterization and localization. We aim to compare CEDM and CEDBT for lesion assessment. Women with breast imaging-reporting and data system 4 or 5 suspicious breast lesion(s) were recruited in our study and were imaged with CEDM and CEDBT in succession under one breast compression. Two radiologists assessed CEDM and CEDBT with both images displayed side-by-side and compared (1) contrast enhancement of lesions and (2) lesion margin using a five-point scale ranging from (CEDM much better) to (CEDBT much better). Biopsy identified 19 malignant lesions with contrast enhancement. Our results show that CEDBT provides better lesion margins than CEDM with limited reduction in contrast enhancement. CEDBT delivers less radiation dose compared to CEDM + DBT. Synthetic CEDM can be generated from CEDBT data and provides lesion contrast enhancement comparable to CEDM. CEDBT has potential for clinical applications, such as treatment response monitoring and guidance for biopsy.
Keywords: contrast-enhanced digital breast tomosynthesis, contrast-enhanced digital mammography, synthetic contrast-enhanced digital mammography
1. Introduction
The angiogenesis of tumors that grow beyond a few millimeters has been shown to correlate with invasive breast carcinoma.1 Contrast-enhanced digital mammography (CEDM) has been developed to reveal neovasculature of breast cancer using iodinated contrast media, providing a two-dimensional (2-D) contrast enhancement map of the breast.2–12 Studies have shown that CEDM has diagnostic performance superior to full-field digital mammography (FFDM)13–17 and comparable to dynamic contrast-enhanced magnetic resonance imaging (DCE-MRI).18–21 CEDM has been investigated for tumor size assessment and neoadjuvant chemotherapy monitoring and has been compared to MRI.19,22,23 The specificity for CEDM, however, is still limited.15,24 A meta-analysis of eight studies on the diagnostic performance of CEDM showed overall specificity of 0.58 with a large variability across different studies.25 The summation effect of contrast enhancement at different depths on a 2-D projection may obscure important details of lesions and affect lesion assessment in CEDM.
Contrast-enhanced digital breast tomosynthesis (CEDBT) has been proposed to provide three-dimensional (3-D) contrast enhancement of the breast, which combines the benefits of CEDM and digital breast tomosynthesis (DBT).26,27 Great effort has been devoted to the development and optimization of CEDBT.10,28–36 The feasibility of CEDBT has also been demonstrated in a pilot clinical study using a photon-counting DBT system to allow spectral imaging in single shot with low dose.37 It has been shown that DBT provides more accurate tumor margin assessment and size measurement than FFDM.38 Similarly, CEDBT may provide more accurate details of lesions, such as lesion size, morphology, and location, compared to CEDM.
There has been limited investigation of the diagnostic performance of CEDBT. The study by Chou et al.39 evaluated the clinical performance of CEDM, CEDBT, and DCE-MRI by comparing the area under the receiver operating characteristic curves for cancer detection and showed no statistically significant improvement in diagnostic accuracy by adding CEDBT to CEDM. It raised the question whether CEDBT could downgrade the lesions seen on CEDM by providing better lesion characterizations and avoid unnecessary biopsies and whether the additional radiation dose for CEDBT could be justified by its added value to CEDM.40
The ability of CEDBT to characterize lesions has been investigated. A pilot clinical study of eight breast cancer patients evaluated the morphologic characteristics and enhancement kinetics of lesions on CEDBT in comparison with digital mammography (DM) and breast MRI, and reader assessment showed that CEDBT is qualitatively concordant with DM and breast MRI in lesion characterizations.41 A recent in-silico study simulated mass-like enhancement of lesion with various morphologies and enhancement patterns to evaluate the performance of CEDM and CEDBT, and human observer evaluation showed improved characterization of lesion shape and margin on central CEDBT slice and better characterization of enhancement pattern on CEDM.42
We believe that CEDBT has the following potential clinical applications beyond detection tasks:43 (1) better 3-D lesion characterization may benefit the evaluation of treatment response after neoadjuvant chemotherapy. (2) Coregistered 3-D contrast enhancement and anatomical information of lesions may provide better guidance for biopsy. The lesion extent can be delineated by 3-D contrast enhancement to guide the selection of biopsy sites. CEDBT may further benefit patients with dense breasts for accurate biopsy where differentiating lesions from surrounding fibroglandular tissue may be more difficult for women with extremely dense breast.44 (3) CEDBT may use less radiation dose compared to CEDM + DBT, where DBT is paired with CEDM to localize lesions.45
Synthetic mammograms can be generated from DBT data to aid lesion assessment.46–48 Similarly, it is possible to generate synthetic CEDM images from CEDBT data. Synthetic CEDM may aid the clinical transition from CEDM to CEDBT and may be used for rapid assessment of contrast enhancement prior to lesion localization in CEDBT.
In this study, we investigate the efficacy of CEDBT for lesion assessment of contrast enhancement and margin identification, and how it compares with CEDM. We also compare the radiation dose between CEDBT and CEDM + DBT. Synthetic CEDM is generated and compared with CEDM.
2. Methods
2.1. Image Acquisition
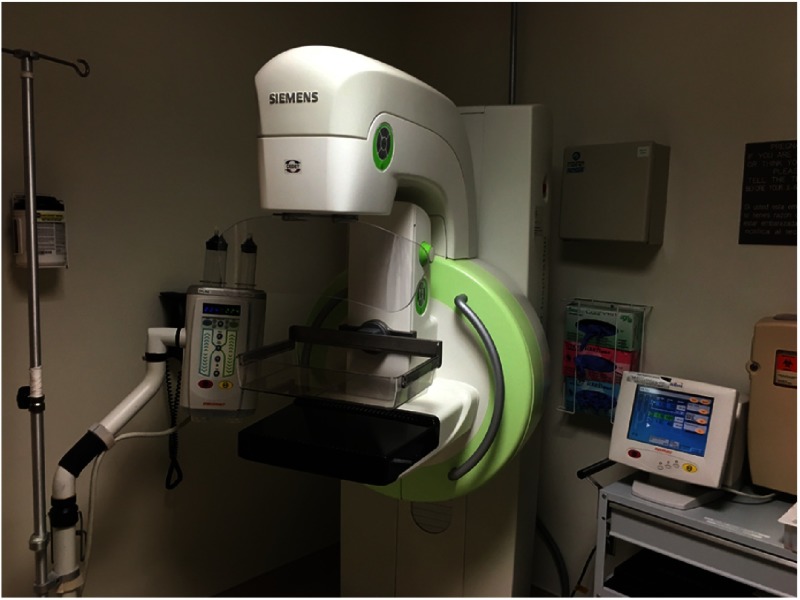
A Siemens MAMMOMAT Inspiration DBT system was modified to perform contrast-enhanced dual-energy (DE) breast imaging (Fig. 1).49 This prototype system is equipped with a tungsten (W) anode and three filter options: rhodium (Rh), copper (Cu), or titanium (Ti).50 The tube voltage ranges between 23 and 49 kVp. An amorphous selenium (-Se) direct-conversion flat-panel detector with pitch is used in the system. The -Se conversion layer in the detector has been increased to in thickness to increase the absorption efficiency for high-energy (HE) x-rays.51,52 In each DBT scan, 25 projections are acquired with an angular span of in .
Fig. 1.
Siemens MAMMOMAT Inspiration DBT system modified for contrast-enhanced DE breast imaging. (Note: The use of this investigational device is limited by US Federal law. The product is not commercially available. Due to regulatory reasons, its future availability cannot be guaranteed).
In this study, the low-energy (LE) images were acquired with W/Rh target/filter combination below the k-edge of iodine (33.2 keV), and the actual x-ray energies selected in acquisition depended on the compressed breast thickness measured by the system (Table 1). The HE images were acquired with W/Cu at 49 kVp, which was the x-ray energy optimized to image iodinated contrast agent for this system.29,53 For each DE technique, the automatic exposure control target value was determined to deliver a total dose of 1.5 mGy for a compressed breast with 4-cm thickness, and of the total dose was allocated to the HE images. While this dose allocation does not provide the maximum signal-difference-to-noise ratio (SDNR) for the detection of contrast object, SDNR is within 10% (of the maximum) and it provides a diagnostic quality LE mammogram.54,55
Table 1.
Summary of x-ray energies (kVp) for LE image acquisition.
| Compressed breast thickness (mm) | kVp |
|---|---|
| 20 to 29 | 26 |
| 30 to 39 | 27 |
| 40 to 49 | 28 |
| 50 to 59 | 29 |
| 60 to 69 | 30 |
| 70 to 79 | 31 |
| 80 to 89 | 32 |
| 90 and above | 33 |
2.2. Image Processing
2.2.1. Contrast-enhanced digital mammography
CEDM was generated via logarithmically weighted subtraction between HE and LE mammograms:56
The weighting factor was calculated using an analytical model that simulates the imaging system and the breast. The x-ray spectra were generated at 26 to 33 kVp and 49 kVp using the tungsten anode spectral model developed by Boone et al.57,58 and filtered by Rh for LE x-rays and Cu for HE x-rays. The breast was simulated as a homogenous object composed of glandular and adipose tissue. The glandularity of the breast varied from 0% to 100% at 10% intervals, and the breast thickness varied from 0 to 10 cm at 0.5 cm intervals. The detector was simulated as an energy-integrating detector with -Se conversion layer. Using this analytical model, the signal intensities under various x-ray beam qualities for various breast attenuations were calculated.
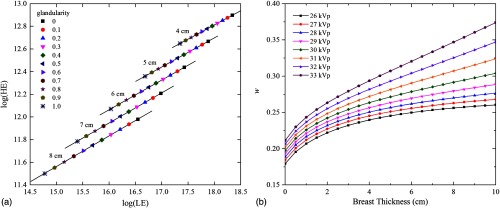
The weighting factor was calculated using the method developed by Lau et al.59,60 For an HE/LE x-ray spectral pair at a given breast density and thickness, the log signal intensity of HE x-rays was plotted against the log signal intensity of LE x-rays, as shown in Fig. 2(a). For a given breast thickness and LE spectrum (with HE fixed at 49 kVp W/Cu), linear regression was applied to the HE/LE log signal pairs at varying breast glandularities. The weighting factor was calculated as the slope of the linear fit. Figure 2(b) shows the weighting factor as a function of breast thickness for different HE/LE pairs.
Fig. 2.
(a) The plot of log signal intensity of HE spectrum (W/Cu at 49 kVp) against log signal intensity of LE spectrum (W/Rh at 28 kVp) for varying breast thicknesses (4 to 8 cm) and varying breast glandularities (0 to 1). For the HE/LE log signal at given breast thickness and varying breast glandularities, linear fit was applied and the weighting factor for that breast thickness was the slope of the linear fit. (b) Weighting factor as a function of breast thickness with different tube voltages (26 to 33 kVp) for the LE x-ray spectrum (W/Rh). The tube voltage for HE spectrum (W/Cu) was fixed at 49 kVp.
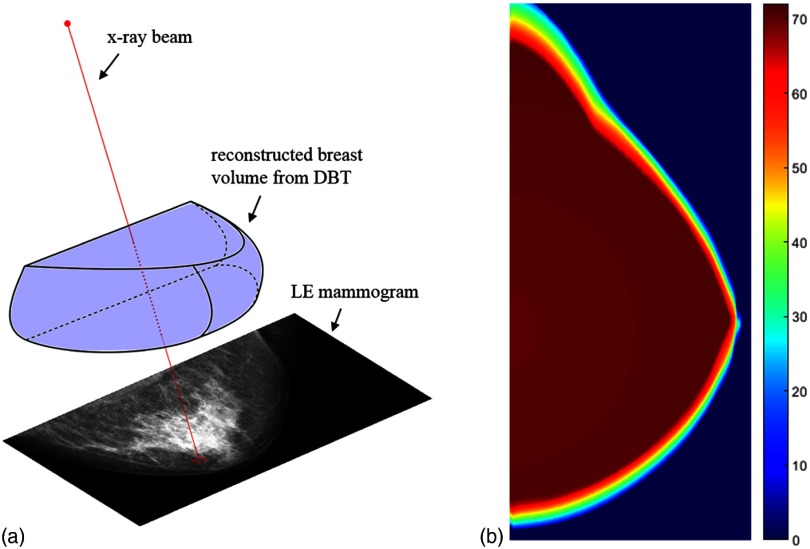
As shown in Fig. 2(b), the weighting factor depends on the breast thickness. For a compressed breast, the breast thickness decreases in the peripheral region of the breast. To account for this thickness variation, different weighting factors were applied based on an image-specific breast thickness map. In this study, the thickness map was estimated from the low-energy digital breast tomosynthesis (LE DBT) that was acquired under the same compression as the LE mammogram. The breast volume was determined by background segmentation of each image slice of the LE DBT that was stacked in 1-mm slice interval. The path of x-ray was defined by a straight line that connects each detector pixel with the x-ray source, and the length of the line segment where the x-ray path intersects the breast volume was used as the breast thickness seen by that detector pixel. As a result, a thickness map with decreasing breast thickness near the breast skin line was generated (Fig. 3). After DE subtraction with thickness-dependent weighting factors, CEDM was further processed to enhance the pixel signal intensity in the breast peripheral region using an unsharp mask filter.61
Fig. 3.
(a) Illustration of breast thickness estimation. The breast volume was determined from the LE DBT data. The thickness on the LE mammogram was estimated as the path lengths of the x-rays through the reconstructed breast volume (red dotted line). (b). Example of breast thickness map with estimated breast thicknesses ranging from 0 to 71 mm.
2.2.2. Contrast-enhanced digital breast tomosynthesis
CEDBT was generated using DE linear weighted subtraction between HE and LE DBT volumes as described in detail by Chen et al.62 Due to the fact that a logarithmic transformation was applied on the projection images before image reconstruction, a linear weighted subtraction was performed between HE and LE DBT volumes. Filtered back projection (FBP) reconstruction was used to generate HE and LE DBT with identical volume dimension with 1-mm slice thickness.63 DE subtraction was performed between two DBT slices at the same depth in HE and LE DBT and was repeated throughout the entire DBT volume. A constant weighting factor calculated for 1-mm breast thickness at a given HE/LE pair using the method described in Sec. 2.2.1 was used in DE subtraction for CEDBT.
2.2.3. Synthetic contrast-enhanced digital mammography
Synthetic CEDM was generated using the CEDBT dataset, similar to the synthetic mammogram created from the DBT dataset.46–48 DE logarithmic weighted subtraction was performed between each pair of HE/LE projection images acquired at the same projection angle during HE/LE DBT scans. As a result, a set of 25 DE-subtracted projection images was created and used to generate synthetic CEDM at the orientation parallel to the detector plane, using an algorithm identical for synthetic mammogram generation from DBT, which has been described in detail by the manufacturer (Siemens, Erlangen, Germany).64,65
2.3. Patient Study
A pilot clinical study to investigate CEDM and CEDBT was approved by our Institutional Review Board and is HIPAA compliant. Informed consent was obtained prior to the subjects’ participation in the study. Women who are above 30 years old and identified with suspicious breast lesions classified as breast imaging-reporting and data system (BI-RADS) 4 or 5 were recruited for this study and were imaged prior to their scheduled biopsy. To date, 21 subjects have been recruited for this study.
On the day of the imaging study, the subjects were screened for pregnancy and renal function. Pregnant women were excluded from the study. Premenopausal women were confirmed with a urine pregnancy test. Women with previous allergic reactions to contrast agents or compromised kidney or bladder functions were excluded from the study. Renal function of women over 65 years old was confirmed by blood urea nitrogen/creatinine test. Women with abnormal serum creatinine levels () were excluded from the study due to their compromised renal function.
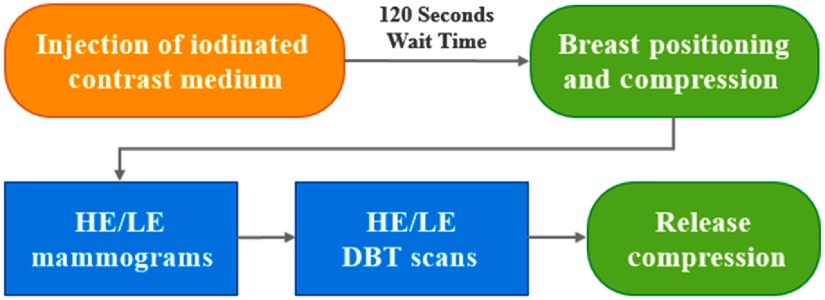
After the subject passed the screening test, the iodinated contrast medium (Omnipaque 350, GE Healthcare, Chicago, Illinois) was administered through an intravenous catheter by a power injector (Medrad Stellant, Bayer Healthcare, Whippany, New Jersey). The injection rate was with a total contrast dose of 1.5 to 2 mL per kilogram (kg) of the subject’s body weight, followed by a 25-mL saline flush. Approximately 2 min after the injection, the indicated breast with the suspicious lesion(s) was positioned and compressed (Fig. 4). The subject was seated during the entire imaging procedure. DE image pairs for CEDM and CEDBT in cranio-caudal view were acquired in sequence while the breast was under compression, and the total acquisition time was . The breast was then released from compression. If the contralateral breast was also indicated for suspicious lesions, it would be positioned and imaged immediately after the imaging of the ipsilateral breast using the same imaging procedure.
Fig. 4.
Study procedure flowchart.
2.4. Reader Assessment
Reader assessment was performed by two radiologists specialized in breast imaging with different experience (reader 1: years and reader 2: 10 years with limited experience in CEDM and DBT). The images of CEDM and CEDBT, along with the LE mammogram and DBT, were assessed to identify the indicated breast lesions. The contrast enhancement of lesions on CEDM and CEDBT was assessed individually using three scales as none, mild, or marked. The pathology results of the biopsied lesions were used as gold standard for malignancy. For malignant lesions, the radiologists evaluated CEDM and CEDBT with the images displayed side-by-side and compared (1) contrast enhancement of lesion and (2) lesion margin. A five-point scale was used for the comparison with scores ranging from (CEDM much better than CEDBT) to (CEDBT much better than CEDM). The mean score and 95% confidence interval (CI) were calculated. The enhanced lesions on CEDM and CEDBT were characterized for shape, margin, and enhancement pattern using the BI-RADS lexicon for DCE-MRI. The mean glandular dose (MGD) for each image acquisition was provided by the system using manufacturer-developed software based on a model similar to that by Dance et al.,66 which assumed homogeneous breast tissue with 50% glandularity. The total dose to generate CEDM, LE DBT, and CEDBT was extracted from the DICOM header for each individual modality, and the average MGD for all subjects was compared among different modalities.
3. Results
A total of 21 subjects participated in this study with 24 suspicious lesions. There were 17 subjects diagnosed with breast cancer, and pathology results identified 20 malignant lesions among which 15 were masses and 5 were microcalcifications. Of the 20 malignant lesions, contrast enhancement was seen for 19 lesions. One microcalcification lesion diagnosed as high-grade ductal carcinoma in situ (DCIS) showed no contrast enhancement on either CEDM or CEDBT. One microcalcification lesion diagnosed as low-grade DCIS showed mild enhancement on CEDM and no enhancement on CEDBT. Table 2 summarizes the pathologic findings and contrast enhancement on CEDM and CEDBT for all study subjects.
Table 2.
Summary of pathologic findings and contrast enhancement for all study subjects.
| Pathologic findings by lesion types | Contrast enhancement | |
|---|---|---|
| CEDM | CEDBT | |
| Mass (17) | ||
| IDC (10) | Mild (3) | Mild (4) |
| Marked (7) | Marked (6) | |
| ILC (2) | Mild (1) | Mild (1) |
| Marked (1) | Marked (1) | |
| IMC (2) | Marked (2) | Marked (2) |
| Papillary carcinoma (1) | Mild | Mild |
| Benign (2) | None (1) | None (1) |
| Mild (1) | Mild (1) | |
| Calcifications (6) | ||
| IDC (1) | Mild | Mild |
| ILC (1) | Mild | Mild |
| DCIS (3) | None (1) | None (2) |
| Mild (1) | Marked (1) | |
| Marked (1) | — | |
| Benign (1) | None | None |
| Architectural distortion (1) | ||
| Benign (1) | Mild | Mild |
Note: Number of cases is given in the parenthesis. Lesions with both invasive and noninvasive pathologic findings are grouped based on the invasive component. IDC, invasive ductal carcinoma; ILC, invasive lobular carcinoma; IMC, invasive mammary carcinoma; DCIS = ductal carcinoma in situ.
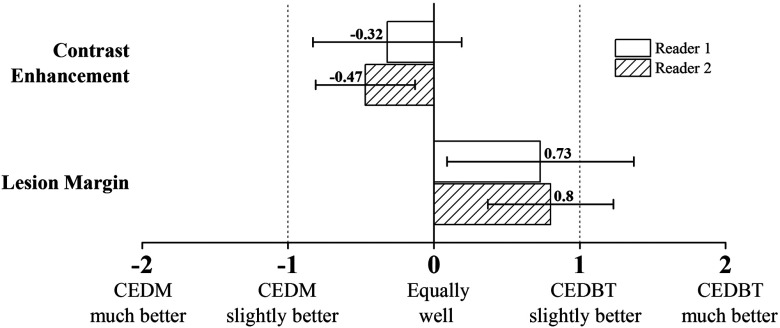
Figure 5 shows the comparison of CEDM and CEDBT for lesion assessment on a five-point scale from two readers. Contrast enhancement of lesion is compared for 19 malignant lesions with enhancement. For reader 1, the scores range from to 2 with mean score of and 95% CI . For reader 2, the scores range from to 1 with mean score of and 95% CI . Lesion margin is compared for 15 malignant mass lesions. For reader 1, the scores range from to 2 with mean score of 0.73 and 95% CI (0.09, 1.38). For reader 2, the scores range from to 2 with mean score of 0.80 and 95% CI (0.37, 1.23).
Fig. 5.
Comparison of CEDM and CEDBT for contrast enhancement of lesion and lesion margin from two readers on a five-point scale. The mean score and 95% CI are given.
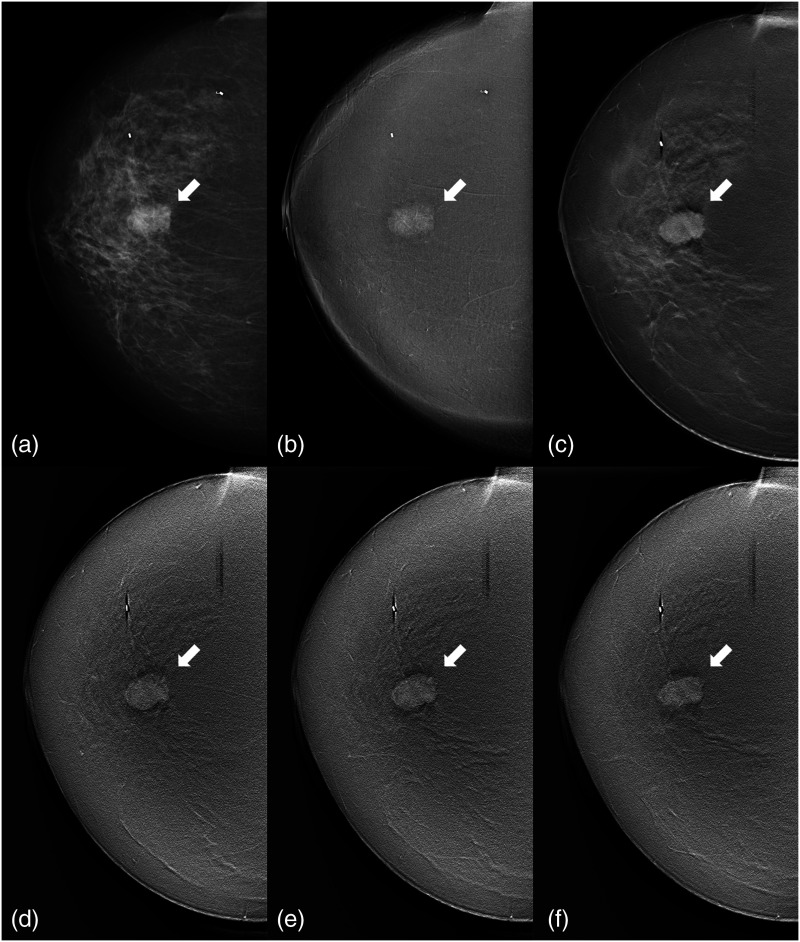
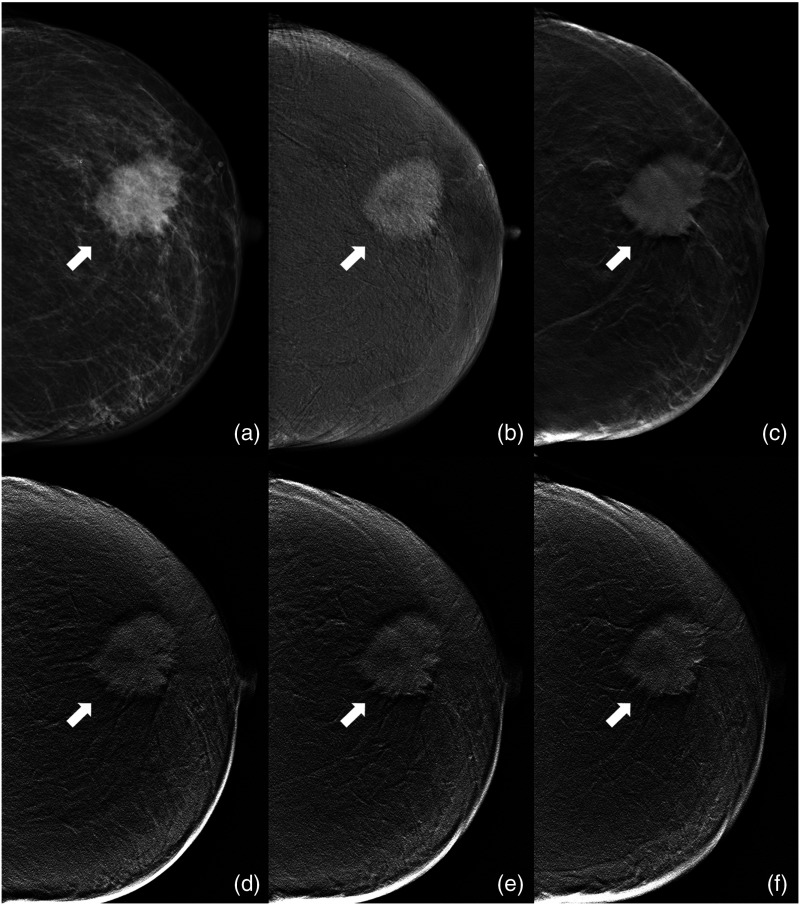
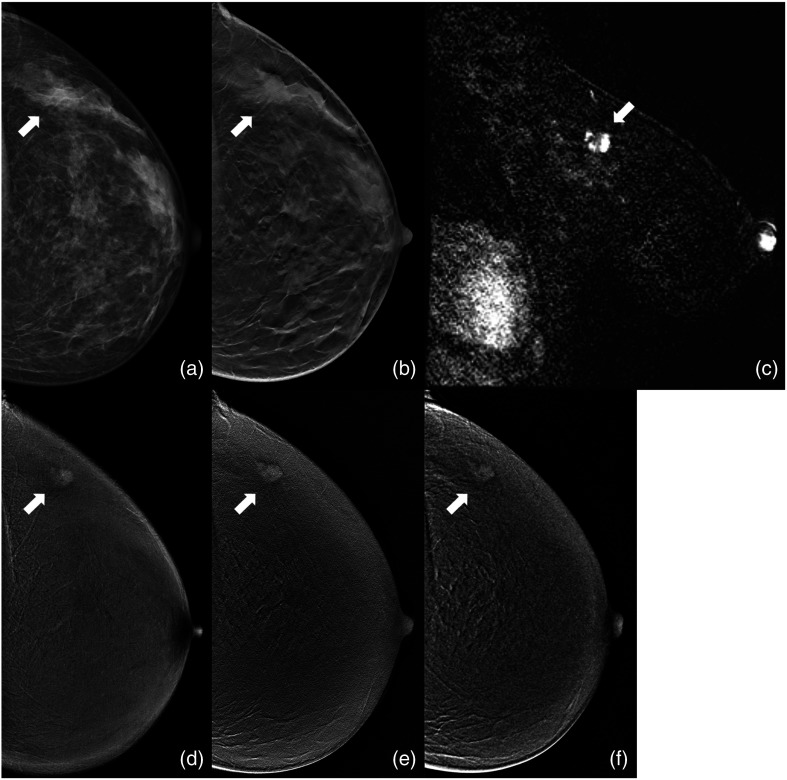
Three clinical cases are shown in Figs. 6–8. Figure 6 shows a mass lesion diagnosed with invasive ductal carcinoma (IDC) for a 61-year-old patient. The contrast enhancement of lesion is shown equally well between CEDM and CEDBT, and the lesion margin is identified better on CEDBT, which shows different lesion morphologies at different image slices. In Fig. 7, a mass lesion is shown for a 74-year-old patient diagnosed with IDC. CEDBT depicts more details of lesion margin compared to CEDM and shows the change of lesion morphology at different image slices with contrast enhancement of lesion comparable to CEDM. Figure 8 shows a mass lesion diagnosed with invasive lobular carcinoma for a 39-year-old patient. The subtracted image slice in sagittal view from postbiopsy DCE-MRI is shown to illustrate the contrast enhancement and morphology of the lesion. Synthetic CEDM shows similar contrast enhancement of lesion and residual background tissue structure as CEDM. CEDBT shows a spiculated margin of the lesion, and CEDM and synthetic CEDM show an indistinct margin.
Fig. 6.
Clinical case of a 61-year-old patient diagnosed with IDC. A mass lesion (arrow) is shown in: (a) LE mammogram; (b) CEDM; (c) LE DBT image slice at 50 mm; CEDBT image slice at (d) 47 mm, (e) 50 mm, and (f) 53 mm. CEDBT depicts the morphological change of the mass at different image slices. Reader assessment shows that contrast enhancement of lesion is equally well (score = 0) and lesion margin is better identified on CEDBT (score = 1). CEDM and CEDBT show heterogeneous enhancement of an irregular mass with a spiculated margin. Postbiopsy breast DCE-MRI reports heterogeneous enhancement of a oval mass with an irregular margin.
Fig. 7.
Clinical case of a 74-year-old patient diagnosed with IDC. A mass lesion (arrow) is shown in: (a) LE mammogram; (b) CEDM; (c) LE DBT image slice at 27 mm; CEDBT image slice at (d) 24 mm, (e) 27 mm, and (f) 30 mm. CEDBT depicts the morphological change of the mass at different image slices. Reader assessment shows that contrast enhancement of lesion is equally well (score = 0) and lesion margin is better identified on CEDBT (score = 1). CEDM and CEDBT show heterogeneous enhancement of an irregular mass with a spiculated margin. Postbiopsy breast DCE-MRI is not available for this case.
Fig. 8.
Clinical case of a 39-year-old patient diagnosed with invasive lobular carcinoma. A mass lesion (arrow) is shown in: (a) LE mammogram; (b) LE DBT image slice; (c) sagittal view of postbiopsy DCE-MRI with subtraction; (d) CEDM; (e) CEDBT image slice; (f) synthetic CEDM. Reader assessment shows that contrast enhancement of lesion is slightly better on CEDBT (score = 1) and lesion margin is identified much better on CEDBT (score = 2). Postbiopsy breast DCE-MRI reports heterogeneous enhancement of a irregular mass, and the subtracted DCE-MRI image slice is shown to illustrate the lesion enhancement. Heterogeneous enhancement of the mass is seen on CEDM, CEDBT, and synthetic CEDM. CEDM shows a round mass with an indistinct margin. CEDBT shows a round mass with a spiculated margin. Synthetic CEDM shows an irregular mass with an indistinct margin.
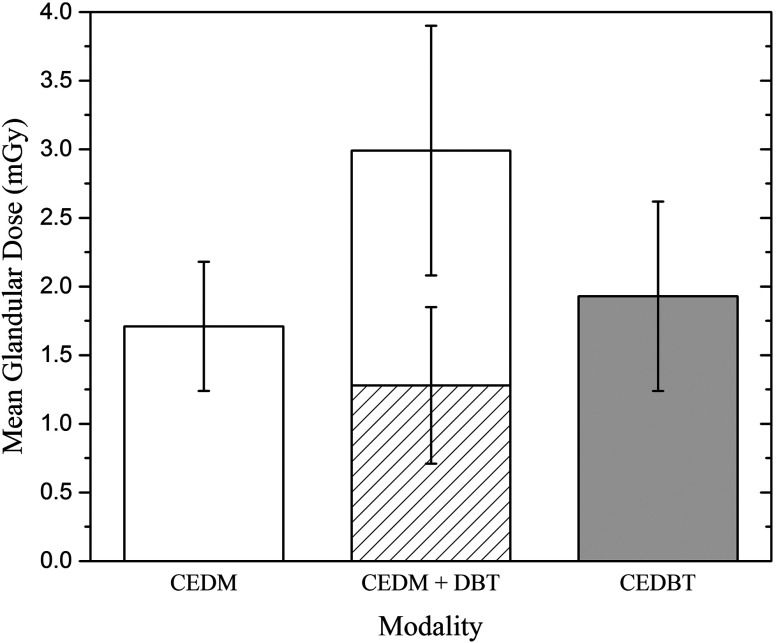
The average MGD per view is for CEDM and for CEDBT with delivered for LE DBT. When CEDM and LE DBT are used in combination for lesion assessment, the total MGD is (Fig. 9). CEDBT delivers less radiation dose compared to CEDM + DBT.
Fig. 9.
Average MGD and standard deviation for CEDM (white), LE DBT (hatched), CEDBT (gray), and CEDM + DBT (white + hatched).
4. Discussions
Our results show that the margin of contrast-enhanced lesions is better identified in CEDBT compared to CEDM. Due to the overlap of contrast enhancement, the details of lesion margins are degraded in CEDM especially for large mass lesions. Such details are restored in CEDBT by the separation of contrast enhancement in 3-D, which improves the lesion margin depiction. Also, CEDBT has less obscuring effect of background enhancement on each CEDBT slice compared to CEDM, which benefits lesion margin identification.
Our results indicate that the level of contrast enhancement of lesions is higher in CEDM compared to CEDBT slices, but the difference in detectability is negligible. As CEDBT separates contrast enhancement into multiple slices, the level of contrast enhancement of lesions on each slice is reduced compared to CEDM. Also, the ramp filter used in FBP reconstruction reduces contrast of low frequency objects, such as large masses. However, the obscuring effect of overlapping background enhancement in CEDBT is minimized, which helps identifying the contrast enhancement of lesion in CEDBT. In future work, we plan to improve our reconstruction algorithms to further enhance the contrast of large lesions in CEDBT slices.67
CEDBT provides coregistered contrast enhancement map with 3-D localization of lesions from LE DBT, which can help assess complexity of lesions and possibly provide more accurate guidance of biopsy. Compared with CEDM + DBT, CEDBT delivers less radiation dose while providing 3-D contrast enhancement information.
We show that it is feasible to generate synthetic CEDM image from CEDBT dataset with comparable lesion contrast enhancement and residual background structure to CEDM. Synthetic CEDM can be used for rapid assessment of lesion contrast enhancement prior to 3-D lesion localization and margin assessment with CEDBT.
Our pilot study is limited by the small sample size, which suggests a large scale of clinical study to compare CEDM and CEDBT for lesion assessment. The other limitation is the subjective assessment on lesion contrast enhancement and lesion margin using a five-point scale.
5. Conclusions
CEDBT provides better lesion margin assessment compared to CEDM, albeit with slightly reduced contrast enhancement of lesions. CEDBT provides 3-D localization of lesions and highlights lesion extent with contrast enhancement while using less radiation dose than CEDM + DBT. Synthetic CEDM can be created from CEDBT dataset without additional radiation dose and provide information that is comparable to conventional CEDM.
Acknowledgments
We acknowledge the biostatistical consultation and support from the Biostatistical Consulting Core, the School of Medicine, Stony Brook University. We gratefully acknowledge the financial support from Siemens Medical Solutions USA, Inc.
Biographies
Hailiang Huang is a PhD student at Stony Brook University. He received his MS degree in medical physics from Columbia University in 2014, and his BS degree in physics from Sun Yat-sen University, China, in 2012. His research interests include the development of dual-energy contrast-enhanced digital breast tomosynthesis, the optimization of DBT system, and their clinical applications. He is a member of SPIE.
Wei Zhao is a professor of radiology at Stony Brook University. She received her PhD in medical biophysics from the University of Toronto in 1997. Her current research interests include the optimization of imaging system geometry and flat-panel detector performance for DBT and dual-energy contrast-enhanced imaging applications, as well as the development of a-Se-based indirect flat panel detectors with avalanche gain for low-dose imaging applications. She is a member of SPIE.
Disclosures
W. Z. reports research grant from the National Institute of Biomedical Imaging and Bioengineering of the National Institutes of Health on the development of flat panel imagers. W. Z. and P. F. report research grant from Siemens Medical Solutions USA to support the investigation of contrast-enhanced digital breast tomosynthesis. M. H., J. W., and T. M. are employees of Siemens Healthcare GmbH and stockholders of Siemens AG and of Siemens Healthineers AG. S. V. is an employee of Siemens Medical Solutions USA, Inc. and a stockholder of Siemens AG and Siemens Healthineers AG. H. H., D. S., C. L., J. Y., C. Z., K. R., J. E., and J. L. declare no conflicts of interest, financial or otherwise.
References
- 1.Weidner N., et al. , “Tumor angiogenesis and metastasis—correlation in invasive breast carcinoma,” N. Engl. J. Med. 324(1), 1–8 (1991). 10.1056/NEJM199101033240101 [DOI] [PubMed] [Google Scholar]
- 2.Dromain C., et al. , “Evaluation of tumor angiogenesis of breast carcinoma using contrast-enhanced digital mammography,” AJR Am. J. Roentgenol. 187(5), W528–W537 (2006). 10.2214/AJR.05.1944 [DOI] [PubMed] [Google Scholar]
- 3.Lewin J. M., et al. , “Dual-energy contrast-enhanced digital subtraction mammography: feasibility,” Radiology 229(1), 261–268 (2003). 10.1148/radiol.2291021276 [DOI] [PubMed] [Google Scholar]
- 4.Dromain C., et al. , “Dual-energy contrast-enhanced digital mammography: initial clinical results of a multireader, multicase study,” Breast Cancer Res. 14(3), R94 (2012). 10.1186/bcr3210 [DOI] [PMC free article] [PubMed] [Google Scholar]
- 5.Arvanitis C. D., Speller R., “Quantitative contrast-enhanced mammography for contrast medium kinetics studies,” Phys. Med. Biol. 54(20), 6041–6064 (2009). 10.1088/0031-9155/54/20/002 [DOI] [PubMed] [Google Scholar]
- 6.Hill M. L., et al. , “Anatomical noise in contrast-enhanced digital mammography. Part I. Single-energy imaging,” Med. Phys. 40(5), 051910 (2013). 10.1118/1.4801905 [DOI] [PubMed] [Google Scholar]
- 7.Hill M. L., et al. , “Anatomical noise in contrast-enhanced digital mammography. Part II. Dual-energy imaging,” Med. Phys. 40(8), 081907 (2013). 10.1118/1.4812681 [DOI] [PubMed] [Google Scholar]
- 8.Puong S., et al. , “Dual-energy contrast enhanced digital mammography using a new approach for breast tissue canceling,” Proc. SPIE 6510, 65102H (2007). 10.1117/12.710133 [DOI] [Google Scholar]
- 9.Dromain C., et al. , “Contrast-enhanced digital mammography,” Eur. J. Radiol. 69(1), 34–42 (2009). 10.1016/j.ejrad.2008.07.035 [DOI] [PubMed] [Google Scholar]
- 10.Ikejimba L. C., et al. , “Task-based strategy for optimized contrast enhanced breast imaging: analysis of six imaging techniques for mammography and tomosynthesis,” Med. Phys. 41(6), 061908 (2014). 10.1118/1.4873317 [DOI] [PMC free article] [PubMed] [Google Scholar]
- 11.Diekmann F., et al. , “Digital mammography using iodine-based contrast media: initial clinical experience with dynamic contrast medium enhancement,” Invest Radiol. 40(7), 397–404 (2005). 10.1097/01.rli.0000167421.83203.4e [DOI] [PubMed] [Google Scholar]
- 12.Jong R. A., et al. , “Contrast-enhanced digital mammography: initial clinical experience,” Radiology 228(3), 842–850 (2003). 10.1148/radiol.2283020961 [DOI] [PubMed] [Google Scholar]
- 13.Diekmann F., et al. , “Evaluation of contrast-enhanced digital mammography,” Eur. J. Radiol. 78(1), 112–121 (2011). 10.1016/j.ejrad.2009.10.002 [DOI] [PubMed] [Google Scholar]
- 14.Dromain C., et al. , “Dual-energy contrast-enhanced digital mammography: initial clinical results,” Eur. Radiol. 21(3), 565–574 (2011). 10.1007/s00330-010-1944-y [DOI] [PubMed] [Google Scholar]
- 15.Luczynska E., et al. , “Contrast-enhanced spectral mammography: comparison with conventional mammography and histopathology in 152 women,” Korean J. Radiol. 15(6), 689–696 (2014). 10.3348/kjr.2014.15.6.689 [DOI] [PMC free article] [PubMed] [Google Scholar]
- 16.Cheung Y. C., et al. , “Diagnostic performance of dual-energy contrast-enhanced subtracted mammography in dense breasts compared to mammography alone: interobserver blind-reading analysis,” Eur. Radiol. 24(10), 2394–2403 (2014). 10.1007/s00330-014-3271-1 [DOI] [PubMed] [Google Scholar]
- 17.Lobbes M. B., et al. , “Contrast-enhanced spectral mammography in patients referred from the breast cancer screening programme,” Eur. Radiol. 24(7), 1668–1676 (2014). 10.1007/s00330-014-3154-5 [DOI] [PubMed] [Google Scholar]
- 18.Jochelson M. S., et al. , “Bilateral contrast-enhanced dual-energy digital mammography: feasibility and comparison with conventional digital mammography and MR imaging in women with known breast carcinoma,” Radiology 266(3), 743–751 (2013). 10.1148/radiol.12121084 [DOI] [PMC free article] [PubMed] [Google Scholar]
- 19.Fallenberg E. M., et al. , “Contrast-enhanced spectral mammography versus MRI: initial results in the detection of breast cancer and assessment of tumour size,” Eur. Radiol. 24(1), 256–264 (2014). 10.1007/s00330-013-3007-7 [DOI] [PubMed] [Google Scholar]
- 20.Fallenberg E. M., et al. , “Contrast-enhanced spectral mammography vs. mammography and MRI—clinical performance in a multi-reader evaluation,” Eur. Radiol. 27(7), 2752–2764 (2017). 10.1007/s00330-016-4650-6 [DOI] [PubMed] [Google Scholar]
- 21.Jochelson M. S., et al. , “Comparison of screening CEDM and MRI for women at increased risk for breast cancer: a pilot study,” Eur. J. Radiol. 97, 37–43 (2017). 10.1016/j.ejrad.2017.10.001 [DOI] [PubMed] [Google Scholar]
- 22.Iotti V., et al. , “Contrast-enhanced spectral mammography in neoadjuvant chemotherapy monitoring: a comparison with breast magnetic resonance imaging,” Breast Cancer Res. 19, 106 (2017). 10.1186/s13058-017-0899-1 [DOI] [PMC free article] [PubMed] [Google Scholar]
- 23.Lobbes M. B., et al. , “The quality of tumor size assessment by contrast-enhanced spectral mammography and the benefit of additional breast MRI,” J. Cancer 6(2), 144–150 (2015). 10.7150/jca.10705 [DOI] [PMC free article] [PubMed] [Google Scholar]
- 24.Lalji U. C., et al. , “Contrast-enhanced spectral mammography in recalls from the Dutch breast cancer screening program: validation of results in a large multireader, multicase study,” Eur. Radiol. 26(12), 4371–4379 (2016). 10.1007/s00330-016-4336-0 [DOI] [PMC free article] [PubMed] [Google Scholar]
- 25.Tagliafico A. S., et al. , “Diagnostic performance of contrast-enhanced spectral mammography: systematic review and meta-analysis,” Breast 28, 13–19 (2016). 10.1016/j.breast.2016.04.008 [DOI] [PubMed] [Google Scholar]
- 26.Chen S. C., et al. , “Initial clinical experience with contrast-enhanced digital breast tomosynthesis,” Acad. Radiol. 14(2), 229–238 (2007). 10.1016/j.acra.2006.10.022 [DOI] [PMC free article] [PubMed] [Google Scholar]
- 27.Carton A. K., et al. , “Dual-energy contrast-enhanced digital breast tomosynthesis—a feasibility study,” Br. J. Radiol. 83(988), 344–350 (2010). 10.1259/bjr/80279516 [DOI] [PMC free article] [PubMed] [Google Scholar]
- 28.Puong S., et al. , “Optimization of beam parameters and iodine quantification in dual-energy contrast enhanced digital breast tomosynthesis,” Proc. SPIE 6913, 69130Z (2008). 10.1117/12.770148 [DOI] [Google Scholar]
- 29.Hu Y. H., Scaduto D. A., Zhao W., “Optimization of contrast-enhanced breast imaging: analysis using a cascaded linear system model,” Med. Phys. 44(1), 43–56 (2017). 10.1002/mp.12004 [DOI] [PubMed] [Google Scholar]
- 30.Puong S., et al. , “Dual-energy contrast enhanced digital breast tomosynthesis: concept, method, and evaluation on phantoms,” Proc. SPIE 6510, 65100U (2007). 10.1117/12.710106 [DOI] [Google Scholar]
- 31.Carton A.-K., et al. , “Quantification for contrast-enhanced digital breast tomosynthesis,” Proc. SPIE 6142, 61420D (2006). 10.1117/12.654682 [DOI] [Google Scholar]
- 32.Carton A.-K., et al. , “Dual-energy subtraction for contrast-enhanced digital breast tomosynthesis,” Proc. SPIE 6510, 651007 (2007). 10.1117/12.713703 [DOI] [Google Scholar]
- 33.Carton A. K., et al. , “Optimization of a dual-energy contrast-enhanced technique for a photon-counting digital breast tomosynthesis system: I. A theoretical model,” Med. Phys. 37(11), 5896–5907 (2010). 10.1118/1.3490556 [DOI] [PMC free article] [PubMed] [Google Scholar]
- 34.Ren B., et al. , “Dual energy iodine contrast imaging with mammography and tomosynthesis,” Proc. SPIE 8668, 86680U (2013). 10.1117/12.2008147 [DOI] [Google Scholar]
- 35.Hu Y.-H., Zhao W., “Experimental quantification of lesion detectability in contrast enhanced dual energy digital breast tomosynthesis,” Proc. SPIE 8313, 83130A (2012). 10.1117/12.911433 [DOI] [Google Scholar]
- 36.Hill M. L., Mainprize J. G., Yaffe M. J., “System calibration for quantitative contrast-enhanced digital breast tomosynthesis (CEDBT),” Lect. Notes Comput. Sci. 9699, 645–653 (2016). 10.1007/978-3-319-41546-8 [DOI] [Google Scholar]
- 37.Schmitzberger F. F., et al. , “Development of low-dose photon-counting contrast-enhanced tomosynthesis with spectral imaging,” Radiology 259(2), 558–564 (2011). 10.1148/radiol.11101682 [DOI] [PubMed] [Google Scholar]
- 38.Fornvik D., et al. , “Breast tomosynthesis: accuracy of tumor measurement compared with digital mammography and ultrasonography,” Acta Radiol. 51(3), 240–247 (2010). 10.3109/02841850903524447 [DOI] [PubMed] [Google Scholar]
- 39.Chou C. P., et al. , “Clinical evaluation of contrast-enhanced digital mammography and contrast enhanced tomosynthesis—comparison to contrast-enhanced breast MRI,” Eur. J. Radiol. 84(12), 2501–2508 (2015). 10.1016/j.ejrad.2015.09.019 [DOI] [PubMed] [Google Scholar]
- 40.Lobbes M. B., Houben I., “Contrast-enhanced tomosynthesis: the best of both worlds or more of the same?” Eur. J. Radiol. 85(2), 507–508 (2016). 10.1016/j.ejrad.2015.11.024 [DOI] [PubMed] [Google Scholar]
- 41.Gavenonis S., et al. , “Initial experience with dual-energy contrast-enhanced digital breast tomosynthesis in the characterization of breast cancer,” Lect. Notes Comput. Sci. 7361, 32–39 (2012). 10.1007/978-3-642-31271-7 [DOI] [Google Scholar]
- 42.Rosa R. S. D. l., et al. , “Preliminary study of CEDBT and CESM performances using simulated analytical contrast uptakes,” in IEEE 15th Int. Symp. Biomed. Imaging (ISBI 2018), pp. 792–795 (2018). 10.1109/ISBI.2018.8363691 [DOI] [Google Scholar]
- 43.Huang H., et al. , “Lesion assessment and radiation dose in contrast-enhanced digital breast tomosynthesis,” Proc. SPIE 10718, 107181J (2018). 10.1117/12.2316371 [DOI] [Google Scholar]
- 44.Rafferty E. A., et al. , “Breast cancer screening using tomosynthesis and digital mammography in dense and nondense breasts,” JAMA 315(16), 1784–1786 (2016). 10.1001/jama.2016.1708 [DOI] [PubMed] [Google Scholar]
- 45.Smith A., “The principles of contrast mammography,” Hologic white paper WP-00084–001 (2014).
- 46.van Schie G., et al. , “Generating synthetic mammograms from reconstructed tomosynthesis volumes,” IEEE Trans. Med. Imaging 32(12), 2322–2331 (2013). 10.1109/TMI.2013.2281738 [DOI] [PubMed] [Google Scholar]
- 47.Gur D., et al. , “Dose reduction in digital breast tomosynthesis (DBT) screening using synthetically reconstructed projection images: an observer performance study,” Acad. Radiol. 19(2), 166–171 (2012). 10.1016/j.acra.2011.10.003 [DOI] [PMC free article] [PubMed] [Google Scholar]
- 48.Diekmann F., et al. , “Thick slices from tomosynthesis data sets: phantom study for the evaluation of different algorithms,” J. Digital Imaging 22(5), 519–526 (2009). 10.1007/s10278-007-9075-y [DOI] [PMC free article] [PubMed] [Google Scholar]
- 49.Hörnig M. D., Bätz L., Mertelmeier T., “Design of a contrast-enhanced dual-energy tomosynthesis system for breast cancer imaging,” Proc. SPIE 8313, 831340 (2012). 10.1117/12.911607 [DOI] [Google Scholar]
- 50.Knogler T., et al. , “Contrast-enhanced dual energy mammography with a novel anode/filter combination and artifact reduction: a feasibility study,” Eur. Radiol. 26(6), 1575–1581 (2016). 10.1007/s00330-015-4007-6 [DOI] [PubMed] [Google Scholar]
- 51.Scaduto D. A., Tousignant O., Zhao W., “Experimental characterization of a direct conversion amorphous selenium detector with thicker conversion layer for dual-energy contrast-enhanced breast imaging,” Med. Phys. 44(8), 3965–3977 (2017). 10.1002/mp.2017.44.issue-8 [DOI] [PubMed] [Google Scholar]
- 52.Hu Y.-H., Zhao W., “The effect of amorphous selenium detector thickness on dual-energy digital breast imaging,” Med. Phys. 41(11), 111904 (2014). 10.1118/1.4897244 [DOI] [PMC free article] [PubMed] [Google Scholar]
- 53.Hu Y.-H., Zhao W., “A 3D linear system model for the optimization of dual-energy contrast-enhanced digital breast tomosynthesis,” Proc. SPIE 7961, 79611C (2011). 10.1117/12.878134 [DOI] [Google Scholar]
- 54.Hu Y.-H., Scaduto D. A., Zhao W., “Optimization of clinical protocols for contrast enhanced breast imaging,” Proc. SPIE 8668, 86680G (2013). 10.1117/12.2008028 [DOI] [Google Scholar]
- 55.Scaduto D. A., “Clinically translating contrast-enhanced x-ray breast imaging,” PhD Dissertation, State University of New York at Stony Brook (2017). [Google Scholar]
- 56.Richard S., Siewerdsen J. H., “Cascaded systems analysis of noise reduction algorithms in dual-energy imaging,” Med. Phys. 35(2), 586–601 (2008). 10.1118/1.2826556 [DOI] [PubMed] [Google Scholar]
- 57.Boone J. M., Fewell T. R., Jennings R. J., “Molybdenum, rhodium, and tungsten anode spectral models using interpolating polynomials with application to mammography,” Med. Phys. 24(12), 1863–1874 (1997). 10.1118/1.598100 [DOI] [PubMed] [Google Scholar]
- 58.Boone J. M., Seibert J. A., “An accurate method for computer-generating tungsten anode x-ray spectra from 30 to 140 kV,” Med. Phys. 24(11), 1661–1670 (1997). 10.1118/1.597953 [DOI] [PubMed] [Google Scholar]
- 59.Lau K. C., et al. , “Estimating breast thickness for dual-energy subtraction in contrast-enhanced digital mammography using calibration phantoms,” Proc. SPIE 9783, 978307 (2016). 10.1117/12.2214748 [DOI] [Google Scholar]
- 60.Lau K. C., Acciavatti R. J., Maidment A. D. A., “Estimating breast thickness for dual-energy subtraction in contrast-enhanced digital mammography: a theoretical model,” Lect. Notes Comput. Sci. 9699, 593–600 (2016). 10.1007/978-3-319-41546-8 [DOI] [Google Scholar]
- 61.Pisano E. D., et al. , “Image processing algorithms for digital mammography: a pictorial essay,” Radiographics 20(5), 1479–1491 (2000). 10.1148/radiographics.20.5.g00se311479 [DOI] [PubMed] [Google Scholar]
- 62.Chen L., et al. , “Impact of subtraction and reconstruction strategies on dual-energy contrast enhanced breast tomosynthesis with interleaved acquisition,” Proc. SPIE 8668, 86685O (2013). 10.1117/12.2007960 [DOI] [Google Scholar]
- 63.Mertelmeier T., et al. , “Optimizing filtered backprojection reconstruction for a breast tomosynthesis prototype device,” Proc. SPIE 6142, 61420F (2006). 10.1117/12.651380 [DOI] [Google Scholar]
- 64.Dennerlein F., et al. , “Efficient synthesis of virtual projections from a tomosynthesis data set using a 2D image processing method,” Proc. SPIE 8668, 86680W (2013). 10.1117/12.2008011 [DOI] [Google Scholar]
- 65.Costa M. J., et al. , “Generating a synthetic two-dimensional mammogram,” US Patent, US20170011534A1 (2015).
- 66.Dance D. R., et al. , “Additional factors for the estimation of mean glandular breast dose using the UK mammography dosimetry protocol,” Phys. Med. Biol. 45(11), 3225–3240 (2000). 10.1088/0031-9155/45/11/308 [DOI] [PubMed] [Google Scholar]
- 67.Scaduto D. A., et al. , “Dependence of contrast-enhanced lesion detection in contrast-enhanced digital breast tomosynthesis on imaging chain design,” Lect. Notes Comput. Sci. 9699, 136–144 (2016). 10.1007/978-3-319-41546-8 [DOI] [Google Scholar]


