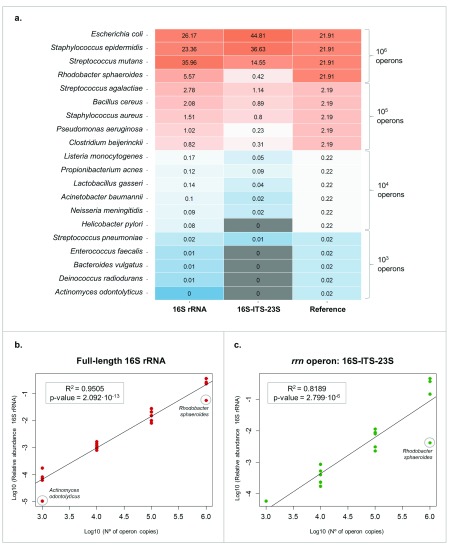
Figure 3. HM-783D mock community analysis.
( A) Heat map representing the HM-783D mock community composition when mapped to its mock database. Grey colour represents the bacteria that were not detected (<10 4 copies with rrn operon). ( B) Linear regression analysis of relative read proportions obtained using full-length 16S rRNA gene for all bacterial species present in HM-783D mock community and the actual operon copies (in log scale). ( C) Linear regression analysis of relative read proportions obtained using the 16S-ITS-23S genetic marker for all bacterial species present in HM-783D mock community and the actual operon copies (in log scale).

