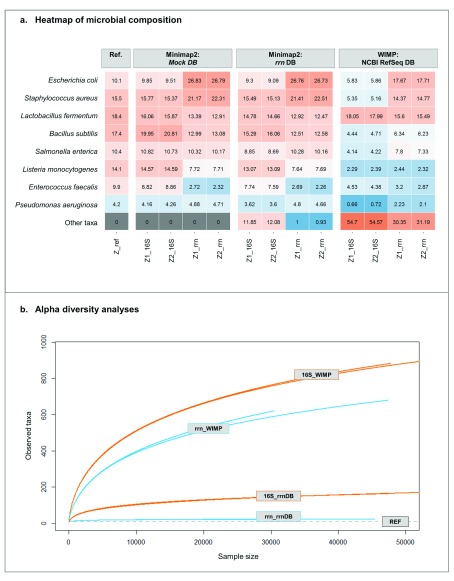
Figure 4. Zymobiomics mock community taxonomic analysis and diversity.
( A) Heat map representing the relative abundance of the Zymobiomics mock community. “REF” column represents the theoretical composition of the mock community regarding the 16S rRNA gene content of each bacterium. ( B) Alpha diversity rarefaction plot using observed taxa metrics.

