Abstract
Background
Damage-regulated autophagy modulator 2(DRAM2) is associated with autophagy processes. However, the role of DRAM2 in the progression of human neoplasms is still unknown. Here, we show that DRAM2 may act as an oncogenic regulator in non-small cell lung cancer (NSCLC).
Methods
Tumor specimens from 259 NSCLC patients were collected and analyzed. Transwell migration, cell cycle analysis, MTT and colony formation assays were performed to determine the effect of DRAM2 overexpression and knockdown on NSCLC-cell migration and proliferation. Western blotting confirmed the expression of DRAM2, p53, and the other involved proteins.
Results
DRAM2 was preferentially upregulated in NSCLC tissues and higher expression of DRAM2 in NSCLC correlated with tumor node metastases stage and lymph node metastasis. Additionally, DRAM2 overexpression promoted cell metastasis and proliferation in vitro, while knockdown of DRAM2 expression yielded opposite result. Furthermore, DRAM2 overexpression increased the expression of proteins RAC1, RHOA, RHOC, ROCK1, and decreased RHOB expression, all of which are cell migration factors. DRAM2 overexpression also increased proteins CDK4, CyclinD3, and decreased p27 expression, all of which are cell cycle-related factors. Consistently knocked down DRAM2 had the opposite effect. We also found that DRAM2 expression was negatively correlated to p53 expression. Knockdown of DRAM2 caused an increase of p53 and p21 expression, and overexpression of p53 caused a decrease of DRAM2 expression. Finally, absence of p53 did not influence the function of DRAM2 in NSCLC, but overexpression of p53 repressed its function.
Conclusions
DRAM2 plays an oncogenic role in NSCLC via regulating p53 expression. Therefore, DRAM2 may act as an oncogene in NSCLC and could serve as a prognostic factor and potential target for NSCLC treatment.
Keywords: Non-small-cell lung cancer, DRAM2, Cell migration, Cell proliferation, P53, P21
Background
The gene, damage-regulated autophagy modulator 2 (DRAM2), also known as TMEM77, is located on chromosome 1p13.3 and encodes a six putative transmembrane domain-containing protein of 176 amino acids [1]. Mutations in this gene are associated with retinal dystrophy [2, 3]. MicroRNA 125b-1, microRNA 144, and lncRNA HOTAIRM1 can bind to the mRNA of this gene and produce a disease state [4–6]. DRAM2 shares significant homology with DRAM, displaying a 36.7% similarity in amino acids and both are co-localized in lysosomes [7]. Although DRAM is one of the important regulatory factors of p53-mediated autophagy [8], the relationship between DRAM2 and p53 remains controversial. Some researchers have suggested that unlike DRAM, DRAM2 is not involved in p53 and autophagy [9], while other publications claim DRAM2 is involved in p53-induced cell death,and promotes the autophagy process [7]. Given that the relationship of DRAM2 with p53 remains a topic of debate, exploration of this association is needed.
With the exception of serving as an autophagy-related protein in a few types of tumors [5, 7, 10–12], the protein DRAM2 had not been thoroughly studied in the context of cancer. Some researchers posit that genes encoding transmembrane or secretory proteins, which are expressed specifically in cancers, may serve as ideal biomarkers for cancer diagnosis, and if the gene production is involved in the neoplastic process, the gene may become a therapeutic target [13]. Based on this, the transmembrane gene, DRAM2, was chosen as a potential therapeutic target and found to be expressed at much higher levels in gastric cancer than in normal tissues,however no further research has been performed [14]. Given these results, DRAM2 expression and the role it plays in other cancers is worth investigating.
Lung cancer is the most frequently diagnosed malignancy resulting in the highest mortality rates among all cancers [15, 16]. Approximately 85% of lung cancer patients are diagnosed with non-small cell lung cancer (NSCLC) [17] and the 5-year survival rate of NSCLC remains very low [18]. Meanwhile, the tumor suppressor, p53, which is mutated in almost 50% of tumors [19], plays an important role in oncogenic signaling [20–23]. Thus, in this study, we aimed to elucidate the expression and function of DRAM2 in the progression of NSCLC and the relationship between DRAM2 and p53 in NSCLC, which may provide valuable insights into the regulatory mechanism of lung cancer and a novel therapeutic target.
Methods
Patients and specimens
Our research was approved by the Medical Research Ethics Committee of China Medical University and informed consent was obtained from all patients.Specimens of 259 non-small cell lung cancer patients were randomly obtained from the Pathology Archive of the First Affiliated Hospital of China Medical University from 2014 to 2017. All enrolled patients underwent curative surgical resection without having prior chemotherapy or radiation therapy.
Immunohistochemical method and result analysis
The paraffin-embedded NSCLC tissue was collected and sliced into 4 μm sections. The sections were deparaffinized in xylene, rehydrated in a graded alcohol series, and treated with 0.01 mol/L citrate buffer (Maixin-Bio, Shenzhen, China) under high pressure for 2 min to repair heat antigens. Endogenous peroxidase activity was blocked by H2O2 (0.3%), and the sections were incubated with goat serum (Maixin-Bio, China) at 37 °C for 20 min to reduce non-specific binding. Next, the sections were incubated with anti-DRAM2 rabbit polyclonal antibodies (1200 dilution; Abcam, Cambridge, UK) at 4 °C for 18 h, and the reaction was visualized via immunohistochemical staining by the Elivision super HRP (Mouse/Rabbit) IHC Kit (Maixin-Bio, China) and 3,3′-diaminobenzidine (DAB) color developing, and redyeing with hematoxylin. Known positive slices of NSCLC were used as the positive control and phosphate buffered saline (PBS) replaced the primary antibody as the negative control. The intensity of DRAM2 staining was scored as follows: 0 (no staining), 1 (weak staining), 2 (moderate staining), and 3 (strong staining). Percentage scores were assigned as follows: 1 (0–25%), 2 (26–50%), 3 (51–75%), and 4 (71–100%). The scores of each tumor sample were multiplied to give a final score ranging from 0 to 12, normal bronchia was scored as well. Tumor samples with scores ≥4 were defined as DRAM2 overexpression, and those with scores < 4 were categorized as showing weak or negative expression.Choosing 4 as the critical value was because the score of DRAM2 over expression in bronchus was ≥4 and the score of low expression in bronchus was < 4.
Cell culture and treatment
The lung cancer cell lines A549, H1299, H460, H292, H661, and SK-MES-1 were purchased from the Cell Bank of the China Academy of Sciences (Shanghai, China), and normal bronchial epithelial HBE cells were obtained from ATCC (Manassas, VA, USA). A549, H292, H1299, H460, and H661 cells were cultured with Roswell Park Memorial Institute 1640 medium (Gibco, Waltham, MA, USA). SK-MES-1 cells were cultured in minimal essential medium (Gibco), and HBE cells were cultured in DMEM (Gibco). All media were supplemented with 10% fetal bovine serum (FBS, CLARK, South America). The cell lines we used were all p53 non-mutant cells.The cells were maintained in a 5% CO2 incubator at 37 °C.
Cell transfection was carried out using Lipofectamine 3000 reagent (Invitrogen, Waltham, MA, USA) according to the manufacturer’s instructions. In DRAM2 knockdown experiments, cells were transfected with DRAM2-specific small interfering RNA (siRNA) and negative control (NC) siRNA (Ruibo, Guangzhou, China) for 48 h,and the siRNA sequences for DRAM2 was GGACTGATTTAGAACAGAA.For DRAM2 overexpression, cells were transfected with a DRAM2 expression plasmid, TP53 expression plasmid, and the corresponding empty pcmv6 vector, which were all purchased from Origene (Rockville, MD, USA).
Immunofluorescence
Lung cancer cells cultured on coverslips in 24-well plates for 24 h were fixed in 4% paraformaldehyde for 15 min and permeabilized with 0.1% Triton X-100 for 10 min, washed three times with PBS, followed by blocking in BSA (5%) for 2 h at 25 °C, and incubation with the anti-DRAM2 antibodies (1:200; Abcam) overnight at 4 °C. Next, cells were washed and incubated for 2 h at 25 °C with a tetramethylrhodamine (TRITC)-conjugated secondary antibody and then washed. Cells were counterstained with 4,6-diamino-2-phenyl indole (DAPI) for 10 min at 25 °C. Cell images were captured using an Olympus FV1000 laser-scanning confocal microscope (Olympus, Tokyo, Japan).
RNA extraction and real-time PCR
Total RNA was isolated using Trizol (Invitrogen, NY, USA) following the manufacturer’s protocol. The concentrations of RNA samples were measured with spectrophotometers. Quantitative real-time (RT)-PCR was carried out in a 7900HT Fast RT-PCR System (Applied Biosystems, Foster City, CA, USA) using SYBR Green RT-PCR master mix (Takala, Dalian, China) in a total volume of 20 μL under the following cycling conditions: 95 °C for 30 s then 45 cycles of 95 °C for 5 s and 60 °C for 30 s. A dissociation step was performed to generate a melting curve to confirm the specificity of the amplification. β-actin was used as the reference gene. The relative levels of gene expression were represented as ΔCt = Ct gene − Ct reference, and the fold change of the gene expression was calculated by the 2 − ∆∆Ct method [24]. The experiments were repeated in triplicate. The primer sequences were as follows:
DRAM2 reverse, 5’-ATGTAAGTGGAGCTGTGCTTACCTTTGGT-3′;
DRAM2 forward, 5’-ACTGTGCAAAACTGAGCAAGTCAG-3′;
β-actin reverse,5′- ATGTACCCTGGCATTGCCGA-3′;
β-actin forward,5′- ACACGGAGTACTTGCGCTCA-3′.
Western blot analysis
Proteins directly influenced by cell migration and those involved in cell proliferation and cell cycle progression, were analyzed by western blotting. Total protein from cells and tumor tissues was extracted in lysis buffer (P0013; Beyotime Biosciences, Shanghai, China) and a protease-inhibitor cocktail(B14002; Biotool, Shanghai, China) and/or a phosphatase-inhibitor cocktail (B15002; Biotool), according to manufacturer instructions and quantified using the Bradford method [25]. Proteins (80 μg/lane) were separated by 10% sodium dodecyl sulfate, sodium salt-polyacrylamide gel electrophoresis (SDS-PAGE) gels, transferred onto polyvinylidene fluoride (PVDF) membranes (Millipore, Germany), which was then exposed to 5% non-fat dried milk (232,100; Becton Dickenson, Franklin Lakes, NJ, USA) in tris-HCl buffer solution (TBS)-Tween buffer for 2 h at 25 °C before incubation overnight at 4 °C with primary antibodies (Table 1). The PVDF membrane were then washed three times before incubation for 2 h at room temperature with horseradish peroxidase (HRP)-conjugated goat antibodies to rabbit / mouse IgG. Immune reactivity was detected by electrochemiluminescence (ECL) (Thermo Fisher Scientific, Waltham, MA, USA) using a BioImaging System (UVP Inc., Upland, CA, USA). Relative protein expression was calculated after normalization to glyceraldehyde 3-phosphate dehydrogenase (GAPDH) used as a loading control.
Table 1.
list of antibodies used for western blot
| Antibody name | Brand | Catalog number | Host | Dilution |
|---|---|---|---|---|
| DRAM2 | Abcam | 121,554 | Rabbit | 1:200 |
| DRAM2 | SIGMA | hpa-18,036 | Mouse | 1:1000 |
| GAPDH | Beyotime | AF0006 | Mouse | 1:1000 |
| RAC1 | Proteintech | 66,122-I-lg | Mouse | 1:500 |
| RhoA | Cell SignalingTechnology Inc. | 2117 | Rabbit | 1:1000 |
| RhoB | Santa Cru. | sc-180 | Rabbit | 1:100 |
| RhoC | Cell SignalingTechnology Inc. | 3430 | Rabbit | 1:1000 |
| Rock1 | Wanlei Bio. | Wl01761 | Rabbit | 1:500 |
| CDK4 | Cell SignalingTechnology Inc. | 12,790 | Rabbit | 1:1000 |
| CyclinD3 | Cell SignalingTechnology Inc. | 2936 | Rabbit | 1:1000 |
| p27 | Proteintech | 25,614-I-AP | Rabbit | 1:500 |
| P53 | Proteintech | 10,442-I-AP | Rabbit | 1:500 |
| P21 | Proteintech | 10,355-I-AP | Rabbit | 1:500 |
Cell migration analysis
Cell migration assays were carried out in 24-well Transwell chambers containing inserts with a pore size of 8 μm (Costar, Washington, DC, USA). Cells were trypsinized after 24 h transfection, and 8 × 10⁴ cells were transferred to the upper Transwell chamber in 100 μL medium supplemented with 2% FBS, with 600 μL medium supplemented with 10% FBS in the lower chamber. After incubation for 24 h, cells on the upper membrane surface were removed with a cotton tip, and those that passed through the membrane were fixed with polyformaldehyde and stained with hematoxylin. The number of migrated/invaded cells was counted in 10 randomly selected fields under a microscope at 200× magnification. All experiments were repeated independently at least three times under identical conditions.
Cell proliferation assay
Cells were seeded in five 96-well plates at a concentration of 3000 cells/100 μL per well and evaluated daily for 5 d. Every day, we chose one of the five plates and added media containing 3-(4, 5-dimethylthylthiazol-2yl-)-2, 5-diphenyl tetrazolium bromide (MTT) (10 μL/well), and the remaining plates were cultured in a 5% CO2 incubator at 37 °C. The plate with MTT was incubated at 37 °C for 4 h, then the supernatant was removed, and 150 μl dimethyl sulfoxide (DMSO) was added to dissolve the crystals. Absorbance was measured at 490 nm using a microplate reader.
Cell cycle assay
The cells were harvested by trypsin digestion 48 h after transfection and washed in cold PBS before fixation in cold 75% alcohol at 4 °C overnight. Alcohol was removed and cells were again washed with cold PBS. Cells were stained with propidium iodide solution (KeyGEN BioTECH, China) containing 20 μg/ml RNase, and incubated at room temperature for 30 min. A FACS Calibur (BD,USA) flow cytometer was used to analyze the cell population. After filtration by a nylon mesh filter, cell cycle analysis was performed on a fluorescence-activated cell sorter (FACS, FACSVerse). Data were analyzed using FlowJo software (Version 7.6.1, Tree Star Software, San Carlos, CA, USA).
Colony formation assays
Cells were seeded in 6-wells plates at a density of 500 cells/well and allowed to grow undisturbed for 10–15 d at 5% CO2, 37 °C. The cells were then washed with PBS, fixed in 4% paraformaldehyde for 15 min and stained with hematoxylin. Colonies with more than 50 cells were counted. At least three independent experiments were carried out under identical conditions.
Statistical analysis
SPSS 16.0 software (SPSS Inc., Chicago, IL, USA) was used for data analysis. Correlations between DRAM2 expression and clinicopathological features were examined by chi-squared test, and differences between cell groups were compared by paired t-test. Two-sided p-values < 0.05 were considered statistically significant. *p < 0.05, **p < 0.01, ***p < 0.001.
Results
DRAM2 was overexpressed in NSCLC tissues and has clinical significance
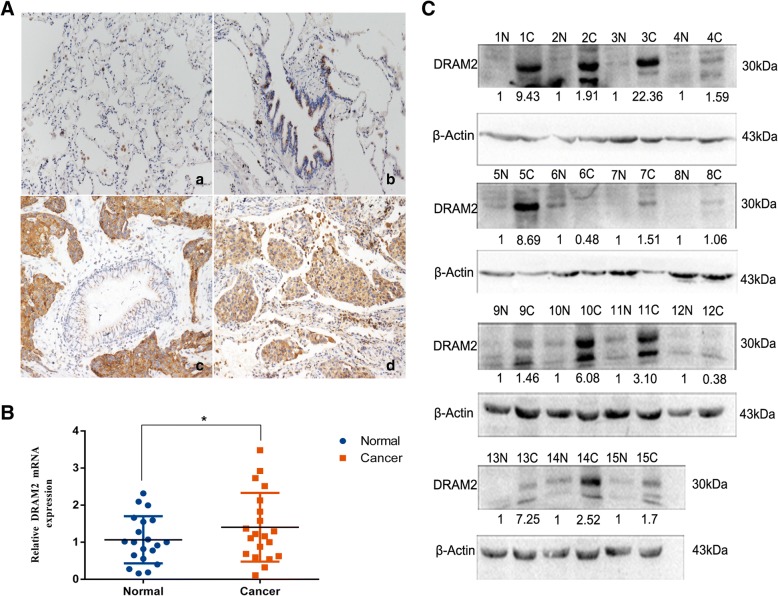
To explore the expression and subcellular localization of DRAM2 in NSCLC, we analyzed 259 cases of NSCLC and adjacent noncancerous clinical tissue specimens. Immunohistochemical staining showed that DRAM2 was localized to the cytoplasm (Fig. 1a). According to established principles for evaluating immunostaining, the expression of DRAM2 was negative in the normal alveolar (Fig. 1A-a), and negative or very weakly positive in the normal bronchi (Fig. 1A-b), but relatively higher in squamous carcinoma tissues (Fig. 1A-c) and adenomatous carcinoma tissues (Fig. 1A-d).
Fig. 1.
Expression of DRAM2 in non-small cell lung cancer (NSCLC). a. DRAM2 protein expression analyzed by immunohistochemistry in (a) alveolar and (b) normal bronchial epithelial cells; (c) squamous cell carcinoma and (d) adenocarcinoma. Magnification, × 200. b. Relative expression of DRAM2 mRNA in 20 pairs of NSCLC samples and adjacent normal lung tissues.DRAM2 overexpressed in NSCLC samples and have statistical significance,p = 0.0466. c. Western blot showing the detection of DRAM2 and p53 in the lysates of 15 paired tumor (C) and adjacent normal tissues (N). β-actin was used as a loading control. The results were quantified using ImageLab, and intensity values were normalized to the β-actin band.The relative expression was quantified below
Next, to investigate whether DRAM2 expression was associated with the progression of NSCLC, we analyzed the correlation of DRAM2 expression with the clinicopathological characteristics of the lung cancer patients based on the immunohistochemical staining data. As shown in Table 2, DRAM2 overexpression was associated with tumor node metastases (TNM) stages (p = 0.025) and lymph node metastasis (p = 0.035), but did not correlate with age, biological sex, histology, or tumor differentiation (p > 0.05).
Table 2.
Correlation between DRAM2 expressiom and clinicopathological factors in 259 NSCLC patients
| Clinicopathological factors | Number of patient | DRAM2 negative or weak expression | DRAM2 over expression | P |
|---|---|---|---|---|
| Gender | ||||
| Male | 163 | 59 | 104 | 0.498 |
| Female | 96 | 30 | 66 | |
| Age | ||||
| > 60 | 121 | 41 | 80 | 0.896 |
| ≤ 60 | 138 | 48 | 90 | |
| Histology | ||||
| Squamous cell carcinoma | 103 | 37 | 66 | 0.69 |
| Adenocarcinoma | 156 | 52 | 104 | |
| Differentiation | ||||
| Well | 118 | 43 | 75 | 0.599 |
| Moderate-Poor | 141 | 46 | 95 | |
| Lymph node metastasis | ||||
| Negative | 148 | 59 | 89 | 0.035 |
| Positive | 111 | 30 | 81 | |
| TNM stage | ||||
| I | 114 | 48 | 66 | 0.025 |
| II + III | 145 | 41 | 104 | |
*p < 0.05; **p < 0.01
To confirm DRAM2 was overexpressed in tumor tissue, we analyzed DRAM2 mRNA expression in 20 pairs of fresh NSCLC samples via RT-PCR (Fig. 1c) and 15 pairs of tissue specimens, which corresponded to RT-PCR to analyze DRAM2 expression through western blotting (Fig. 1d), and obtained the same results. Collectively, these observations indicate that the DRAM2 was overexpressed in NSCLC compared with the adjacent normal lung tissues, and its overexpression was associated with TNM stages and lymph node metastasis of NSCLC patients.
DRAM2 is located in cytoplasm and highly expressed in NSCLC cell lines
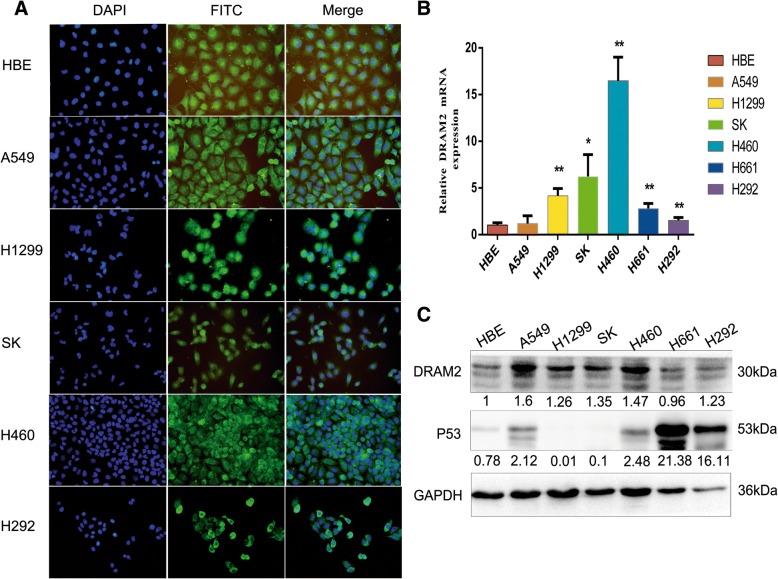
The expression of DRAM2 and its subcellular distribution in six NSCLC cell lines (A549, H1299, SK-MEM-1, H460, H661, and H292) and a normal bronchial epithelial cell line (HBE) was evaluated usingimmunofluorescence analyses, RT-PCR, and western blot, respectively. We found that DRAM2 localized to cytoplasm, surrounding the nucleus (Fig. 2a). both by RT-PCR (Fig. 2b) and western blotting (Fig. 2c). Comparing the expression of DRAM2 in NSCLC cell lines with HBE, we determined that DRAM2 was overexpressed in these NSCLC cell lines. The lowest expression was found in HBE in RT-PCR and p value was calculated for each cell line(Fig. 2b). Western blotting showed the lowest expression was found in H661 and the highest expression was found in A549 (Fig. 2c).
Fig. 2.
DRAM2 sub-location and expression in non-small cell lung cancer (NSCLC) cell lines. a. Immunofluorescence assays were performed to detect DRAM2 sub-locations in NSCLC cell lines. DRAM2 was located in the cytoplasm surrounding around nucleus. b. Relative expression of DRAM2 mRNA in six lung cancer cell lines and a normal bronchial cell line (HBE).Compared the expression of DRAM2 in those cell lines with HBE,A549 got no statistical significance,H1299 p = 0.0093,SK p = 0.049,H460 p = 0.0072,H661 p = 0.009,H292 p = 0.0055.*p < 0.05, **p < 0.01, ***p < 0.001. c. DRAM2 protein levels in NSCLC cell lines assessed by immunoblotting and analyzed with ImageLab software.The relative expression was quantified below
DRAM2 promotes migration of NSCLC cells
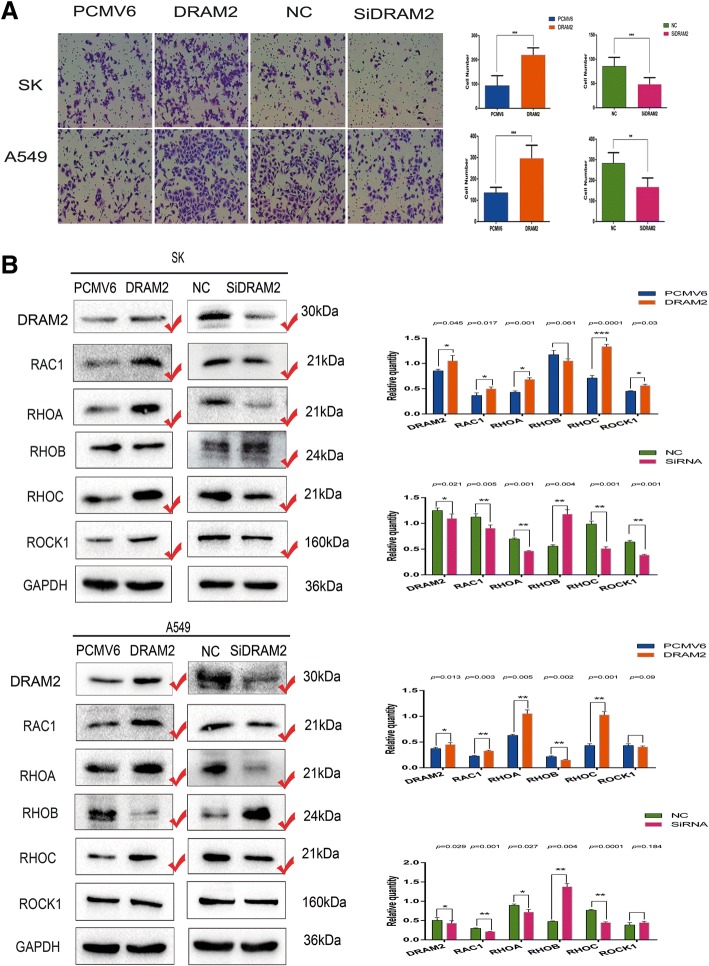
Considering the expression of DRAM2 did not correlate with histology (Table 2), we chose to upregulate and silence DRAM2 expression in A549 (adenocarcinoma) and SK-MEM-1 (squamous carcinoma, hereinafter referred to as SK) for subsequent experiments. Based on the result that DRAM2 correlated with lymph node metastasis, we first explored the effects of DRAM2 on cell migration of NSCLC, via transwell migration experiment, and the difference in transwell migration was statistically significant. Meanwhile we analyzed whether the changes in expression of proteins involved in migration, such as RAC1, RHOA, RHOB, RHOC, and ROCK1 were consistent with the changes in the biological function, due to the overexpression and knockdown of DRAM2 in NSCLC cells. As results showed increased or decreased DRAM2 expression enhanced or suppressed migration, respectively (Fig. 3).
Fig. 3.
Expression of DRAM2 affected the migration of non-small cell lung cancer (NSCLC) cells. a. Transwell migration assays were performed to analyze cell migration in the context of DRAM2 overexpression and downregulation in SK and A549 cells, respectively. Cells that migrated to the lower chamber were stained with hematoxylin and counted. DRAM2 overexpression enhanced cell migration and DRAM2 knockdown inhibited cell migration. p-values for SK were: DRAM2 vs PCMV6, p < 0.0001; SiDRAM2 vs negative control siRNA, p = 0.0002. p-values for A549 were: DRAM2 vs PCMV6, p = 0.0001; SiDRAM2 vs NC, p = 0.0019. *p < 0.05, **p < 0.01, ***p < 0.001. b. Effects of DRAM2 levels on the expression of proteins associated with cell migration in transfected SK and A549 cells. The gray level of the proteins were detected, the corresponding p value were provided at the top of the graphs and those changed proteins were marked.*p < 0.05, **p < 0.01, ***p < 0.001
DRAM2 promotes the proliferation of NSCLC cells
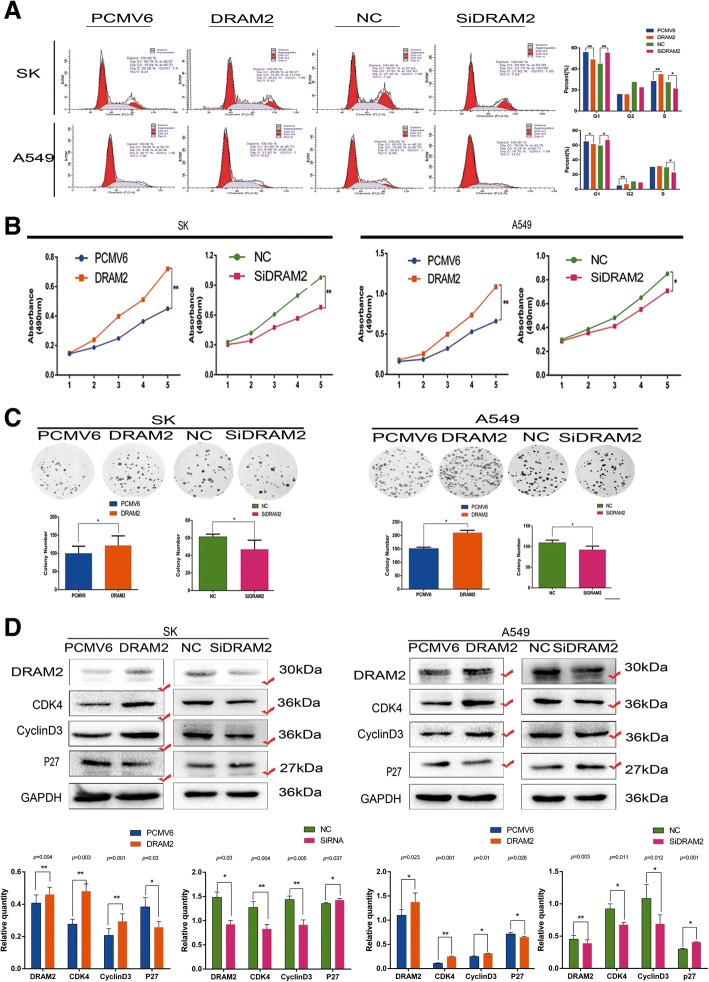
Next, we sought to determine whether the expression of DRAM2 could affect cell proliferation of NSCLC, thus, cell cycle analysis, MTT assay, and colony formation were performed in A549 and SK cells after either overexpressing or downregulating DRAM2, and the differences in results for each assay were statistically significant (Fig. 4a-c). Proteins involved in the cell cycle, including cyclin, cyclin-dependent kinases, and cell cycle inhibitory proteins were analyzed. Finally,we chose to focus on the changes in expression of proteins CDK4, cyclinD3, and p27 (Fig. 4d) and confirmed that DRAM2 promoted proliferation of NSCLC cells.
Fig. 4.
Expression of DRAM2 affected the proliferation of non-small cell lung cancer (NSCLC) cells. Upon DRAM2 overexpression and downregulation in SK and A549 cells, respectively, cell cycle analysis, MTT assay, and colony formation assay were performed. a. p-values of G1 phase of cell cycle analysis for A549 were: DRAM2 vs PCMV6, p = 0.022 and SiDRAM2 vs NC, p = 0.035; for SK, DRAM2 vs PCMV6 p = 0.003, SiDRAM2 vs NC, p = 0.016. p-values for differences in cells in G2 and S phase were also significant (data not shown); b. We compared MTT assay data on the fifth day, and calculated p-values for A549: DRAM2 vs PCMV6, p = 0.009; SiDRAM2 vs NC, p = 0.036; and for SK: DRAM2 vs PCMV6, p = 0.005; SiDRAM2 vs NC, p = 0.002; c. For colony formation assay in A549, DRAM2 vs PCMV6 p = 0.0164, and SiDRAM2 vs NC, p = 0.0462; for SK, DRAM2 vs PCMV6 p = 0.0465, and SiDRAM2 vs NC, p = 0.0310. *p < 0.05, **p < 0.01, ***p < 0.001 d. Effects of DRAM2 levels on the expression of proteins associated with cell proliferation in transfected SK and A549 cells. The gray level of the proteins were detected, the corresponding p value were provided at the top of the graphs and those changed proteins were marked.*p < 0.05, **p < 0.01, ***p < 0.001
Expression of p53 and DRAM2 are restrained by each other
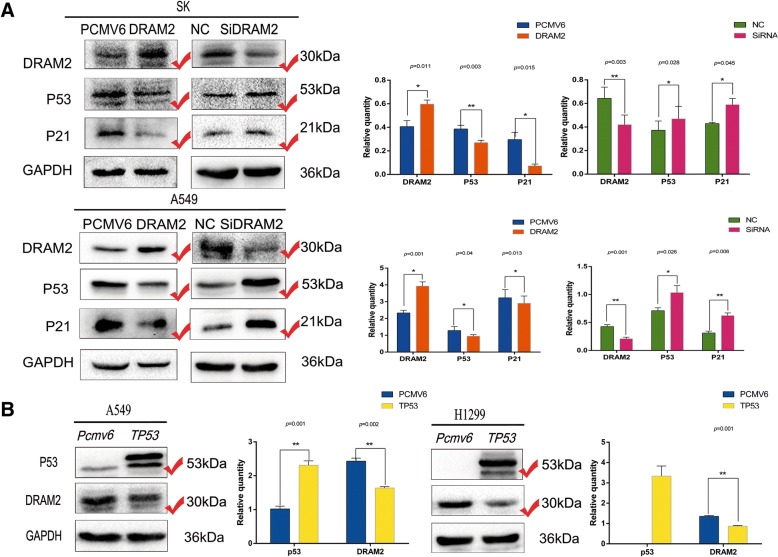
Given that of the cell lines tested, DRAM2 showed the lowest expression in H661 where endogenous p53 expression was more than 20 times higher than that of other cell lines (Fig. 2c), and the fact that DRAM2 shares significant homology with DRAM, which can act either p53 dependently [26] or independently [27], it was necessary to explore the relationship between DRAM2 and p53 in NSCLC. We first detected the expression of p53 and the p53 target gene, p21, while upregulating or downregulating DRAM2 in A549 and SK cells, and found that the expression of p53 and p21 negatively affected by DRAM2 expression(Fig. 5a). Next, we transfected TP53 to A549 and H1299 cells, then evaluated the expression of DRAM2, and found out that DRAM2 was decreased when P53 was overexpressed(Fig. 5b). These results demonstrated that DRAM2 and p53 interacted with each other and negatively affected each other’s expression.
Fig. 5.
Expression of p53 and DRAM2 were restrained by each other. a Protein p53 and its target, p21, were detected in the context of DRAM2 overexpression and downregulation in SK and A549 cells, respectively. The gray level of the proteins were detected, the corresponding p value were provided at the top of the graphs and those changed proteins were marked.*p < 0.05, **p < 0.01, ***p < 0.001. b Protein DRAM2 was decreased after TP53 was transfected into A549 and H1299 cells. The gray level of the proteins were detected, the corresponding p value were provided at the top of the graphs and those changed proteins were marked.*p < 0.05, **p < 0.01, ***p < 0.001
Expression level of p53 affected the biological behavior of oncogene DRAM2
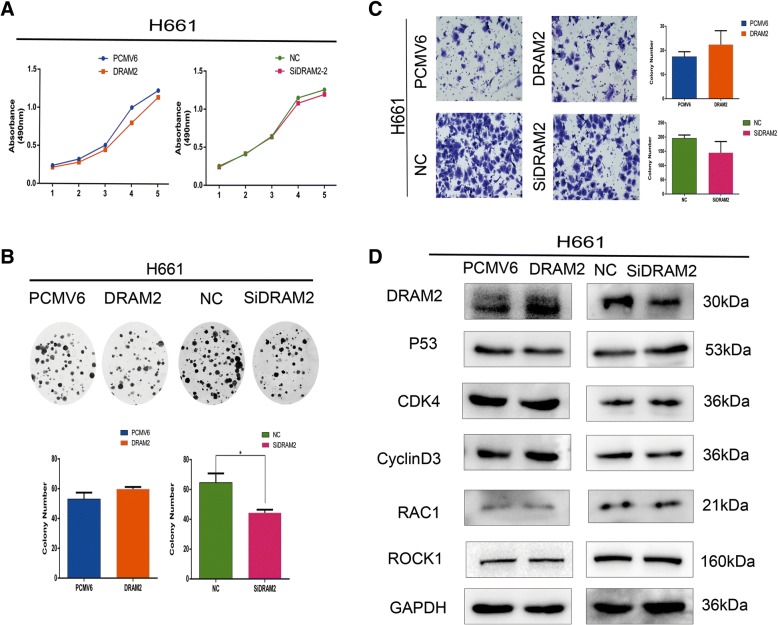
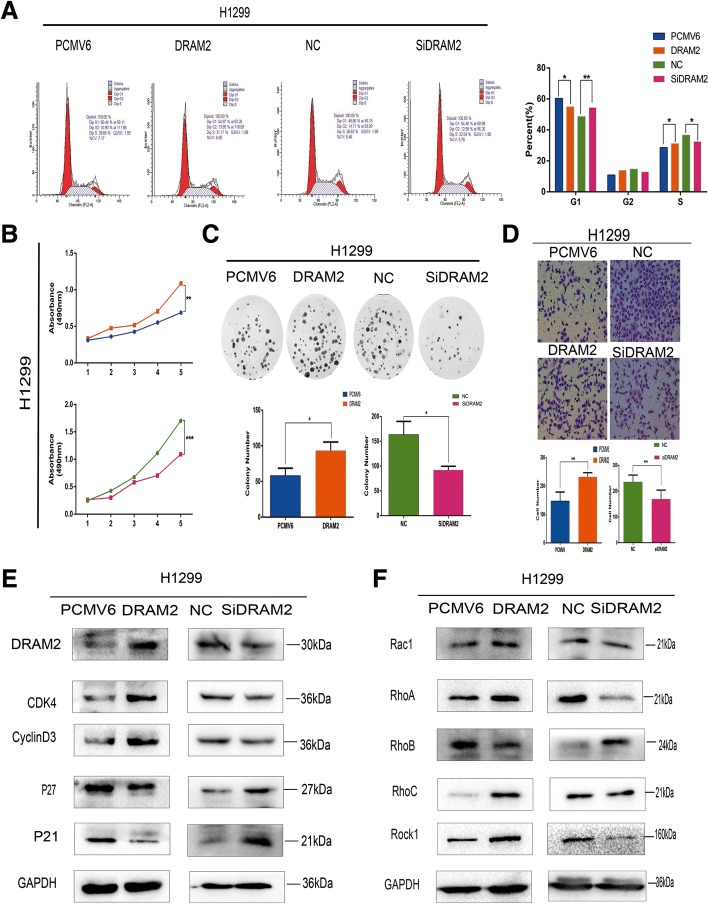
To investigate whether the expression of p53 is involved in functional activity of DRAM2, we chose the cell lines H661, which was p53 overexpressed, and H1299, which was p53 lacked, to downregulate and upregulate DRAM2, respectively, and performed transwell and MTT assays as well as colony formation and cell cycle analysis to observe the migration and proliferation changes. We compared the results with those in A549 and SK cells and found that p53 overexpression repressed the function of DRAM2 in cell proliferation and migration (Fig. 6), which indicates that DRAM2 may function as an oncogene via the p53-signaling pathway,and DRAM2 still functioned in the absence of p53 suggests that DRAM2 may choose another signaling pathway when p53-signaling pathway was blocked (Fig. 7). In sum, without p53 expression DRAM2 served as an effective oncogene, and overexpression of p53 restrained the function of DRAM2.
Fig. 6.
Overexpression of p53 restrained the effects of DRAM2 on cell migration and proliferation. a. MTT assay; b. Colony formation assay; c. Transwell migration were performed in the context of DRAM2 overexpression and downregulation in H661 cells. Only colony formation assay for both downregulated p53 and DRAM2 have statistical significance,p = 0.0482. d. Effects of DRAM2 levels on the expression of proteins associated with cell proliferation, migration, and p53 in transfected H661 cells
Fig. 7.
Absence of p53 did not affect the role of DRAM2 in cell migration and proliferation. a. Cell cycle analysis; b. MTT assay; c. Colony formation assay; d. Transwell migration were performed in the context of DRAM2 overexpression and downregulation in H1299 cells. p-values for differences in cells in G1 phase by cell cycle analysis for H1299 were DRAM2 vs PCMV6, p = 0.019, and SiDRAM2 vs NC, p = 0.009. p-values for differences in MTT assay data for the fifth day were DRAM2 vs PCMV6, p = 0.014, and SiDRAM2 vs NC, p = 0.001. The p-values for the colony formation assay were DRAM2 vs PCMV6, p = 0.0334, and SiDRAM2 vs NC, p = 0.0266. *p < 0.05, **p < 0.01, ***p < 0.001. e. Effects of DRAM2 expression levels on the expression of proteins associated with cell proliferation in H1299 cells f. Effects of DRAM2 expression levels on the expression of proteins associated with cell migration in H1299 cells
Discussion
We observed that DRAM2 was overexpressed in 170 out of 259 NSCLC tissues, and in 14 out of 20 NSCLC samples relative to that in normal tissues at the mRNA level, as well as in 12 out of 15 pairs of NSCLC tissue at the protein level. Moreover we discovered that the expression of DRAM2 related with TNM stage and lymph node metastasis. Then we found that the expression of DRAM2 in NSCLC cell lines was higher than that in normal bronchial epithelial cell lines. Further, the biological behavior of A549 and SK cells with DRAM2 either overexpressed or knocked down indicated that DRAM2 contributes to the migration and proliferation of NSCLC, showing that DRAM2 may be an oncogene in NSCLC. One limitation of our study was that we were unable to analyze the five-year survival rate of NSCLC patients given that the original samples were collected from 2014 to 2017, and insufficient time has lapsed for this data to be collected.
Given that the relationship between DRAM2 and p53 has remained controversial, we felt it necessary to define their relationship as it pertains to NSCLC. Since we now have evidence that DRAM2 represses the expression of p53, further studies should investigate how this occurs and which signal pathways DRAM2 is involved in. Given the fact that when p53 was overexpressed, DRAM2 did not act as a typical oncogene and appeared to serve as an oncogene when p53 was absent, we are left to conclude that DRAM2 may work via repressing the p53 signaling pathway, but when p53 is absent, DRAM2 may be forced to choose another pathway. Clearly, numerous questions remain, including whether DRAM2 represses the expression of p53 through phosphorylation of p53, whether DRAM2 is involved in p53 degradation, and whether DRAM2 represses p53 directly or by targeting another protein to form complexes leading to change in p53 expression indirectly. In future studies, we also hope to clarify the relationship between DRAM2, autophagy [28], and apoptosis since DRAM2 and p53 are both strongly correlated with autophagy and apoptosis [20].
Conclusion
In summary, in this article we showed that DRAM2 is overexpressed in NSCLC and promotes migration and proliferation of NSCLC cells. Further, DRAM2 repressed p53 expression and, conversely, p53 repressed DRAM2 expression. Finally, similar to the negative relationship between DRAM2 and p53 expression, the lower the expression of p53, the more successfully DRAM2 functioned as an oncogene and vice versa. Elucidation of the mechanisms behind these findings is still needed. Furthering our knowledge of DRAM2 will advance the possibility of this gene becoming a therapeutic target with clinical significance.
Acknowledgments
We would like to thank Editage (www.editage.cn) for English-language editing.
Funding
This work was supported by the Liaoning Province Colleges and Universities.
Innovation Team (LC2015029), Liaoning Provincial Education Department.
Availability of data and materials
All data generated or analyzed during this study are included in this published article. Further details are available from the corresponding author upon request.
Abbreviations
- CDK4
Cyclin dependent kinase 4
- DAPI
4,6-diamino-2-phenyl indole
- DMEM
Dulbecco Modified Eagle Medium
- DMSO
Dimethyl sulfoxide
- DRAM2
Damage-regulated autophagy modulator 2
- ECL
Electrochemiluminescence
- FACS
Fluorescence activated cell sorter
- FBS
Fetal bovine serum
- GAPDH
Glyceraldehyde 3-phosphate dehydrogenase
- HBE
Human bronchial epithelioid cells
- HRP
Horseradish peroxidase
- MEM
Modified Eagle Medium
- MTT
3-(4, 5-dimethylthylthiazol-2yl-)-2, 5-diphenyl tetrazolium bromide
- NC
Negative control
- NSCLC
Non-small cell lung cancer
- PBS
Phosphate-buffered saline
- PVDF
Polyvinylidene fluoride
- RAC1
Rac family small GTPase 1.
- RHOA
Ras homolog family member A
- RHOB
Ras homolog family member B
- RHOC
Ras homolog family member C
- ROCK1
Rho-associated protein kinase
- SDS-PAGE
sodium dodecyl sulfate, sodium salt-polyacrylamide gel electrophoresis
- siRNA
Small-interfering RNA
- SPSS
Solutions Statistical Package for the Social Sciences
- TBS
Tris-HCl buffer solution
- TMEM77
Transmembrane protein77.
- TNM
Tumor node metastases
Authors’ contributions
MW designed the study, conducted experiments, acquired and analyzed data, and wrote the manuscript. HR, LH, JJ, YX, SZ, QW, HS, XJ and RD conducted the experiments and acquired data. XQ was responsible for the conception and supervision of the study and wrote the manuscript. All authors corrected drafts and approved the final version of the manuscript.
Ethics approval and consent to participate
This study was approved by the Medical Research Ethics Committee of China Medical University and informed consent was obtained from all patients.
Consent for publication
Not applicable.
Competing interests
The authors declare that they have no competing interests.
Publisher’s Note
Springer Nature remains neutral with regard to jurisdictional claims in published maps and institutional affiliations.
Contributor Information
Muli Wudu, Email: wdmldywrty@163.com.
Hongjiu Ren, Email: 355970063@qq.com.
Linping Hui, Email: 46236572@qq.com.
Jun Jiang, Email: 1634365033@qq.com.
Siyang Zhang, Email: neko200321063@126.com.
Yitong Xu, Email: 573385698@qq.com.
Qiongzi Wang, Email: 164220719@qq.com.
Hongbo Su, Email: 1055381795@qq.com.
Xizi Jiang, Email: 811747131@qq.com.
Runa Dao, Email: 251156876@qq.com.
Xueshan Qiu, Email: xsqiu@cmu.edu.cn.
References
- 1.Salo PP, Vaara S, Kettunen J, Perola M, et al. Genetic variants on chromosome 1p13.3 are associated with non-ST elevation myocardial infarction and the expression of DRAM2 in the Finnish population. PLoS One. 2015;10(10):e0140576. doi: 10.1371/journal.pone.0140576. [DOI] [PMC free article] [PubMed] [Google Scholar]
- 2.Sergouniotis PI, McKibbin M, Robson AG, Bolz HJ, De Baere E, Muller PL, et al. Disease expression in autosomal recessive retinal dystrophy associated with mutations in the DRAM2 gene. Invest Ophthalmol Vis Sci. 2015;56(13):8083–8090. doi: 10.1167/iovs.15-17604. [DOI] [PubMed] [Google Scholar]
- 3.El-Asrag ME, Sergouniotis PI, McKibbin M, Plagnol V, Inglehearn CF, et al. Biallelic mutations in the autophagy regulator DRAM2 cause retinal dystrophy with early macular involvement. Am J Hum Genet. 2015;96(6):948–954. doi: 10.1016/j.ajhg.2015.04.006. [DOI] [PMC free article] [PubMed] [Google Scholar]
- 4.Kim JK, Lee HM, Park KS, Shin DM, Kim TS, Kim YS, et al. MIR144* inhibits antimicrobial responses against mycobacterium tuberculosis in human monocytes and macrophages by targeting the autophagy protein DRAM2. Autophagy. 2017;13(2):423–441. doi: 10.1080/15548627.2016.1241922. [DOI] [PMC free article] [PubMed] [Google Scholar]
- 5.Zeng CW, Chen ZH, Zhang XJ, Han BW, Lin KY, Li XJ, et al. MIR125B1 represses the degradation of the PML-RARA oncoprotein by an autophagy-lysosomal pathway in acute promyelocytic leukemia. Autophagy. 2014;10:1726–1737. doi: 10.4161/auto.29592. [DOI] [PMC free article] [PubMed] [Google Scholar]
- 6.Chen ZH, Wang WT, Huang W, Fang K, Sun YM, Liu SR. The IncRNA HOTAIRM1 regulates the degradation of PML-RARA oncoprotein and myeloid cell differentiation by enhancing the autophagy pathway. Cell Death Differ. 2017;24(2):212–224. doi: 10.1038/cdd.2016.111. [DOI] [PMC free article] [PubMed] [Google Scholar]
- 7.Park SM, Kim K, Lee EJ, Kim BK, Lee TJ, Seo T, et al. Reduced expression of DRAM2/TMEM77 in tumor cells interferes with cell death. Biochem Biophys Res Commun. 2009;390(4):1340–4. doi: 10.1016/j.bbrc.2009.10.149. [DOI] [PubMed] [Google Scholar]
- 8.Crighton D, Wilkinson S, O'Prey J, Syed N, Smith P, Harrison PR, et al. DRAM, a p53-induced modulator of autophagy, is critical for apoptosis. Cell. 2006;126(1):121–134. doi: 10.1016/j.cell.2006.05.034. [DOI] [PubMed] [Google Scholar]
- 9.O'Prey J, Skommer J, Wilkinson S, Ryan KM. Analysis of DRAM-related proteins reveals evolutionarily conserved and divergent roles in the control of autophagy. Cell Cycle. 2009;8(14):2260–2265. doi: 10.4161/cc.8.14.9050. [DOI] [PubMed] [Google Scholar]
- 10.Pierdominici M, Maselli A, Locatelli SL, Ciarlo L, Careddu G, Patrizio, et al. Estrogen receptor β ligation inhibits Hodgkin lymphoma growth by inducing autophagy. Oncotarget. 2017;8(5):8522–8535. doi: 10.18632/oncotarget.14338. [DOI] [PMC free article] [PubMed] [Google Scholar]
- 11.Bai S, Tian B, Li A, Yao Q, Zhang G, Li F. MicroRNA-125b promotes tumor growth and suppresses apoptosis by targeting DRAM2 in retinoblastoma. Eye (Lond) 2016;30(12):1630–1638. doi: 10.1038/eye.2016.189. [DOI] [PMC free article] [PubMed] [Google Scholar]
- 12.Garcia-Peterson LM, Ndiaye MA, Singh CK, Chhabra G, Huang W, Ahmad N. SIRT6 histone deacetylase functions as a potential oncogene in humanmelanoma. Genes Cancer. 2017;8(9–10):701–712. doi: 10.18632/genesandcancer.153. [DOI] [PMC free article] [PubMed] [Google Scholar]
- 13.Buckhaults P, Rago C, St Croix B, Romans KE, Saha S, Zhang L, et al. Secreted and cell surface genes expressed in benign and malignant colorectal tumors. Cancer Res. 2001;61:6996–7001. [PubMed] [Google Scholar]
- 14.Anami K, Oue N, Noguchi T, Sakamoto N, Sentani K, Hayashi T, et al. Search for transmembrane protein in gastric cancer by the Escherichia coli ampicillin secretion trap: expression of DSC2 in gastric cancer with intestinal phenotype. J Pathol. 2010;221(3):275–284. doi: 10.1002/path.2717. [DOI] [PubMed] [Google Scholar]
- 15.Torre LA, Bray F, Siegel RL, Ferlay J, Lortet-Tieulent J, Jemal A. Global cancer statistics, 2012. CA Cancer J Clin. 2015;65(2):87–108. doi: 10.3322/caac.21262. [DOI] [PubMed] [Google Scholar]
- 16.Ferlay J, Soerjomataram I, Dikshit R, et al. Cancer incidence and mortality worldwide: sources, methods and major patterns in GLOBOCAN 2012. Int J Cancer. 2015;136:E359–E386. doi: 10.1002/ijc.29210. [DOI] [PubMed] [Google Scholar]
- 17.Ettinger DS, Wood DE, Akerley W, Bazhenova LA, Borghaei H, Camidge DR, et al. Non-small cell lung Cancer, version 6.2015 J Natl Compr Canc Netw 2015;13(5):515–524. [DOI] [PubMed]
- 18.Howlader N, Noone AM, Krapcho M, et al. SEER Cancer Statistics Review, 1975–2014, National Cancer Institute. Bethesda, MD, based on November 2016 SEER data submission, posted to the SEER web site, April 2017.
- 19.Molina-Vila MA, Bertran-Alamillo J, Gascó A, Mayo-de-las-Casas C, Sánchez-Ronco M, Pujantell-Pastor L, et al. Nondisruptive p53 mutations are associated with shorter survival in patients with advanced non-small cell lung cancer. Clin Cancer Res. 2014;20:4647–4659. doi: 10.1158/1078-0432.CCR-13-2391. [DOI] [PubMed] [Google Scholar]
- 20.Efeyan A, Serrano M. p53: guardian of the genome and policeman of the oncogenes. Cell Cycle. 2007;6:1006–1010. doi: 10.4161/cc.6.9.4211. [DOI] [PubMed] [Google Scholar]
- 21.Feng X, Liu H, Zhang Z, Gu Y, Qiu H, He Z. Annexin A2 contributes to cisplatin resistance by activation of JNK-p53 pathway in non-small cell lung cancer cells. J Exp Clin Cancer Res. 2017;36(1):123. doi: 10.1186/s13046-017-0594-1. [DOI] [PMC free article] [PubMed] [Google Scholar]
- 22.Gu MM, Gao D, Yao PA, Yu L, Yang XD, et al. p53-inducible gene 3 promotes cell migration and invasion by activating the FAK/Src pathway in lung adenocarcinoma. Cancer Sci. 2018:3. [DOI] [PMC free article] [PubMed]
- 23.Sun CY, Zhu Y, Li XF, Wang XQ, Tang LP, Su ZQ, et al. Scutellarin increases cisplatin-induced apoptosis and autophagy to overcome cisplatin resistance in non-small cell lung cancer via ERK/p53 and c-met/AKT signaling pathways. Front Pharmacol. 2018;9:92. doi: 10.3389/fphar.2018.00092. [DOI] [PMC free article] [PubMed] [Google Scholar]
- 24.Tanaka A, To J, O’Brien B, Donnelly S, Lund M. Selection of reliable reference genes for the normalisation of gene expression levels following time course LPS stimulation of murine bone marrow derived macrophages. BMC Immunol. 2017;18:43. doi: 10.1186/s12865-017-0223-y. [DOI] [PMC free article] [PubMed] [Google Scholar]
- 25.Bradford MM. A rapid and sensitive method for the quantitation of microgram quantities of protein utilizing the principle of protein-dye binding. Anal Biochem. 1976;72:248–254. doi: 10.1016/0003-2697(76)90527-3. [DOI] [PubMed] [Google Scholar]
- 26.Garufi A, Pistritto G, Baldari S, Toietta G, Cirone M, D'Orazi G. p53-dependent PUMA to DRAM antagonistic interplay as a key molecular switch in cell-fate decision in normal/high glucose conditions. J Exp Clin Cancer Res. 2017;36(1):126. doi: 10.1186/s13046-017-0596-z. [DOI] [PMC free article] [PubMed] [Google Scholar]
- 27.Gao Z, Shan J, Wang B, Qiao L, Chen D, Zhang Y. DRAM is involved in regulating nucleoside analog-induced neuronal autophagy in a p53-independent manner. Mol Neurobiol. 2018;55(3):1988–1997. doi: 10.1007/s12035-017-0426-5. [DOI] [PubMed] [Google Scholar]
- 28.Cabrera S, Maciel M, Herrera I, Nava T, Vergara F, Gaxiola M, et al. Essential role for the ATG4B protease and autophagy in bleomycin-induced pulmonary fibrosis. Autophagy. 2015;11(4):670–684. doi: 10.1080/15548627.2015.1034409. [DOI] [PMC free article] [PubMed] [Google Scholar]
Associated Data
This section collects any data citations, data availability statements, or supplementary materials included in this article.
Data Availability Statement
All data generated or analyzed during this study are included in this published article. Further details are available from the corresponding author upon request.


