

Abstract
The motor symptoms in Parkinson's disease (PD) have been linked to changes in the excitatory/inhibitory interactions of centers involved in the cortical-subcortical closed-loop circuits which connect basal ganglia (BG) and the brain cortex. This approach may explain some motor symptoms of PD but not others, which has driven the study of BG from new perspectives. Besides their cortical-subcortical linear circuits, BG have a number of subcortical circuits which directly or indirectly connect each BG with all the others. This suggests that BG may work as a complex network whose output is the result of massive functional interactions between all of their nuclei (decentralized network; DCN), more than the result of the linear excitatory/inhibitory interactions of the cortical-subcortical closed-loops. The aim of this work was to study BG as a DCN, and to test whether the DCN behavior of BG changes in PD. BG activity was recorded with MRI methods and their complex interactions were studied with a procedure based on multiple correspondence analysis, a data-driven multifactorial method which can work with non-linear multiple interactions. The functional connectivity of twenty parkinsonian patients and eighteen age-matched controls were studied during resting and when they were performing sequential hand movements. Seven functional configurations were identified in the control subjects during resting, and some of these interactions changed with motor activity. Five of the seven interactions found in control subjects changed in Parkinson's disease. The BG response to the motor task was also different in PD patients and controls. These data show the basal ganglia as a decentralized network where each region can perform multiple functions and each function is performed by multiple regions. This framework of BG interactions may provide new explanations concerning motor symptoms of PD which are not explained by current BG models.
Keywords: Parkinson's disease, Basal ganglia, Functional connectivity, Multiple correspondence analysis, Motor disorders
Abbreviations: BG, basal ganglia; BGmC, basal ganglia motor circuit; BOLD, blood oxygen level dependent; CC, correspondence coefficient; DCN, decentralized network; fcMRI, functional connectivity magnetic resonance imaging; GPe, external globus pallidum; GPi, internal globus pallidum; MCA, multiple correspondence analysis; MRI, magnetic resonance imaging; M1, primary motor cortex; MT, motor thalamus; PD, Parkinson's disease; Put, putamen; ROI, region of interest; SNr, substantia nigra reticulata; SNc, substantia nigra compacta; STN, subthalamic nucleus; S1, primary somatosensory cortex
Graphical abstract

Highlights
-
•
The classical basal ganglia model is based on linear excitatory/inhibitory interactions.
-
•
The classical model only explains part of the motor disorders of Parkinson's disease.
-
•
fcMRI images were studied with Multiple Correspondence Analysis (MCA).
-
•
MCA showed multiple non-linear interactions between basal ganglia.
-
•
Parkinson's disease induced marked changes of non-linear basal ganglia interactions.
1. Introduction
During the 1980s and 1990s, basal ganglia (BG) were grouped in cortico-subcortical closed-loop circuits by a model which was later widely used to explain the physiopathology of these regions. This classical BG-model arranges BG in linear networks which process cortical information, and return it to its cortical origin. One of these networks is the basal ganglia motor circuit (BGmC), which involves neurons projecting from the primary motor cortex (M1) to the putamen (Put), and from this region to the external globus pallidum (GPe), subthalamic nucleus (STN), internal globus pallidum (GPi) and substantia nigra reticulata (SNr). The information processed by these regions goes to the anterior thalamus (motor thalamus; MT) and then returns to the cortex where it modulates M1 activity. The BGmC is composed of three parallel linear networks, the direct (M1 → Put→SNr/GPi → MT → M1), the indirect (M1 → Put→GPe → STN → GPi/SNr → MT → M1), and the hyperdirect network (M1 → STN → SNr/GPi → MT → M1) (Fig. 1A1). This model estimates the overall dynamic of the BGmC as the result of the linear excitatory/inhibitory interactions within the BGmC(Albin et al., 1989; Alexander et al., 1986; DeLong, 1990). In Parkinson's disease (PD), the degeneration of dopaminergic nigro-striatal cells triggers a chain dysfunction of the excitatory/inhibitory interactions of the three BGmCs, which finally results in the depression of M1 activity which the classical BG-model associated to motor symptoms (DeLong and Wichmann, 2009; DeLong, 1990; Obeso et al., 1997) (Fig. 1A2). Although this model explained some motor symptoms (Canavan et al., 1989; Cazorla et al., 2014; Cui et al., 2013; DeLong and Wichmann, 2009; Kravitz et al., 2010; Yin, 2014, Yin, 2017), other symptoms remained unexplained. Thus, key facts such as why Tal (Canavan et al., 1989) or GPe (Soares et al., 2004) lesions do not result in bradykinesia, or why GPe lesions do not result in dyskinesia (DeLong and Wichmann, 2009), cannot be explained with this model. These mismatches promoted the development of new BG-models(Cannon et al., 2014; Cassidy et al., 2002; Khanna and Carmena, 2015; Leventhal et al., 2012; Mirzaei et al., 2017) which have brought additional explanations (Suppl 1) (Alonso-Frech et al., 2006; Dupre et al., 2016; Mallet et al., 2008; Mirzaei et al., 2017; Moran et al., 2011) but which do not completely explain the set of motor symptoms of the disease.
Fig. 1.
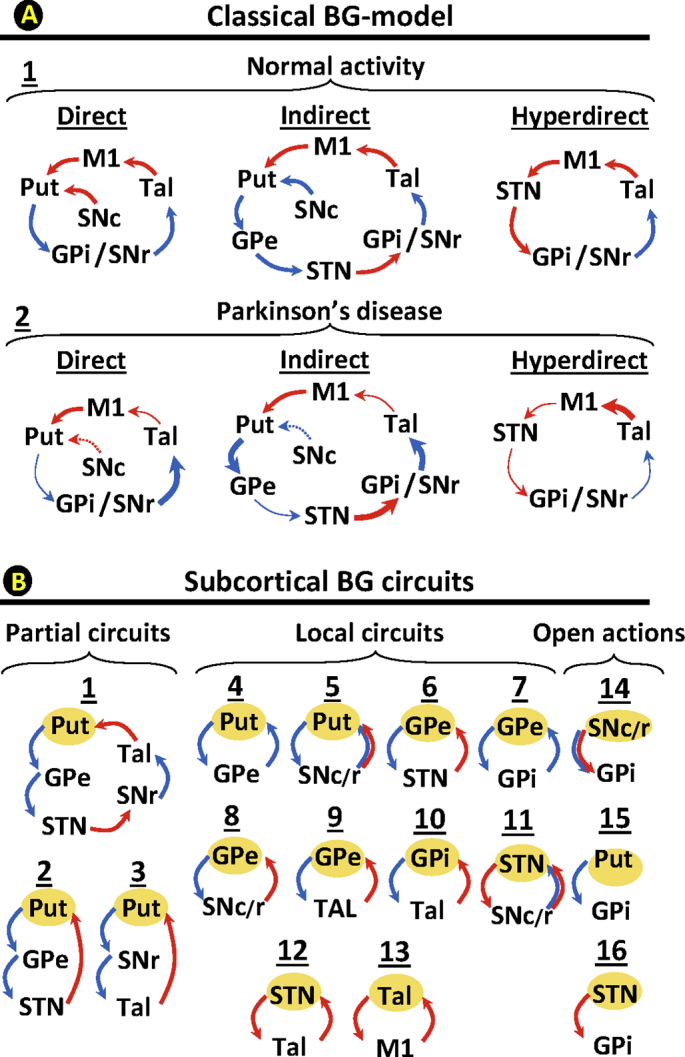
BG closed-loop circuits according to the classical BG-model (top) and possible subcortical BG-circuits. Top diagrams (A) show the direct pathway, the indirect pathway, and the hyperdirect pathway in healthy subjects (1) and PD-patients (2). The bottom diagrams (B) indicate possible partial (1–3), local (4–13) and open (14–16) subcortical circuits according to animal studies. Red arrows indicate excitatory pathways and blue arrows inhibitory pathways. Thick arrows indicate an increased basal activity, thin arrows a decreased basal activity, and dotted arrows degenerated pathways.M1: primary motor cortex, STN: subthalamic nucleus, Put: post-commissural putamen, GPe: external globus pallidum, GPi: internal globus pallidum, SN substantia nigra, and MT: motor thalamus, D: direct pathway, I: indirect pathway, HD: hyperdirect pathway.
Besides the cortical-subcortical linear loops commented above, the BGmC has a number of subcortical circuits (McHaffie et al., 2005) which directly or indirectly connect each BG with all the other BG (Suppl 2). This suggests that, unlike linear networks whose output is the result of the local interactions between the consecutive elements of their linear circuits (e.g. classical BG-model), BG may work as a complex network whose output may be the result of the massive functional interconnections between most or all of their elements. These networks do not have central elements which control the activity of the other elements of the circuit. Instead, the global dynamic of the networks is the result of multiple interactions between their centers (decentralized networks; DCNs) (Abel et al., 2016; Sorrentino et al., 2016; Wang et al., 2018). Because the dynamic of DCNs involves the simultaneous interactions of most of their elements, the study of these networks requires the simultaneous recording of all their elements, a recording that was not technically possible when the classical BG-model was developed, but which is now feasible with new neuroimaging methods. Magnetic resonance imaging (MRI) methods can make parallel recordings of the activity of all BG, and, although their time-resolution is not enough to detect the fast interactions of brain regions (Cannon et al., 2014; Cassidy et al., 2002; Khanna and Carmena, 2015, Khanna and Carmena, 2017; Llanos et al., 2013), they distinguish slow interactions which have proved useful to identify the functional connectivity of neuronal networks(functional connectivity MRI,fcMRI) (Arthurs and Boniface, 2002; Logothetis, 2002; Logothetis and Wandell, 2004; Raichle, 1998; Raichle and Mintun, 2006). Some methods for analyzing fcMRI data examine the connectivity of only two regions at the same time (e.g. correlation methods), but other methods such as the independent component analysis (Damoiseaux et al., 2006; Fox and Raichle, 2007; Goebel et al., 2006) and data-driven sparse GLM (Lee et al., 2011; Su et al., 2016) can simultaneously work with multiple regions. Most multifactorial methods assume a linear interaction between regions which is uncommon in BG (Marceglia et al., 2006; Rodriguez-Sabate et al., 2017; Schroll and Hamker, 2013), where many neurons display a non-linear dynamic (Rodriguez et al., 2003a; Rodriguez et al., 2003b, Rodriguez et al., 2003c). We have recently developed a multifactorial method for researching fcMRI data which is based on the multiple correspondence analysis (MCA) (Rodriguez-Sabate et al., 2017), this is a multifactorial method which can work with non-linear relationships. This method was applied here to study BG as DCN, and to describe the effect of PD on the DCN behavior of BG for the first time.
2. Methods
2.1. Participants
Thirty eight right-handed volunteers with no history of neurological or mental disease (other than PD) participated in this study. Two groups were included, a control group (eighteen age-matched subjects, 9 males and 9 females between 34 and 70 years of age) and a PD group (twenty PD patients, 10 males and 10 females between 39 and 72 years of age). Patients were diagnosed with idiopathic PD by two experienced neurologists (>15 years of diagnostic experience in movement disorders), who used the medical history, physical and neurological examinations, response to levodopa, laboratory examinations and MRI to exclude other diseases. The severity of motor disorders was assessed according to the Hoehn & Yahr scale and the Unified Parkinson's Disease Rating Scale III (UPDRS III). Patients with dementia (Montreal Cognitive Assessment and Mini Mental State Examination), parkinsonism induced by other degenerative diseases (post-encephalitic parkinsonism, Shy-Drager syndrome, drug- or toxin-induced parkinsonism, etc) were excluded. Patients were diagnosed between 2011 and 2016 in the Basal Ganglia Unit of the Neurological Service of the La Candelaria University Hospital in Tenerife, Canary Islands. In order to reduce the impact of medication on the studies, anti-parkinson drugs were not administered within 24 h prior to the study. Written informed consent was provided by all participants, all procedures were in accordance with the ethical standard of the 1964 Helsinki declaration, and the study was approved by an institutional review board (Institutional Human Studies Committee of La Laguna University).
2.2. Data collection
The basic experimental procedures were similar to those reported in recent studies (Rodriguez-Sabate et al., 2015; Rodriguez-Sabate et al., 2017), but using two experimental conditions, motor-resting (subjects did not perform any planned task) and motor-task (subjects performed a repetitive sequence of finger extensions/flexions with the right-hand). BOLD-contrast images (4x4x4 mm voxels in-plane resolution; echo-planar imaging with repetition time 1.6 s; echo time 21.6 msec; flip angle 90°) were recorded in blocks of 100 volumes in the following sequence: motor block → resting block → motor block → resting block (400 total volumes / subject = 100 volumes × 2 motor-blocks × 2 resting-blocks). Frames 1–5 and 95–100 of each block were removed. fMRI data were co-registered with 3D anatomical images (1 × 1 × 1 mm voxel resolution; repetition time 7.6 ms; echo time 1.6 ms; flip angle 12°; 250 × 250 mm field of view; 256 × 256 sampling matrix). A representative region of interest (ROI) of each BG was located on a subject-by-subject basis by considering: 1. the Talairach coordinates, 2. the shape of the nucleus, and 3. the anatomical relationship of the nucleus with neighboring structures. All regions were identified in coronal slices located 4–27 mm posterior to the anterior commissure and according to a previously reported procedure (Rodriguez-Sabate et al., 2017). All data sets were normalized to the Talairach space (Table 1 shows the position and size of ROIs).
Table 1.
Coordinates (Talairach) are shown in mm. The size of the ROIs is shown by the number of their voxels.
| X | Y | Z | Size | |
|---|---|---|---|---|
| Primary somatosensory cortex | 34.3 ± 5.8 | −22 ± 5.2 | 49.1 ± 4.92 | 36.1 ± 8.1 |
| Primary motor cortex | 39.2 ± 5.1 | −18.2 ± 4.5 | 46.9 ± 6.1 | 36.2 ± 11.9 |
| Putamen | 24.3 ± 1.1 | −5.3 ± 1.6 | 0.2 ± 0.2 | 23.1 ± 3.2 |
| External pallidum | 12.8 ± 4.4 | −2.6 ± 0.7 | 2.5 ± 1.6 | 10.3 ± 2.2 |
| Internal pallidum | 14.1 ± 1.7 | −6.2 ± 1.4 | −1.3 ± 1.3 | 12.3 ± 1.4 |
| Subthalamic nucleus | 10.8 ± 1.4 | −13.1 ± 2.1 | −4.3 ± 2.4 | 2.2 ± 0.5 |
| Substantia nigra | 7.2 ± 1.2 | −19.2 ± 1.4 | −8.4 ± 2.5 | 49.8 ± 9.3 |
| Ventral-anterior thalamus | 9.3 ± 1.4 | −10.1 ± 1.6 | 7.3 ± 2.2 | 29.8 ± 7.9 |
2.3. Data preprocessing
The data preprocessing included a slice scan time correction, a 3D motion correction, and a time filter which eliminates frequencies below 0.009 Hz. Studies with images showing a displacement >0.5 mm or a rotation >0.5degrees were removed. No spatial smoothing was performed. Residual motion artifacts and physiological signals unrelated to neural activity (e.g. respiration, cardiac activity) were removed by regressing the BOLD-signals recorded throughout the brain with the mean average of the BOLD-signals recorded in white matter and brain ventricles (Jo et al., 2013; Power et al., 2014).
2.4. Multiple correspondence analysis (MCA)
MCA identified the most frequent coinciding patterns of BG activity (BG-activity profiles). These profiles were ordered according to their relative relevance (quantified by eigenvalues), the most relevant profile is in dimension 1, the second most relevant in dimension 2 and so on. Seven dimensions were chosen because they accumulated >95% of the information (accumulated inertia) and the last dimension provided enough reliable quality (eigenvalue >0.05) (Fig. 3). The BG-activity profiles were identified without human supervision (driven by data).
Fig. 3.

The Eigenvalue and Accumulated Inertia of the seven MCA-dimensions of the Control and Parkinson's patients during resting and motor activity.
The initial computing was the normalization (around their mean value) and binarization of BOLD-data (see Fig. 2). BOLD-signals were binarized by replacing data higher than the mean value with the number 1 and those lower or equal to the mean value with the number 0. Binarized data were then used to compute the contingence table, which is a matrix where columns represent BG and rows represent the high (1) or low (0) status of all BG at a particular recording-time. Thus, each row showed the activity profile of all BG at a particular time (1.6 s time resolution). The frequency of inter-region co-activations was grouped in the Burt table, which displayed the number of low-low (0–0), high-high (1–1), high-low (1–0) and low-high (0–1) coincidences between the different BG. Finally, MCA used the Burt table to identify all the BG-activity profiles, which were later ordered according to their relative relevance. The Burt table was also used to compute the Correspondence Coefficient (see later).
Fig. 2.

Multiple Correspondence Analysis (MCA) and Correspondence Coefficient (CC) methods. BOLD-signals of averaged ROIs were normalized (around their mean value) and categorized (binarized by replacing data higher than the mean value with the number 1 and those lower or equal to the mean value with the number 0). Binarized data were used to compute the Contingence Table, which at each recording-time shows the high/ low status of each of the BG (BG-activity profile). The Burt table shows the frequency of low-low (0–0), high-high (1–1), high-low (1–0) and low-high (0–1) coincidences between every two BG. Working with the Correspondence and the Burt tables, MCA identifies the most frequent BG-coincidences of activity (BG-activity profiles) and segregates and sorts them into a seven dimensional space. The characteristics and reliability of each region in each configuration was computed with the different procedures indicated at the bottom-left. The bottom-right indicates the procedure used to compute the CC.
MCA builds a multidimensional space normalized to a Chi2 metric (values ranged between −1 and + 1), with each dimension showing a different BG-activity profile. In each dimension, BG far from the axis (near to −1/+1) have most of the information of the dimension, with BG with in-phase BOLD fluctuations being aggregated in the same extreme position of the dimension, and those with anti-phase BOLD fluctuations located in the opposite position of the dimension (+1 vs. -1). BG located near the axis are not relevant for the BG-activity profile of the dimension. Thus, each BG-activity profile shows in-phase activity regions (in the same side of the dimension), anti-phase activity regions (in the opposite side of the dimension), and regions with a no relevant role for this BG-activity profile (in either side but near the axis of the dimension).
The confidence of the MCA was tested with different procedures. Inertia (dispersion of data around their centroid) was used as a representation of information, with the total inertia being a normalized representation of inertia (0, no information / 1: all available information) which is useful to estimate the distribution of information across the different MCA-dimensions. This distribution may be observed in the accumulated inertia, where the inertia of each dimension is accumulated with the inertia of the lower dimensions (values in % of total inertia). The relative relevance of each dimension to the total inertia can be also computed by the eigenvalue (also normalized between 0 and 1). The relative inertia normalizes the information of each dimension between 0 and 1, and may be used to estimate the relative contribution to each BG to each BG-activity profile.
2.5. Correspondence coefficient (CC)
Although MCA may reveal hidden BG-activity profiles, it does not establish their statistical value. The correspondence coefficient (CC) was used here to obtain the statistical significance of the in-phase/anti-phase interactions of 2 particular regions of the BG-activity profile. The CC uses the Burt table (bottom-right Fig. 2) to estimate the co-activation probability of two BG. CC represents the coincidence degree (high-high plus low-low states) vs. anti-coincidence degree (high-low plus low-high states) of the activity of two regions (no-coincidence indicates a random relationship between the high and low states of two regions). CC was normalized between +1 (coincidence of low-low and high-high status) and − 1 (when a region was in a high status the other was in a low status and vice versa). CC values near 0 indicate that the status of two BG regions has a random relationship. The statistical significance of the CC was estimated by the Chi2 test of independence. CC studies the relationship between two BG and cannot distinguish the simultaneous interaction of multiple BG or complex interactions between two BG (e.g. simultaneous in-phase and anti-phase relationships).
3. Results
No statistical differences were found for the age of the PD group (57.2 ± 6.1 years old; mean ± standard error) and the control group (58.4 ± 9.1 years old). All PD patients showed an early-to-mid clinical motor stage in the Hoehn & Yahr scale (1.60 ± 0.14; all patients had a scale stage of I or II), in the UPDRS III values (13.16 ± 1.46) and in the Schwab and England (93 ± 2.2). Akinesia was the predominant symptom, with all patients showing an obvious delay in movement initiation and a low expression of tremor. Neither patients nor aged-matched controls showed dementia (Montreal Cognitive Assessment values higher than 27 and the Mini Mental State Examination values higher than 27 in all cases) or abnormalities in the MRI studies (intracranial space-occupying lesions, vascular malformations, stroke, etc). Data from 3 PD patients and 2 control subjects were excluded from analysis due to excessive motion during the MRI recordings.
Fig. 3 (left side) shows the eigenvalues computed for both groups (controls and PD patients) under resting and motor task conditions. Eigenvalues decreased from 0.24–0.27 in the first dimension to 0.07 in the seventh dimension, which validates the sorting of BG-activity profiles according to their relative relevance. Accumulated inertia also supports this sorting with values which increased from 25% to 95% (right-side Fig. 3). Thus, the seven dimensions included in the study contained 94% of the MCA-information, with the least significant dimension 7 having a high enough eigenvalue (>0.07) for the BG-activity profile of this dimension to be reliable.
The expression “functional network” (commonly used in fcMRI studies) was not used here because it is commonly used to refer to regions with in-phase BOLD-fluctuations and which are linked by direct pathways. Some BG-activity profiles included regions with no direct connections and which had anti-phase BOLD-fluctuations. Thus, the term functional configuration (instead of functional network) was considered more appropriate.
3.1. Dimension 1: BG synchronous configuration
The control-group showed a Put-GPe-STN-GPi-SN-MT cluster in the positive axis of dimension 1 (Fig. 4E/4I), which had 25% of total inertia. Two sub-clusters were observed. The GPe-STN-SN-GPi cluster was located in the most extreme position of dimension 1 (Fig. 4I) and had the highest relative inertia (16/24/23/19%, respectively) (Fig. 5I). Regions involved in the BG communication with the cortex (Put-MT) were located nearer the axis (Fig. 4E) and had a less relevant relative inertia (6/10% respectively) (Fig. 5E).The same functional profile (Figs. 4G/4K) and relative inertia (Figs. 5G/5 K) were found during the motor task. Because this in-phase configuration segregates BG from the cortex, it is referred to here as the BG synchronous configuration.
Fig. 4.

The space-distribution of each BG in the seven MCA-dimensions during resting (left-side) and motor activity (right-side). The significant BG and cortical areas of the functional configuration of each dimension are surrounded by colored circles (linked by lines). Each BG-configuration is identified with a number which refers to the name of the configuration at the bottom of the Fig. M1: primary motor cortex, STN: subthalamic nucleus, Put: post-commissural putamen, GPe: external globus pallidum, GPi: internal globus pallidum, SN substantia nigra, and MT: motor thalamus.
Fig. 5.

Relative inertia of each BG in the seven MCA-dimensions during resting (left-side) and motor activity (right-side). The significant BG and cortical areas of the functional configuration of each dimension are surrounded by colored areas. Each BG-configuration is identified with a number which refers to the name of the configuration at the bottom of the fig. M1: primary motor cortex, STN: subthalamic nucleus, Put: post-commissural putamen, GPe: external globus pallidum, GPi: internal globus pallidum, SN substantia nigra, and MT: motor thalamus.
The PD-group had the same Put-GPe-STN-GPi-SN-MT cluster (Fig. 4F/4J) and relative inertia (Fig. 5F/5J) but in the negative axis of dimension 1, a difference which does not indicate anything in particular because all regions were in the same side of the axis, which shows that their activity was in-phase. The motor task did not change the distribution (Fig. 4H/4 L) and relative inertia (Fig. 5H/5 L) of the BG synchronous configuration.
Thus, the most relevant MCA dimension 1 segregated the GPe-STN-SN-GPi from the input/output BG (Put-MT), and both sub-groups were segregated from cortical areas (M1-S1), which were located near the axis and did not provide any relevant information for this dimension.
3.2. Dimension 2: cortical synchronous configuration
The control group had a M1-S1 cluster in the positive axis of dimension 2 (Fig. 4A) which had most of the relative inertia (44/45%) of the dimension (Fig. 5A). These findings were also found during motion (Fig. 4C/5C). Because this functional configuration included both areas in the same axis, it is referred to here as the cortical synchronous configuration. PD patients had a similar M1-S1 cluster (Fig. 4B/5B), which did not change with the motor task either (Fig. 4D/5D).
Thus, the second most relevant MCA dimension (dimension 2) segregated the cortical areas (M1-S1) from all BG (GPe-STN-SN-GPi-Put-MT), which is a finding observed in controls and PD patients during both resting and motion.
3.3. Dimension 3: cortical-BG transfer/synchronous configuration and Indirect-BG configuration
The control group had a Put/MT cluster in the positive axis of dimension 3 (Fig. 4E) which contained 65.1% of the relative inertia of the dimension (Fig. 5E). The same cluster (Fig. 4G) with a similar inertia (62.2%; Fig. 5G) was found during the motor task. The M1, S1, GPe, STN, SN and GPi were near the axis (Fig. 4A/4I) and had a low relative inertia (Fig. 5A/5I).The motor task did not change either the Put-MT grouping (Fig. 4C) or its relative inertia (Fig. 5C). Because these regions are involved in the transfer of information between the cortex and BG, and both regions were located in the same axis, this functional grouping is referred to here as the cortical-BG transfer/synchronous configuration.
The above configuration was not found in PD because the MT was in a position near the axis (Fig. 4F) and had a very low relative inertia (0.1%; Fig. 5F). The MT was replaced in this dimension by the GPe (located with the Put in the positive axis), and by the STN and SN (both located in the negative axis) (Fig. J). This grouping did not change in PD patients during the motor task (Figs. 4H/4 L and 5H/5 L). As the Put-GPe-STN-SN are included in the indirect pathway of the classical model, this functional grouping is referred to as indirect BG configuration.
3.4. Dimension 4: cortical-BG transfer/asynchronous configuration and GPi-MT asynchronous configuration
A clear advantage of MCA regarding other fcMRI methods is its ability to identify more than one functional connectivity in each region and the Put-MT configurations are a good example of this. The Put-MT configuration had in-phase activity in dimension 3 and anti-phase activity in dimension 4 (Fig. 4E/5E). The anti-phase activity did not change with the motor task (Fig. 4G/5G). Since these regions are involved in the cortical-BG transfer of information, and both regions were located in a different axis, this functional grouping is referred to here as the cortical-BG transfer/asynchronous configuration. Thus, the cortical-BG transfer/asynchronous configuration is the opposite of the cortical-BG transfer/synchronous configuration.
The cortical-BG transfer/asynchronous configuration was not found in PD. During the resting intervals, the MT moved to more extreme positions (Fig. 4F) and its relative inertia increased (75.7%; Fig. 5F), whereas the Put moved nearer to the axis (Fig. 4F) losing its relative inertia (0.0%; Fig. 5F). The position of the Put in these patients was occupied by the GPi (Fig. 4J), which was located in the opposite axis to where the MT was and had a high proportion of the relative inertia of dimension 4 (20.2%; Fig. 5J). This MT-GPi grouping was also found during the motor activity of PD-patients (Fig. 4H/4L and 5H/5L). Because these regions were located in opposite axes, this functional grouping is referred to here as GPi-MT asynchronous configuration.
3.5. Dimension 5: GPe-Put asynchronous configurationand GPe-GPi asynchronous configuration
The control group had a GPe-Put configuration in dimension 5 with both regions in opposite positions regarding the axis (Fig. 4E/4I). Although this configuration was also observed during the motor activity (Fig. 4G/4K), the relative inertia of the GPe decreased (from 68.1% to 50.0%; Fig. 5I/5 K) and that of the Put increased (from 16.5% to 33.0%; Fig. 5E/5G) in this case. As this configuration shows the Put and MT in opposite positions of the axis of the dimension, it is referred to here as the GPe-Put asynchronous configuration.
This configuration was not found in PD patients and was replaced by an anti-phase GPe-GPi activity during resting (Fig. 4J) and motor task (Fig. 4L) which had a relative inertia of 48/35% during resting (Fig. 5J), and 44/37% during motion (Fig. 5L).This new configuration is referred to as the GPe-GPi asynchronous configuration.
3.6. Dimension 6 vs. 7: cortical asynchronous configuration, SN-GPi asynchronous configuration, Put-SNsynchronous configuration, STN-SN asynchronous configuration and STN-Put synchronous configuration
The control group had M1-S1 anti-phase activity (Cortical asynchronous configuration) in dimension 6 which was the opposite of the cortical synchronous configuration found in dimension 2 (Fig. 4A). The motor task moved this configuration to dimension 7 (Fig. 4C), which was a displacement accompanied by an opposite displacement of the anti-phase SN-GPi configuration (SN-GPi asynchronous configuration) (Fig. 5I) of dimension 7 (Fig. 5J).Thus, control subjects showed a dimension exchange of two anti-phase configurations with motion, the M1-S1 anti-phase configuration (moved from dimension 6 to dimension 7), and the SN-GPi anti-phase configuration (moved from dimension 7 to dimension 6).
In PD patients, the cortical asynchronous configuration was not observed either during the resting (Fig. 4B) or motor activity (Fig. 4D). Dimension 6 showed Put-SN anti-phase activity during both resting (Fig. 4J) and motor activity (Fig. 4L), providing 65% (Fig. 5J) and 68% (Fig. 5L) of the respective relative inertia (Put-SN synchronous configuration). Dimension 7 showed STN-SN anti-phase activity (STN-SN asynchronous configuration) during resting (Fig. 4J/5J) and STN-Put in-phase activity (STN-Put synchronous configuration) during motion (Fig. 4H/4 L), which account for >60% of the energy of the dimension (Fig. 5H/5 L). STN-SN anti-phase activity and Put-SN and STN-Put in-phase activities were found in PD patients, who did not show the M1-S1 and SN-GPi anti-phase activities found in controls.
3.7. A summary of the PD action on the functional configurations of BG
Fig. 6 shows a summary of the functional configurations identified by MCA in healthy controls (left side) and PD patients (right side) during resting (top) and the motor task (bottom). The in-phase configurations are shown by brown areas and the anti-phase configurations by blue areas. Healthy controls had three configurations with in-phase activity: BG synchronous (C1), cortical synchronous (C2) and Cx-BG transfer/synchronous (C3) configurations. C1 and C2 were also found in PD patients, but the synchronous activity of C3 was not found in PD and the indirect BG configuration (C3+) was found in its place. Healthy controls had four configurations with asynchronous activity: Cx-BG transfer/asynchronous (C4), GPe-Put asynchronous (C5), Cx asynchronous (C6) and BG-output asynchronous (C7) configurations. All these asynchronous activities were not found in PD patients, and new Put-GPe-STN-SN synchronous/asynchronous (C3+), MT-GPi asynchronous (C4+), GPe-GPi asynchronous (C5+), Put-SN synchronous (C6+), STN-SN synchronous (C7+) and STN-Put synchronous (C7++) configurations appeared. Motor activity induced few effects in control subjects (a dimension exchange of C6 and C7). The effect of motion was different in PD patients, in whom C7+ was replaced by C7++.
Fig. 6.

Functional configurations identified by the MCA in healthy controls (left side) and PD patients (right side) during the resting task (top) and the motor task (bottom). In-phase configurations are shown by brown areas, anti-phase configurations by blue areas, and the combined in-phase/anti-phase configuration by a red area. Each configuration is shown by a number in a yellow circle (normal-resting configurations), a red circle (configurations which changed with motion) or a green circle (configurations which changed in Parkinson's disease). The name of the configuration corresponding to each number is shown at the bottom of the fig. M1: primary motor cortex, STN: subthalamic nucleus, Put: post-commissural putamen, GPe: external globus pallidum, GPi: internal globus pallidum, SN substantia nigra, and MT: motor thalamus.
3.8. The BG interactions according to the correspondence coefficient (CC)
Fig. 7 shows the CC of the control group during resting. Peripheral images show the CC of a particular region (top of figures) regarding all the other regions (bottom of figures). Fig. 7I shows a summary of the statistically significant CC for the different regions (positive CC are shown in red and negative CC in blue). Fig. 7J shows a summary of the classical BG pathways.
Fig. 7.

Correspondence Coefficient (CC) of the control group during the resting task. Peripheral graphics show the CC of the region at the top of each image with all the other regions (at the bottom of each image). The diagram in the middle shows a summary of the statistically significant CC for the different regions, red arrows connecting regions with a significant positive CC and blue arrows connecting regions with a significant negative CC. Non-significant CC are not shown. M1: primary motor cortex, STN: subthalamic nucleus, Put: post-commissural putamen, GPe: external globus pallidum, GPi: internal globus pallidum, SN substantia nigra, and MT: motor thalamus.
The in-phase activity of all BG found in dimension 1 (BG synchronous configuration in Fig. 4E/4I) agrees with the positive CC observed between all BG (Fig. 7C/7D/7E/7F/7G/7H/7I). The in-phase M1-S1 activity found in dimension 2 (Cx synchronous configuration in Fig. 4A) was also observed with CC (Fig. 7A/7B). The M1 (Fig. 7A) and S1 (Fig. 7B) showed a positive CC between them, and a negative CC with most BG regions (GPe-STN-SN-MT), thus suggesting that the BG synchronous and Cx synchronous configurations are not activated at the same time (this opposite activation is also shown in Fig. 7D/7E/7F/7G). The in-phase Put-MT activity found in dimension 3 (Cx-BG transfer/synchronous configuration in Fig. 4E) agrees with the positive CC observed between the Put and MT (Fig. 7C and D). Thus, the 3 main configurations identified by MCA agree with CC data (Fig. 7I). This agreement is possible because they are the most outstanding configurations (first three dimensions) and all regions of these configurations displayed an in-phase activity. However, CC (and other methods such as correlation methods) cannot identify the participation of a region in different networks, which is possible with the MCA method because it distributes the activity of each region across different MCA dimensions. The anti-phase activity of M1-S1 (Fig. 4A dimension 6) and Put-MT (Fig. 4E dimension 4) was not detected by the CC analysis because CC shows the overall result of both the in-phase and the anti-phase interactions, and because the in-phase interaction was stronger in both cases than the anti-phase interaction, the CC only showed the in-phase interactions. Thus, CC supports the MCA results but reveals fewer functional interactions than those shown by MCA. CC establishes the statistical values of the in-phase or anti-phase oscillation of two regions (Chi2 tables of the Burt table) but CC does not identify the interaction of multiple regions or the participation of a region in different functional configurations (it only detects the most powerful configuration). Thus, CC data must be considered with caution, and were not used here to analyze possible differences between controls and PD patients. CC shares these limitations with other methods which only identify interactions between two regions or which cannot detect the participation of a region in multiple functional networks (e.g. correlation methods).
4. Discussion
MCA identified seven functional configurations in the BGmC, some of which changed with motor activity. PD induced a marked reconfiguration of the BGmC, which eliminated some configurations and modified others. The effect of motion on the BGmC was also different in PD patients and controls. The joint use of fcMRI and MCA methods helps to understand the behavior of BG as a DCN, and to research the mechanisms involved in the motor disorders of PD.
4.1. Methodological considerations
MCA is a multivariate data-driven method which can identify hidden non-linear interactions between multiple regions which are undetectable by pair-wise comparison methods. Other multivariate methods such as the independent component analysis (Goebel et al., 2006; Meindl et al., 2010), clustering analysis (Li et al., 2009), and fuzzy (Windischberger et al., 2003) or hierarchical (Cordes et al., 2002) clustering analysis can also identify complex interactions of multiple regions, but their utility for studying non-linear interactions is limited (McKeown and Sejnowski, 1998). The present study used an MCA-based method to identify the regions showing “in-phase” (high coincidence of low-low and high-high BOLD-levels),“anti-phase”(coincidence of high-low and low-high BOLD-levels), and “independent”(unrelated BOLD-levels) activities.
Most BG participated in different functional configurations, thus supporting their involvement in a DCN-type network. In control subjects, the STN was included in only one configuration, but the M1, S1, GPe, GPi and SN were included in two configurations, the MT in three configurations, and the Put in four configurations (Top left Fig. 7). All BG involved in more than one configuration displayed both in-phase and anti-phase activities. The GPe is an example, showing in-phase activity with all BG (BG synchronous configuration) and anti-phase activity with the Put (GPe-Put asynchronous configuration). In some cases, this opposing behavior was observed between the same regions which, as happened with M1-S1, showed in-phase and anti-phase activity in the same recording session. This antagonistic behavior can be detected by MCA because the in-phase and anti-phase activities were displayed at different times, and thus were recorded in different rows of the contingence table. The antagonistic behavior is not detected by other methods which, as occurs with the correlation methods, integrate both activities and only identify the most relevant activity.
The eight regions included in the study can theoretically be grouped in 256 possible binary configurations, but only thirteen configurations were observed here, seven in healthy controls, five more configurations in resting PD patients, and one more in PD patients performing a motor task. Other possible configurations may also be working in BG, but only seven could be identified here because this is the maximum possible number of configurations which MCA can detect working with eight variables.
4.2. Segregating cortical and BG activity: the effect of PD on the cortex-BG interactions
Put-GPe-STN-GPi-SN-MT activity was in-phase in dimension 1, indicating that this synchronous configuration of BG is the most effective one. The M1 and S1 showed synchronous activity in the second most relevant dimension (cortical synchronous configuration). These two configurations together contain about 45% of the MCA-information (total inertia), and finding them during resting and motor task conditions suggests that they are not dependent on experimental conditions. MCA cannot show the possible relationships of these two functional configurations, but CC data suggest their alternating activation. M1-S1 regions on the one hand and Put-GPe-STN-SN-GPi-MT regions on the other hand showed CC values which agree with the in-phase activation of these regions in their respective configurations. However, the regions of both configurations showed negative CC values between them, suggesting an anti-phase activation of the BG-synchronous and the cortical-synchronous configurations. The BGmC could work as an oscillatory device which inhibits cortical activity when the BG are working, and the BG activity when the M1 and S1 are working. The finding of these two configurations in PD patients suggests that they are basic components of the brain activity that can withstand the action of PD on BG.
The M1 and S1 showed in-phase activity in dimension 2 and anti-phase activity in dimension 6, which suggests that M1 activity is depressed when sensitive information is being processed by the S1 which is depressed when the M1 executes motor plans. The finding of two functional interactions between the M1 and S1 was not surprising because these regions are linked to many cortical regions with which they perform functions not directly related to BG. However, the blockade of the M1-S1 anti-phase behavior observed in PD patients suggests that the M1-S1 asynchronous configuration requires a normal BG-activity.
The Put is the gateway of cortical information to BG, whereas the MT is the exit door through which the information processed in BG returns to the cortex. The Put and MT displayed two functional relationships, one showing their synchronous activation (dimension 3) and the other showing their asynchronous activation (dimension 4). The finding of two Put-MT configurations suggests that cortical areas and BG may be connected by two alternative mechanisms. The synchronous Put-MT activity (dimension 3) shows a parallel and simultaneous working of the input gateway (Put) and the exit door (MT), whereas their anti-synchronous connectivity (dimension 4) shows the Put and MT working at different times and with an anti-phase behavior (when the Put is activated the MT is not active and vice versa). The different wiring of the Put and MT may explain this difference. The Put receives projections from the cortex but it does not project to them. On the other hand, the MT connects bi-directionally with the cortex and projects to the Put. Thus, whereas the Put is basically an input region which receives information from the cortex and thalamus, the MT is an output region which interacts bi-directionally with the brain cortex and which modulates the cortical input to the Put (Nelson and Kreitzer, 2014; Smith et al., 2004). The medium spiny neurons which account for >90% of striatal neurons are normally quiet and only fire with a coordinated drive of multiple neurons of the cerebral cortex and thalamus (Yin, 2017). Thus, when the MT activates the Put both regions could be working simultaneously (Cx-BG transfer/synchronous configuration), but when the striatal neurons are not activated by thalamic projections, the Put remains inactive whereas the MT-M1 bidirectional activity keeps working (Cx-BG transfer/asynchronous configuration). Both the synchronous and anti-synchronous Put-MT configurations were not found in PD, which can be explained by the degeneration of the cortical (Day et al., 2006; Stephens et al., 2005) and thalamic (Galvan and Smith, 2011; Morales et al., 2013; Smith et al., 2009; Villalba et al., 2014) inputs to the Put. Taken together, these data suggest a marked dysfunction of the cortical-BG exchange of information in PD.
4.3. The effect of PD on BG subcortical circuits
PD patients showed different abnormalities in Put connectivity. The loss of Put-MP in-phase and Put-MP anti-phase behaviors commented above was accompanied by the loss of the Put-GPe anti-phase behavior. The Put and GPe display mutual inhibitory projections (Spooren et al., 1996) which could explain their anti-phase activity. This anti-phase behavior may be generated by a fluctuation of the winning inhibitory region, in such a way that there will always be an active (the winner region) and an inactive region, with both regions being neither active nor inactive at the same time. This fluctuation may disappear in PD because the dopamine decrease induces a persistent activation of the Put→GPe pathway which may prevent the winning inter-change and the Put-GPe anti-phase behavior.
The functional configurations of the Put found in controls were replaced in PD patients by new configurations that, surprisingly, were compatible with the prevalence of the indirect pathway proposed by the classical BG-model. In PD patients, MCA showed one configuration which was compatible with the direct pathway (Put-SN synchronous relationship) and another which was compatible with the indirect pathway (Put-GPe-STN-SN synchronous/asynchronous relationship). These configurations were probably not identified in the control-group because these pathways continuously compete for the control of GPi-SN, and if so their action would affect the same rows of the contingence table and would, therefore, be included in one single functional configuration (probably in the BG-synchronous configuration) and not segregated between the configurations associated with the direct and indirect pathways. The identification of both configurations in PD suggests that they were not working at the same time, with the activity of each configuration being recorded in different rows of the contingence table. In this case, PD motor disorders could be generated by the discontinuous and uncoordinated activity of the direct and indirect pathways more than by the continuous prevalence of the indirect pathway.
Other parkinsonian changes of the BG configurations are more difficult to associate to BG circuits. This is the case of the GPe-GPi, STN-SN and GPI-MT asynchronous configurations. These abnormal configurations may be the final result of several changes of the BG circuits shown in Fig. 1B. For instance, the GPe-GPi anti-phase activity may be the consequence of a modification in the GPe-STN-GPi, GPe-GPi-GPe or GPe-STN-GPi-MT-Put-GPe circuits. The GPe-GPi and GPi-MT asynchronous configurations were found in PD during both resting and motor activity, whereas the Put-STN synchronous configuration was found during the motor task but not during resting conditions. The effect of motion on STN configurations was observed in PD but not in healthy controls, showing that the neuronal basis used by PD patients to perform movements is different to that used by healthy people.
4.4. The functional configurations of the BGmC in PD: some general comments
There are some relevant differences between the classical BG-model and the DCN-model suggested by MCA. The classical-model is based on the local excitatory/inhibitory actions between the successive regions of the BG closed-loop, with the global dynamic of BG being estimated as the sum/subtraction of these local actions. The DCN-model assumes that all BG, either directly or indirectly, interact with all BG. The classical-model is mainly focused on the global cortical-subcortical circuits, whereas the DCN-model includes these circuits as well as the sub-cortical circuits (in fact it cannot distinguish the action of cortical and subcortical circuits). The classical model is based on the neuronal wiring of BG, while the MCA-model shows the main patterns of multiple interactions of BG (functional configurations) and does not provide information about the structural connectivity of BG. Making a comparison with the Internet, MCA shows who spoke to who and who remained silent during the conversation, and also identifies subjects able to follow different conversations at the same time. However, MCA does not identify which “routers” are being used to send the messages. The classical model explains motor disorders in PD as a result of chained mismatches in the linear sequence of excitations/inhibitions of the BG. MCA data shows that PD does not eliminate the global organization of the BG (dimensions 1/2), but it alters the activity of regions exchanging cortical and BG information (dimensions 3/4) and most of the subcortical configurations of BG (dimensions 5/6/7). The DCN-model provides new perspectives about the physiology and physiopathology of BG which could encourage further studies aimed at finding direct relationships between each PD motor disorder and the different functional configurations of BG, and such studies could boost the development of new therapeutic strategies.
Compliance with ethical standards
All procedures performed in studies involving human participants were in accordance with the ethical standards of the institutional and/or national research committee and with the 1964 Helsinki declaration and its later amendments or comparable ethical standards. The study was performed with the approval of the local Institutional Human Studies Committee. This article does not contain any studies with animals performed by any of the authors.
Informed consent
Informed consent was obtained from all individual participants included in the study.
Funding
This study was funded by the Network Center for Biomedical Research in Neurodegenerative Diseases (CIBERNED), Madrid, Spain. (grant number PI2011/02–2).
Conflict of interest
Authors declare no conflict of interest.
The following are the supplementary data related to this article.
Supplementary Fig. 1.

Oscillatory activity of basal ganglia in healthy subjects (A, B and C) and Parkinson’s disease (D, E and F). Three periodic fluctuations have been reported, the 0.5-2.5 Hz (left column; A and D), the 13-30 Hz (middle column; B and E) and the 40-80 Hz (right column; C and F). The amplitude (potency) of the three fluctuations increased in Parkinson’s disease in most of the centers. Red arrows indicate excitatory pathways and blue arrows inhibitory pathways. Thick arrows indicate an increased basal activity, thin arrows a decreased basal activity, and dotted arrows degenerated pathways. M1: primary motor cortex, STN: subthalamic nucleus, Put: post-commissural putamen, GPe: external globus pallidum, GPi: internal globus pallidum, SNc substantia nigra compacta, SNr substantia nigra reticulata, and Tal: motor thalamus.
supplementary Fig. 2.
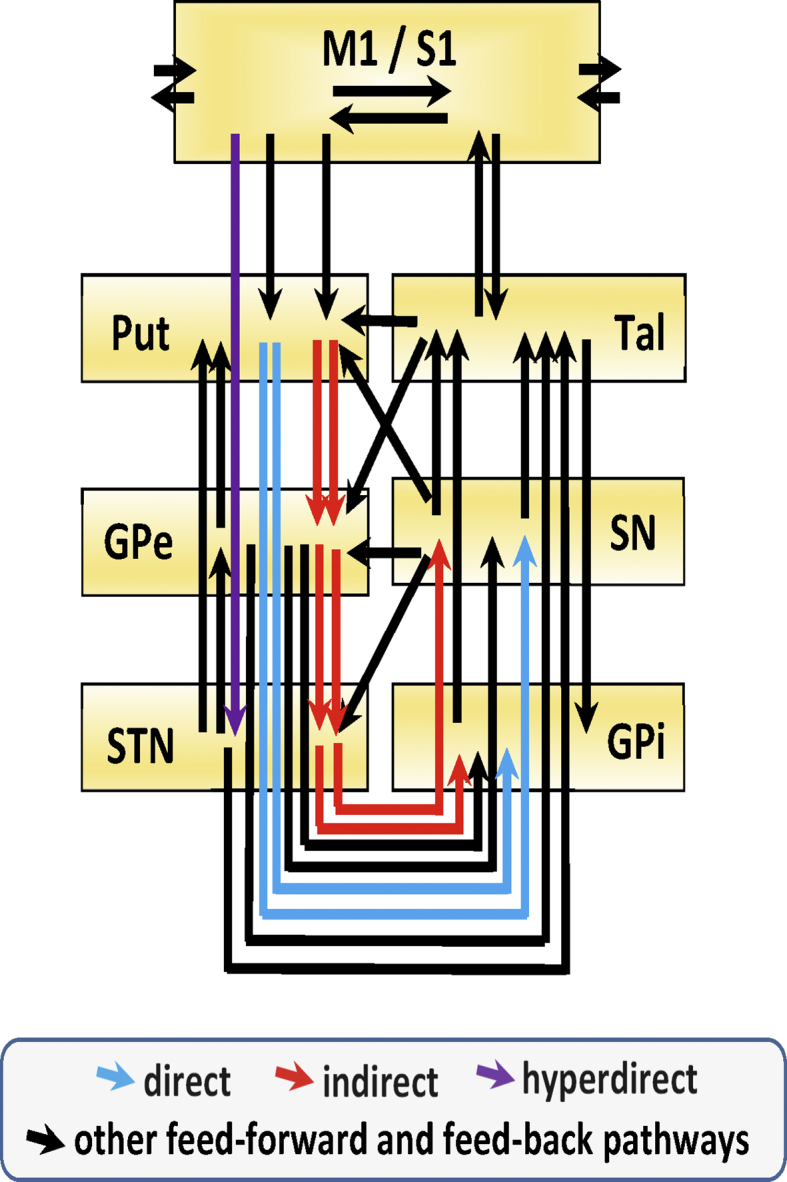
Massive structural connections between basal ganglia (BG) and the primary M1/S1 cortex. Feed-forward and feed-back connections between BG and M1/S1 are shown. Blue arrows indicate the direct pathway, red arrows the indirect pathway, purple arrows the hyperdirect pathway, and back arrows indicate other feed-forward and feed-back pathways. M1: primary motor cortex, STN: subthalamic nucleus, Put: putamen, GPe: external globus pallidum, GPi: internal globus pallidum, SNn: substantia nigra compacta, SN: substantia nigra, Tal: motor thalamus.
References
- Abel J.H., Meeker K., Granados-Fuentes D., St John P.C., Wang T.J., Bales B.B., Doyle F.J., 3rd, Herzog E.D., Petzold L.R. Functional network inference of the suprachiasmatic nucleus. Proc. Natl. Acad. Sci. U. S. A. 2016;113:4512–4517. doi: 10.1073/pnas.1521178113. [DOI] [PMC free article] [PubMed] [Google Scholar]
- Albin R.L., Young A.B., Penney J.B. The functional anatomy of basal ganglia disorders. Trends Neurosci. 1989;12:366–375. doi: 10.1016/0166-2236(89)90074-x. [DOI] [PubMed] [Google Scholar]
- Alexander G.E., DeLong M.R., Strick P.L. Parallel organization of functionally segregated circuits linking basal ganglia and cortex. Annu. Rev. Neurosci. 1986;9:357–381. doi: 10.1146/annurev.ne.09.030186.002041. [DOI] [PubMed] [Google Scholar]
- Alonso-Frech F., Zamarbide I., Alegre M., Rodriguez-Oroz M.C., Guridi J., Manrique M., Valencia M., Artieda J., Obeso J.A. Slow oscillatory activity and levodopa-induced dyskinesias in Parkinson's disease. Brain. 2006;129:1748–1757. doi: 10.1093/brain/awl103. [DOI] [PubMed] [Google Scholar]
- Arthurs O.J., Boniface S. How well do we understand the neural origins of the fMRI BOLD signal? Trends Neurosci. 2002;25:27–31. doi: 10.1016/s0166-2236(00)01995-0. [DOI] [PubMed] [Google Scholar]
- Canavan A.G., Nixon P.D., Passingham R.E. Motor learning in monkeys (Macaca fascicularis) with lesions in motor thalamus. Exp. Brain Res. 1989;77:113–126. doi: 10.1007/BF00250573. [DOI] [PubMed] [Google Scholar]
- Cannon J., McCarthy M.M., Lee S., Lee J., Borgers C., Whittington M.A., Kopell N. Neurosystems: brain rhythms and cognitive processing. Eur. J. Neurosci. 2014;39:705–719. doi: 10.1111/ejn.12453. [DOI] [PMC free article] [PubMed] [Google Scholar]
- Cassidy M., Mazzone P., Oliviero A., Insola A., Tonali P., Di Lazzaro V., Brown P. Movement-related changes in synchronization in the human basal ganglia. Brain. 2002;125:1235–1246. doi: 10.1093/brain/awf135. [DOI] [PubMed] [Google Scholar]
- Cazorla M., de Carvalho F.D., Chohan M.O., Shegda M., Chuhma N., Rayport S., Ahmari S.E., Moore H., Kellendonk C. Dopamine D2 receptors regulate the anatomical and functional balance of basal ganglia circuitry. Neuron. 2014;81:153–164. doi: 10.1016/j.neuron.2013.10.041. [DOI] [PMC free article] [PubMed] [Google Scholar]
- Cordes D., Haughton V., Carew J.D., Arfanakis K., Maravilla K. Hierarchical clustering to measure connectivity in fMRI resting-state data. Magn. Reson. Imaging. 2002;20:305–317. doi: 10.1016/s0730-725x(02)00503-9. [DOI] [PubMed] [Google Scholar]
- Cui G., Jun S.B., Jin X., Pham M.D., Vogel S.S., Lovinger D.M., Costa R.M. Concurrent activation of striatal direct and indirect pathways during action initiation. Nature. 2013;494:238–242. doi: 10.1038/nature11846. [DOI] [PMC free article] [PubMed] [Google Scholar]
- Damoiseaux J.S., Rombouts S.A., Barkhof F., Scheltens P., Stam C.J., Smith S.M., Beckmann C.F. Consistent resting-state networks across healthy subjects. Proc. Natl. Acad. Sci. U. S. A. 2006;103:13848–13853. doi: 10.1073/pnas.0601417103. [DOI] [PMC free article] [PubMed] [Google Scholar]
- Day M., Wang Z., Ding J., An X., Ingham C.A., Shering A.F., Wokosin D., Ilijic E., Sun Z., Sampson A.R., Mugnaini E., Deutch A.Y., Sesack S.R., Arbuthnott G.W., Surmeier D.J. Selective elimination of glutamatergic synapses on striatopallidal neurons in Parkinson disease models. Nat. Neurosci. 2006;9:251–259. doi: 10.1038/nn1632. [DOI] [PubMed] [Google Scholar]
- DeLong M.R. Primate models of movement disorders of basal ganglia origin. Trends Neurosci. 1990;13:281–285. doi: 10.1016/0166-2236(90)90110-v. [DOI] [PubMed] [Google Scholar]
- DeLong M., Wichmann T. Update on models of basal ganglia function and dysfunction. Parkinsonism Relat. Disord. 2009;15(Suppl. 3):S237–S240. doi: 10.1016/S1353-8020(09)70822-3. [DOI] [PMC free article] [PubMed] [Google Scholar]
- Dupre K.B., Cruz A.V., McCoy A.J., Delaville C., Gerber C.M., Eyring K.W., Walters J.R. Effects of L-dopa priming on cortical high beta and high gamma oscillatory activity in a rodent model of Parkinson's disease. Neurobiol. Dis. 2016;86:1–15. doi: 10.1016/j.nbd.2015.11.009. [DOI] [PMC free article] [PubMed] [Google Scholar]
- Fox M.D., Raichle M.E. Spontaneous fluctuations in brain activity observed with functional magnetic resonance imaging. Nat. Rev. Neurosci. 2007;8:700–711. doi: 10.1038/nrn2201. [DOI] [PubMed] [Google Scholar]
- Galvan A., Smith Y. The primate thalamostriatal systems: Anatomical organization, functional roles and possible involvement in Parkinson's disease. Basal Ganglia. 2011;1:179–189. doi: 10.1016/j.baga.2011.09.001. [DOI] [PMC free article] [PubMed] [Google Scholar]
- Goebel R., Esposito F., Formisano E. Analysis of functional image analysis contest (FIAC) data with brainvoyager QX: from single-subject to cortically aligned group general linear model analysis and self-organizing group independent component analysis. Hum. Brain Mapp. 2006;27:392–401. doi: 10.1002/hbm.20249. [DOI] [PMC free article] [PubMed] [Google Scholar]
- Jo H.J., Gotts S.J., Reynolds R.C., Bandettini P.A., Martin A., Cox R.W., Saad Z.S. Effective preprocessing procedures virtually eliminate distance-dependent motion artifacts in resting state FMRI. J. Appl. Math. 2013;2013 doi: 10.1155/2013/935154. [DOI] [PMC free article] [PubMed] [Google Scholar]
- Khanna P., Carmena J.M. Neural oscillations: beta band activity across motor networks. Curr. Opin. Neurobiol. 2015;32:60–67. doi: 10.1016/j.conb.2014.11.010. [DOI] [PubMed] [Google Scholar]
- Khanna P., Carmena J.M. Beta band oscillations in motor cortex reflect neural population signals that delay movement onset. elife. 2017;6 doi: 10.7554/eLife.24573. [DOI] [PMC free article] [PubMed] [Google Scholar]
- Kravitz A.V., Freeze B.S., Parker P.R., Kay K., Thwin M.T., Deisseroth K., Kreitzer A.C. Regulation of parkinsonian motor behaviours by optogenetic control of basal ganglia circuitry. Nature. 2010;466:622–626. doi: 10.1038/nature09159. [DOI] [PMC free article] [PubMed] [Google Scholar]
- Lee K., Tak S., Ye J.C. A data-driven sparse GLM for fMRI analysis using sparse dictionary learning with MDL criterion. IEEE Trans. Med. Imaging. 2011;30:1076–1089. doi: 10.1109/TMI.2010.2097275. [DOI] [PubMed] [Google Scholar]
- Leventhal D.K., Gage G.J., Schmidt R., Pettibone J.R., Case A.C., Berke J.D. Basal ganglia beta oscillations accompany cue utilization. Neuron. 2012;73:523–536. doi: 10.1016/j.neuron.2011.11.032. [DOI] [PMC free article] [PubMed] [Google Scholar]
- Li K., Guo L., Nie J., Li G., Liu T. Review of methods for functional brain connectivity detection using fMRI. Comput. Med. Imaging Graph. 2009;33:131–139. doi: 10.1016/j.compmedimag.2008.10.011. [DOI] [PMC free article] [PubMed] [Google Scholar]
- Llanos C., Rodriguez M., Rodriguez-Sabate C., Morales I., Sabate M. Mu-rhythm changes during the planning of motor and motor imagery actions. Neuropsychologia. 2013;51:1019–1026. doi: 10.1016/j.neuropsychologia.2013.02.008. [DOI] [PubMed] [Google Scholar]
- Logothetis N.K. The neural basis of the blood-oxygen-level-dependent functional magnetic resonance imaging signal. Philos. Trans. R. Soc. Lond. Ser. B Biol. Sci. 2002;357:1003–1037. doi: 10.1098/rstb.2002.1114. [DOI] [PMC free article] [PubMed] [Google Scholar]
- Logothetis N.K., Wandell B.A. Interpreting the BOLD signal. Annu. Rev. Physiol. 2004;66:735–769. doi: 10.1146/annurev.physiol.66.082602.092845. [DOI] [PubMed] [Google Scholar]
- Mallet N., Pogosyan A., Sharott A., Csicsvari J., Bolam J.P., Brown P., Magill P.J. Disrupted dopamine transmission and the emergence of exaggerated beta oscillations in subthalamic nucleus and cerebral cortex. J. Neurosci. 2008;28:4795–4806. doi: 10.1523/JNEUROSCI.0123-08.2008. [DOI] [PMC free article] [PubMed] [Google Scholar]
- Marceglia S., Foffani G., Bianchi A.M., Baselli G., Tamma F., Egidi M., Priori A. Dopamine-dependent non-linear correlation between subthalamic rhythms in Parkinson's disease. J. Physiol. 2006;571:579–591. doi: 10.1113/jphysiol.2005.100271. [DOI] [PMC free article] [PubMed] [Google Scholar]
- McHaffie J.G., Stanford T.R., Stein B.E., Coizet V., Redgrave P. Subcortical loops through the basal ganglia. Trends Neurosci. 2005;28:401–407. doi: 10.1016/j.tins.2005.06.006. [DOI] [PubMed] [Google Scholar]
- McKeown M.J., Sejnowski T.J. Independent component analysis of fMRI data: examining the assumptions. Hum. Brain Mapp. 1998;6:368–372. doi: 10.1002/(SICI)1097-0193(1998)6:5/6<368::AID-HBM7>3.0.CO;2-E. [DOI] [PMC free article] [PubMed] [Google Scholar]
- Meindl T., Teipel S., Elmouden R., Mueller S., Koch W., Dietrich O., Coates U., Reiser M., Glaser C. Test-retest reproducibility of the default-mode network in healthy individuals. Hum. Brain Mapp. 2010;31:237–246. doi: 10.1002/hbm.20860. [DOI] [PMC free article] [PubMed] [Google Scholar]
- Mirzaei A., Kumar A., Leventhal D., Mallet N., Aertsen A., Berke J., Schmidt R. Sensorimotor processing in the basal ganglia leads to transient beta oscillations during behavior. J. Neurosci. 2017;37:11220–11232. doi: 10.1523/JNEUROSCI.1289-17.2017. [DOI] [PMC free article] [PubMed] [Google Scholar]
- Morales I., Yanos C., Rodriguez-Sabate C., Sanchez A., Rodriguez M. Striatal glutamate degenerates thalamic neurons. J. Neuropathol. Exp. Neurol. 2013;72:286–297. doi: 10.1097/NEN.0b013e31828a80ee. [DOI] [PubMed] [Google Scholar]
- Moran R.J., Mallet N., Litvak V., Dolan R.J., Magill P.J., Friston K.J., Brown P. Alterations in brain connectivity underlying beta oscillations in Parkinsonism. PLoS Comput. Biol. 2011;7 doi: 10.1371/journal.pcbi.1002124. [DOI] [PMC free article] [PubMed] [Google Scholar]
- Nelson A.B., Kreitzer A.C. Reassessing models of basal ganglia function and dysfunction. Annu. Rev. Neurosci. 2014;37:117–135. doi: 10.1146/annurev-neuro-071013-013916. [DOI] [PMC free article] [PubMed] [Google Scholar]
- Obeso J.A., Rodriguez M.C., DeLong M.R. Basal ganglia pathophysiology. A critical review. Adv. Neurol. 1997;74:3–18. [PubMed] [Google Scholar]
- Power J.D., Mitra A., Laumann T.O., Snyder A.Z., Schlaggar B.L., Petersen S.E. Methods to detect, characterize, and remove motion artifact in resting state fMRI. NeuroImage. 2014;84:320–341. doi: 10.1016/j.neuroimage.2013.08.048. [DOI] [PMC free article] [PubMed] [Google Scholar]
- Raichle M.E. Behind the scenes of functional brain imaging: a historical and physiological perspective. Proc. Natl. Acad. Sci. U. S. A. 1998;95:765–772. doi: 10.1073/pnas.95.3.765. [DOI] [PMC free article] [PubMed] [Google Scholar]
- Raichle M.E., Mintun M.A. Brain work and brain imaging. Annu. Rev. Neurosci. 2006;29:449–476. doi: 10.1146/annurev.neuro.29.051605.112819. [DOI] [PubMed] [Google Scholar]
- Rodriguez M., Gonzalez J., Sabate M., Obeso J., Pereda E. Firing regulation in dopaminergic cells: effect of the partial degeneration of nigrostriatal system in surviving neurons. Eur. J. Neurosci. 2003;18:53–60. doi: 10.1046/j.1460-9568.2003.02723.x. [DOI] [PubMed] [Google Scholar]
- Rodriguez M., Pereda E., Gonzalez J., Abdala P., Obeso J.A. How is firing activity of substantia nigra cells regulated? Relevance of pattern-code in the basal ganglia. Synapse. 2003;49:216–225. doi: 10.1002/syn.10233. [DOI] [PubMed] [Google Scholar]
- Rodriguez M., Pereda E., Gonzalez J., Abdala P., Obeso J.A. Neuronal activity in the substantia nigra in the anaesthetized rat has fractal characteristics. Evidence for firing-code patterns in the basal ganglia. Exp. Brain Res. 2003;151:167–172. doi: 10.1007/s00221-003-1442-4. [DOI] [PubMed] [Google Scholar]
- Rodriguez-Sabate C., Llanos C., Morales I., Garcia-Alvarez R., Sabate M., Rodriguez M. The functional connectivity of intralaminar thalamic nuclei in the human basal ganglia. Hum. Brain Mapp. 2015;36:1335–1347. doi: 10.1002/hbm.22705. [DOI] [PMC free article] [PubMed] [Google Scholar]
- Rodriguez-Sabate C., Sabate M., Llanos C., Morales I., Sanchez A., Rodriguez M. The functional connectivity in the motor loop of human basal ganglia. Brain Imaging Behav. 2017;11:417–429. doi: 10.1007/s11682-016-9512-y. [DOI] [PubMed] [Google Scholar]
- Rodriguez-Sabate C., Morales I., Sanchez A., Rodriguez M. The multiple correspondence analysis method and brain functional connectivity: its application to the study of the non-linear relationships of motor cortex and basal ganglia. Front. Neurosci. 2017;11:345. doi: 10.3389/fnins.2017.00345. [DOI] [PMC free article] [PubMed] [Google Scholar]
- Schroll H., Hamker F.H. Computational models of basal-ganglia pathway functions: focus on functional neuroanatomy. Front. Syst. Neurosci. 2013;7:122. doi: 10.3389/fnsys.2013.00122. [DOI] [PMC free article] [PubMed] [Google Scholar]
- Smith Y., Raju D.V., Pare J.F., Sidibe M. The thalamostriatal system: a highly specific network of the basal ganglia circuitry. Trends Neurosci. 2004;27:520–527. doi: 10.1016/j.tins.2004.07.004. [DOI] [PubMed] [Google Scholar]
- Smith Y., Raju D., Nanda B., Pare J.F., Galvan A., Wichmann T. The thalamostriatal systems: anatomical and functional organization in normal and parkinsonian states. Brain Res. Bull. 2009;78:60–68. doi: 10.1016/j.brainresbull.2008.08.015. [DOI] [PMC free article] [PubMed] [Google Scholar]
- Soares J., Kliem M.A., Betarbet R., Greenamyre J.T., Yamamoto B., Wichmann T. Role of external pallidal segment in primate parkinsonism: comparison of the effects of 1-methyl-4-phenyl-1,2,3,6-tetrahydropyridine-induced parkinsonism and lesions of the external pallidal segment. J. Neurosci. 2004;24:6417–6426. doi: 10.1523/JNEUROSCI.0836-04.2004. [DOI] [PMC free article] [PubMed] [Google Scholar]
- Sorrentino F., Pecora L.M., Hagerstrom A.M., Murphy T.E., Roy R. Complete characterization of the stability of cluster synchronization in complex dynamical networks. Sci. Adv. 2016;2:e1501737. doi: 10.1126/sciadv.1501737. [DOI] [PMC free article] [PubMed] [Google Scholar]
- Spooren W.P., Lynd-Balta E., Mitchell S., Haber S.N. Ventral pallidostriatal pathway in the monkey: evidence for modulation of basal ganglia circuits. J. Comp. Neurol. 1996;370:295–312. doi: 10.1002/(SICI)1096-9861(19960701)370:3<295::AID-CNE2>3.0.CO;2-#. [DOI] [PubMed] [Google Scholar]
- Stephens B., Mueller A.J., Shering A.F., Hood S.H., Taggart P., Arbuthnott G.W., Bell J.E., Kilford L., Kingsbury A.E., Daniel S.E., Ingham C.A. Evidence of a breakdown of corticostriatal connections in Parkinson's disease. Neuroscience. 2005;132:741–754. doi: 10.1016/j.neuroscience.2005.01.007. [DOI] [PubMed] [Google Scholar]
- Su X., Wijayasinghe C.S., Fan J., Zhang Y. Sparse estimation of Cox proportional hazards models via approximated information criteria. Biometrics. 2016;72:751–759. doi: 10.1111/biom.12484. [DOI] [PMC free article] [PubMed] [Google Scholar]
- Villalba R.M., Wichmann T., Smith Y. Neuronal loss in the caudal intralaminar thalamic nuclei in a primate model of Parkinson's disease. Brain Struct. Funct. 2014;219:381–394. doi: 10.1007/s00429-013-0507-9. [DOI] [PMC free article] [PubMed] [Google Scholar]
- Wang S., Herzog E.D., Kiss I.Z., Schwartz W.J., Bloch G., Sebek M., Granados-Fuentes D., Wang L., Li J.S. Inferring dynamic topology for decoding spatiotemporal structures in complex heterogeneous networks. Proc. Natl. Acad. Sci. U. S. A. 2018;115:9300–9305. doi: 10.1073/pnas.1721286115. [DOI] [PMC free article] [PubMed] [Google Scholar]
- Windischberger C., Barth M., Lamm C., Schroeder L., Bauer H., Gur R.C., Moser E. Fuzzy cluster analysis of high-field functional MRI data. Artif. Intell. Med. 2003;29:203–223. doi: 10.1016/s0933-3657(02)00072-6. [DOI] [PubMed] [Google Scholar]
- Yin H.H. Action, time and the basal ganglia. Philos. Trans. R. Soc. Lond. Ser. B Biol. Sci. 2014;369 doi: 10.1098/rstb.2012.0473. [DOI] [PMC free article] [PubMed] [Google Scholar]
- Yin H.H. The Basal Ganglia in Action. Neuroscientist. 2017;23:299–313. doi: 10.1177/1073858416654115. [DOI] [PMC free article] [PubMed] [Google Scholar]