

Abstract
The prolamin-box binding factor1 (pbf1) gene encodes a transcription factor that controls the expression of seed storage protein (zein) genes in maize. Prior studies show that pbf1 underwent selection during maize domestication although how it affected trait change during domestication is unknown. To assay how pbf1 affects phenotypic differences between maize and teosinte, we compared nearly isogenic lines (NILs) that differ for a maize versus teosinte allele of pbf1. Kernel weight for the teosinte NIL (162mg) is slightly but significantly greater than that for the maize NIL (156mg). RNAseq data for developing kernels show that the teosinte allele of pbf1 is expressed at about twice the level of the maize allele. However, RNA and protein assays showed no difference in zein profile between the two NILs. The lower expression for the maize pbf1 allele suggests that selection may have favored this change; however, how reduced pbf1 expression alters phenotype remains unknown. One possibility is that pbf1 regulates genes other than zeins and thereby is a domestication trait. The observed drop in seed weight associated with the maize allele of pbf1 is counterintuitive but could represent a negative pleiotropic effect of selection on some other aspect of kernel composition.
Keywords: kernel, RNAseq, selection, teosinte
Since maize’s initial domestication from the wild grass, teosinte (Zea mays ssp. parviglumis; Doebley 1990; Piperno and Flannery 2001; Matsuoka et al. 2002), the maize kernel has experienced substantial change in size and composition. Maize kernels are over 9-fold greater than teosinte kernels in weight (Flint-Garcia et al. 2009). The increase in kernel weight during domestication is not only gigantism of the kernel but also reflection of a change in kernel composition. Maize kernels are 72% starch and 11% protein, wheread teosinte kernels are 53% starch and 28% protein (Flint-Garcia et al. 2009). Protein content in maize and teosinte kernels consists primarily of the zein family of seed storage proteins. Teosinte differs in both the number and amount of zein proteins observed compared with inbred maize and maize landraces (Flint-Garcia et al. 2009). In teosinte, 89% of the zeins are alpha zeins, whereas this portion is only 72% for inbred maize.
Zein synthesis in maize kernels is regulated in part by the prolamin-box binding factor1 (pbf1) gene. pbf1 encodes an endosperm-specific transcription factor that belongs to the Dof class of zinc finger DNA-binding proteins. The target DNA-binding site for pbf1 is a 7-base pair (5′-TGTAAAG-3′) promoter sequence called the prolamin-box (P-box) that is located approximately 300 base pairs from the start codon of some zein genes (Vicente-Carbajosa et al. 1997; Wang and Messing 1998; Xu and Messing 2009; Wu and Messing 2012a). pbf1 has been shown to regulate expression of two classes of zein genes in maize, the 27kDa γ-zine and the 22kDa α-zein (Wu and Messing 2012a). Because no loss-of-function mutant of pbf1 has been identified, it is hypothesized that its role as a regulator of seed development is so fundamental that such mutants are embryonic lethals.
There is strong evidence that pbf1 was under positive selection during maize domestication. Jaenicke-Despres et al. (2003) compared nucleotide diversity at pbf1 in both modern maize and teosinte, as well as in a sample of ancient maize cobs (up to 4300 years old) recovered from archeological sites from Mexico and New Mexico. They found a single major pbf1 haplotype shared by all ancient and modern maize samples, indicating that a selective sweep occurred early during maize domestication. This evidence for a sweep at pbf1 was confirmed by the maize Haplotype Map, which showed that nucleotide diversity (π) for the chromosomal bin containing pbf1 was in the lower 3.5% percentile of the entire genome (Gore et al. 2009). More recently, comparative genomic analysis of wild, landrace, and modern maize has also shown that pbf1 underwent selection during maize domestication (Hufford et al. 2012).
Once a selected gene is identified, it is of interest to determine the phenotype that it controls. At present, no phenotypic change in maize compared with teosinte has been shown to be caused by pbf1. Identifying the kernel phenotype that the maize versus teosinte alleles of pbf1 determines would add to our understanding of maize domestication. In this study, we attempted to identify traits controlled by a maize versus teosinte allele of pbf1. We observed that messenger RNA (mRNA) accumulation for a teosinte allele of pbf1 is 2-fold higher than that for a maize allele. We also detected a small effect on kernel weight associated with pbf1; however unexpectedly, the teosinte allele confers heavier kernels. Surprisingly, we saw no difference in the zein protein levels associated with the maize and teosinte alleles.
Materials and methods
To identify traits controlled by the maize versus teosinte alleles of pbf1, we employed a maize–teosinte BC2S3 family (MR0326) that segregates for a 6.33 Mbp teosinte segment (Chr 2: 151570555–157901437 AGP v2) that encompasses pbf1 plus 95 other genes (Shannon 2013). MR0326 was created by crossing maize inbred W22 and a teosinte individual (Zea mays ssp. parviglumis, CIMMYT accession 8759) from the Balsas region of southwestern Mexico. The F1 was back-crossed to W22, the BC1 was back-crossed to W22, and then a BC2 individual was advanced by three generations of selfing. The resulting BC2S3 family has a genome that is approximately 84.3% W22, 11.5% teosinte, and 4.3% heterozygous. pbf1 lies in one of the heterozygous portions of the genome. MR0326 is one of a set of 866 lines in a quantitative trait locus mapping population (Shannon 2013).
We grew 580 plants of MR0326 during the summer of 2009 at the West Madison Agricultural Research Station. The plants were genotyped for two markers in the two neighbor genes flanking pbf1, enabling us to assign a genotype to each plant for pbf1. One marker was an indel (3bp insertion in maize) at AGPv2_Chr2: 153506346 in GRMZM2G146378; the other was a single nucleotide polymorphism (SNP) at AGPv2_Chr2: 153524347 (C in maize; G in teosinte) in GRMZM2G146267. At pbf1, the 580 plants included 122 homozygous maize, 168 homozygous teosinte, and 290 heterozygous individuals. The average recombination rate in maize is roughly 1% for approximately 1.2 Mbp; hence, one could have hoped to recover recombinant chromosomes between these two markers flanking pbf1 so that we could fine-map traits in this genomic region. However, among 580 plants, we observed no recombination events between these two markers.
We measured three kernel-size phenotypes: weight, volume, and test weight, using a sample of 100 plants each of the maize and teosinte pbf1 genotypes. The ears were dried prior to phenotyping. Weight (mg) was measured as the mean of 50 kernels per plant. Kernel volume (µL) was measured by submerging the 50 kernels in a graduated cylinder filled with 10mL of water and recording the increase in volume/50. Test weight was calculated as 50 kernel weight divided by 50 kernel volume (mg/µL). We also determined percentage starch, oil, and protein in the kernels using a sample of 60 plants each for the maize and teosinte pbf1 genotypic classes. These assays were performed at Ward Laboratories (Kearney, NE) using standard wet-chemistry assays (Ankom Technology 2004; Hall 2001; Padmore 1990).
Gene expression assays for pbf1 and other genes was accomplished using RNAseq. For these assays, we selected nearly isogenic lines (NILs) from MR0326 that were homozygous for the maize (M) allele and for the teosinte (T) allele of pbf1. These plants were grown during the summer of 2012 at the West Madison Agricultural Research Station. These plants were both self-pollinated and reciprocally crossed so that ears with kernels of all four possible endosperm triploid genotypic classes were produced: T female pollinated with T male (TTT), M female pollinated with M male (MMM), T female pollinated with M male (TTM), and M female pollinated with T male (MMT). (Underscoring marks the alleles from the ear parent.) Kernels were collected from six individuals per genotype at 16 days after pollination (DAP), flash frozen in liquid nitrogen, and then stored at −80 °C.
RNA from kernels of the six plants for each of the four genotypes (24 total plants) was used to construct 24 individually barcoded libraries. Total RNA was extracted using sodium dodecyl sulfate (SDS)–TRIZOL protocol according to Leiva-Neto et al. (2004). RNA concentration determined with a NanoDrop Spectrophotmeter ND-1000 (NanoDrop Technologies, Wilmington, DE). Each total RNA extraction was treated with DNase I, and 5 μg of each sample was then used for RNAseq library construction. Strand-specific RNAseq libraries were generated according to Zhong et al. (2011), with the final libraries amplified with 12 polymerase chain reaction cycles. Double-stranded DNA (dsDNA) was quantified using Qubit dsDNA HS Assay Kits (Invitrogen) in Qubit Fluorometer. Single-end RNAseq was performed on the Illumina HiSeq2000 by the University of Wisconsin Biotechnology Center, and reads were trimmed to a length of 89 base pairs. The raw sequence data had been deposited in National Center for Biotechnology Information Short Read Archive (SRA) with accession SRA106370. For the four genotypic classes, we recovered the following numbers of good reads: MMM (55,552,680), TTT (40,998,912), MMT (55,146,683), and TTM (46,566,333).
To assess allele-specific differential expression of the 96 genes in the 6.33 Mbp introgressed segment surrounding pbf1, we developed the following pipeline based on that described by Wang et al. (2011). The pipeline involves aligning the RNAseq reads of the M × T and T × M reciprocal hybrids to reference pseudotranscriptomes of the M and T parents and counting reads that uniquely map to one or the other pseudotranscriptome at polymorphic sites segregating between maize (M) and teosinte (T). The unknown transcriptomes of M and T parents were approximated by pseudotranscriptomes obtained by inserting SNPs and short indels with respect to B73 into the B73 transcriptome. These polymorphisms were called from separate alignments of the RNAseq reads from homozygous M and T NILs (each of the two sets was combined over all replicates) to the B73 reference genome (AGP v2) obtained with TopHat (Kim et al. 2013) using the ZmB73_5a_WGS gene model and default alignment parameters. Only uniquely mapped reads were used, and only homozygous variants supported by at least 10 reads were considered. Using these two parent-specific pseudotranscriptomes instead of a single reference transcriptome (e.g., that of B73) for read counting minimizes alignment bias which could be misinterpreted as allele-specific differential expression. The RNAseq reads from the reciprocal crosses of the homozygous M and T NILs were aligned using Bowtie (Langmead et al. 2009) to the combined pseudotranscriptomes. Each read was allowed to align to multiple locations, but only perfectly aligning ones were kept, which made it straightforward to identify M and T reads at segregating sites. The set of high-confidence segregating sites between the two pseudotranscriptomes was determined by requiring that the M and T alleles are different and well supported by the initial TopHat alignments, namely, for both M and T: 1) read depth at the site is at least 10, 2) read depth within one read length of the site is at least 4, and 3) there are no heterozygous polymorphisms detected within a read length of the site. Allele-specific expression was then assessed by testing the M and T read depth at segregating sites for difference from equal expression using binomial tests with a Bonferroni correction cut off at 0.05.
The pipeline just described for the M × T and T × M reciprocal F1 crosses was also used with reads from homozygous M and T NILs. Comparing the parental read depths at segregating sites, the M depths were scaled by 40998912/55552680 to account for different overall numbers of M and T reads collected by RNAseq.
Putatively, for each of the 96 genes within the 6.33 Mbp introgression, the maize and teosinte alleles might have different trans effects on the expression of other genes in the genome. To identify any gene that is transregulated by one of the 96 genes, we performed a genome-wide analysis for differential expression between the homozygous M and T NILs for the 6.33 Mbp introgression. We assayed the entire filtered maize gene set (version 5b) using the expression analysis pipeline as implemented in the Trinity assembler package (trinityrnaseq.sourceforge.net; Grabherr et al. 2011). This pipeline uses the RNA-seq by Expectation Maximization (RSEM) program (Li and Dewey 2011) to obtain expected gene read counts from alignment to the reference transcriptome. We used the B73 transcriptome for all alignments. The read counts were processed using the edgeR package for the R statistical software (Robinson and Smyth 2008; Robinson et al. 2010) to look for differential expression of genes. Default settings were used for edgeR analysis. The zein genes are known targets of pbf1 and therefore of particular interest. We performed an additional analysis of differential expression for the zein genes. Zein gene expression levels as represented by Fragments Per Kilobase per Million reads (FPKM), generated by RSEM, were tested for a difference between the M and T NILs with t-tests using Bonferroni correction cut off at 0.05.
Zein proteins were extracted from eight kernels from eight different plants for both the maize and teosinte homozygous NILs, as described by Wu and Messing (2012b). One mature kernel for each sample was ground into fine powder. One-hundred milligram of flour was transferred to a 2.0mL Eppendorf tube for zein protein extraction, vortexed with 400 μL of 70% ethanol/2% 2-mercaptoethanol (v/v), and then kept on the bench at room temperature overnight. The sample was centrifuged for 10min at 17950 rcf and 200 μL of supernatant was transferred to a clean tube. Finally, the supernatant was dried by vacuum and resuspended in 200 μL of sterile distilled water. Four microliter of each sample was analyzed with 15% SDS–polyacrylimide gel electrophoresis (PAGE) gel, run at 200V for 40min. The resulting gel was stained with Coomassie buffer. In fulfillment of the data arching guidelines (Baker 2013), we have deposited the primary data underlying our analyses with Dryad.
Results and Discussion
Seed Size and Composition
Prior studies have shown pbf1 underwent selection during maize domestication (Jaenicke-Després et al. 2003; Gore et al. 2009; Hufford et al. 2012). However, no phenotypic difference between maize and teosinte has been mapped to this gene. We measured kernel weight and kernel volume from selfed NILs that were homozygous for the maize or teosinte introgression containing pbf1 (Table 1). Kernel weight for the teosinte NILs was significantly greater at 162.34±1.44mg versus 156.20±1.21g for maize (P = 0.001). To understand if the change in weight was due to an increase in the size of the kernels or an increase in density, we measured kernel volume and test weight for each genotype. Although test weight was not significantly different (maize = 1.244±0.050mg/µL and teosinte =1.242±0.055mg/µL), kernel volume of the teosinte genotype was 130.6±1.11 µL, which was significantly greater than that of maize (125.6±1.01 µL; P = 0.001). Thus, the teosinte introgression causes increased kernel weight and size in a predominately maize background. It is expected that our teosinte parent, which has much smaller kernels than our maize parent, would carry the small-kernelled allele at pbf1. Therefore, this result was unexpected.
Table 1.
Phenotypic means for kernel traits for both the homozygous maize and teosinte NILs
| Phenotype | Genotype | Mean ± SEM | Sample size | P value |
|---|---|---|---|---|
| Kernel weight (mg) | Maize | 156.20±1.21 | 100 | 0.001 |
| Teosinte | 162.34±1.44 | 100 | ||
| Kernel volume (µL) | Maize | 125.6±1.01 | 100 | 0.001 |
| Teosinte | 130.6±1.11 | 100 | ||
| Test weight (mg/µL) | Maize | 1.244±0.050 | 100 | 0.690 |
| Teosinte | 1.242±0.055 | 100 | ||
| % Starch | Maize | 60.26±0.26 | 60 | 0.456 |
| Teosinte | 60.53±0.26 | 60 | ||
| % Protein | Maize | 13.62±0.11 | 60 | 0.535 |
| Teosinte | 13.72±0.11 | 60 | ||
| % Oil | Maize | 4.54±0.05 | 60 | 0.269 |
| Teosinte | 4.62±0.05 | 60 |
To assay the nature of the difference in kernel weight, the percentage of starch, oil, and protein in kernels of the maize and teosinte NILs was measured (Table 1). We observed no differences between the genotypes for these measurements, suggesting the difference in kernel weight between the maize and teosinte NILs is not due to a singular change in the amount starch, protein, or oil. With a larger sample, a significant difference might be shown; however, the high cost of these assays prevented us from analyzing more samples.
Allele-Specific Expression
To assay allele-specific expression for the 96 filtered genes in the introgression region around pbf1, RNAseq libraries from 16 DAP kernels were constructed and sequenced for reciprocal F1 hybrids between the maize and teosinte NILs. Using conservative criteria, we identified 16 high-quality SNPs in nine genes (14 transcripts) for use, to assign RNAseq reads to either the maize or teosinte alleles. In these F1s, the maize and teosinte alleles for each gene are expressed in the same cells, at the same developmental time point, and with the same set of trans-acting factors, thus any difference in read count should reflect cis regulatory differences between the alleles. As the result of double fertilization, each kernel contains a triploid endosperm (two maternal and one paternal genome). To balance the extra contribution made by the maternal genome, the RNAseq reads from six M × T and six T × M reciprocal crosses were combined by weighted summing for analysis. Of the nine genes in the pbf1 region that were assayed, only pbf1 shows a strong and highly significant allele-specific expression difference (Table 2). The teosinte allele of pbf1 is expressed at approximately twice the level of the maize allele. A second gene (GRMZM2G117300) also shows an allele-specific expression difference; however, this result is based on only 24 RNAseq reads.
Table 2.
Expression analysis for genes within the pbf1 introgression
| Transcript | NIL comparisons (M:T) | P value | Combined F1s (M:T) | P value |
|---|---|---|---|---|
| pbf1 | 254:586 | 5.44×10 −31* | 279:467 | 5.88×10 −12* |
| GRMZM2G021299_T01 | 13:13 | 1 | 10:8 | 0.815 |
| GRMZM2G070054_T01 | 20:29 | 0.253 | 24:22 | 0.883 |
| GRMZM2G102242_T01 | 7:23 | 0.00522 | 25:18 | 0.360 |
| GRMZM2G117300_T01 | 16:23 | 0.337 | 4:20 | 0.002* |
| GRMZM2G155437_T01 | 26:30 | 0.689 | 37:39 | 0.909 |
| GRMZM2G180691_T01 | 30:30 | 1 | 30:22 | 0.332 |
| GRMZM2G180691_T02 | 6:4 | 0.754 | 5:2 | 0.453 |
| GRMZM2G180704_T01 | 137:203 | 4.08×10 −4* | 128:140 | 0.502 |
| GRMZM2G416684_T01 | 17:20 | 0.743 | 19:13 | 0.377 |
Read counts for the maize (M) allele are followed by the count for the teosinte (T) allele. The values in bold are significant after Bonferroni correction at P < 0.05. Read counts for the NIL comparisons are summed over all samples in each genotypic class with the maize counts weighted by the fraction 40998912/55552680 to adjust for the larger number total reads from the maize NILs. Read counts for the F1s are summed over the MMT and TTM genotypic classes with weighting to provide an equal contributions based on the copy number of the allelic classes.
*P values < 0.005 (0.05/10) reject the null hypothesis of equal expression where 10 is the number of tests performed.
We also tested for differential expression at the nine genes with high-quality SNPs in the 6.33 Mbp introgression region around pbf1 by comparing their expression between the homozygous maize and teosinte NILs for this region. RNAseq reads from the six individuals for each homozygous NILs were assayed. Differential expression of maize and teosinte alleles was tested for significance using binomial tests with the null hypothesis of equal read depth (expression). Of the nine genes tested, pbf1 had the most statistically significant difference in expression between the maize and teosinte allele, showing 2-fold greater expression of the teosinte allele (Table 2). A second gene (GRMZM2G180704) showed 1.5-fold greater expression of the teosinte allele; however, this gene showed equal expression in the F1 allele-specific assay, suggesting that this difference is due to a trans factor located elsewhere in the genome.
In sum, among the nine genes in the 6.33 Mbp introgression region around pbf1 that were assayed, only pbf1 itself shows strong and consistent evidence for differential expression of the maize and teosinte alleles.
pbf1 Target Genes
The observed difference in pbf1 expression between maize and teosinte suggests that downstream targets of pbf1 could also show differential expression. Consequently, we looked for differential expression of genes outside the pbf1 introgression between our maize and teosinte pbf1 NILs. This genome-wide analysis for differential expression did not produce any significant hits using the filtered gene set (Supplementary Data), suggesting the maize versus teosinte allele of pbf1 does not have a measurable effect on the transcriptome in 16 DAP kernels.
Since the zein genes are known targets of pbf1, we made an additional effort to look for subtle differences in mRNA abundance of 37 maize zein genes between the homozygous maize and teosinte NILs. This was done using t-tests with Bonferroni correction of 0.05 on zein gene FPKM. This analysis of the known targets of pbf1 again showed no evidence for differential expression (Table 3), suggesting there is no measurable differential effect of the maize versus teosinte alleles of pbf1 on zein gene mRNA levels.
Table 3.
Expression analysis of zein genes
| Gene | Annotation | Maize FPKM average | Teosinte FPKM average | P value* |
|---|---|---|---|---|
| GRMZM2G487900 | Z1A α-zein protein | 5240.91±200.24 | 5240.91±404.20 | 1.0000 |
| GRMZM2G461650 | Z1C α-zein protein | 15770.52±1274.12 | 15764.91±1120.21 | 0.9974 |
| GRMZM2G059620 | 19kDa α-zein B1 | 6032.66±871.51 | 6104.82±777.74 | 0.9520 |
| GRMZM2G018193 | Zein protein | 143.30±14.83 | 141.87±18.87 | 0.9539 |
| GRMZM2G487882 | 19kDa α-zein protein | 28452.53±2708.27 | 28824.85±2257.73 | 0.9180 |
| GRMZM2G518465 | Z1A α-zein protein | 35606.88±3099.43 | 36078.50±2712.59 | 0.9110 |
| GRMZM2G353272 | 19kDa α-zein PMS1 precursor | 40.76±9.09 | 43.71±20.71 | 0.9000 |
| GRMZM2G044152 | 22kDa α-zein ZA1/M1 precursor | 667.46±70.42 | 655.11±28.48 | 0.8760 |
| GRMZM2G044625 | Zein protein | 25011.06±1793.51 | 24610.55±1558.31 | 0.8695 |
| GRMZM2G088365 | 22kDa α-zein 5 | 264.50±79.83 | 284.97±48.06 | 0.8315 |
| AF546188.1_FG003 | Zein protein | 252.97±35.32 | 240.75±38.87 | 0.8206 |
| GRMZM2G008913 | 19kDa α-zein PMS2 precursor | 2656.99±361.05 | 2779.95±264.43 | 0.7896 |
| GRMZM2G404459 | α-zein Z4 Precursor | 140.46±37.38 | 126.1900±36.06 | 0.7890 |
| GRMZM2G138727 | 27kDa γ-zein | 33154.74±2353.84 | 31990.85±2725.51 | 0.7530 |
| AF546188.1_FG005 | 19kDa α-zein A20 precursor | 31040.84±3550.15 | 29586.54±2597.86 | 0.7480 |
| AF546187.1_FG007 | 19kDa α-zein 19D1 precursor | 1608.29±159.50 | 1686.94±123.82 | 0.7060 |
| GRMZM2G388461 | Zein protein | 737.72±100.46 | 690.42±53.71 | 0.6894 |
| GRMZM2G514479 | 19kDa α-zein B1 | 26670.92±1999.18 | 25540.40±1516.80 | 0.6630 |
| GRMZM2G088273 | Zein protein | 35.82±3.28 | 38.24±4.20 | 0.6610 |
| GRMZM2G397687 | 22kDa α-zein precursor | 4505.03±276.32 | 4229.97±468.83 | 0.6270 |
| GRMZM2G514469 | Zein protein | 0.65±0.22 | 0.44±0.28 | 0.5740 |
| GRMZM2G353268 | 19kDa α-zein A30 precursor | 15236.92±1743.84 | 16432.38±1015.26 | 0.5700 |
| AF546187.1_FG001 | 19kDa α-zein D1Putative | 1738.91±188.06 | 1582.49±125.18 | 0.5070 |
| GRMZM2G160739 | 22kDa α-zein B49 fragment | 2559.15±265.96 | 2825.89±240.84 | 0.4740 |
| GRMZM2G045387 | Zein protein | 3518.09±143.47 | 3379.45±90.85 | 0.4367 |
| GRMZM2G060429 | 16kDa β-zein Zc1 precursor | 2372.69±277.97 | 2937.27±605.34 | 0.4250 |
| GRMZM2G545000 | 19kDa α-zein protein | 7977.13±404.18 | 8583.89±588.68 | 0.4180 |
| AF546188.1_FG007 | 19kDa α-zein 19C2 precursor | 22008.89±2193.83 | 18867.94±2085.61 | 0.3240 |
| AF546188.1_FG002 | Zein protein | 27846.08±1867.76 | 25069.31±1842.41 | 0.3148 |
| GRMZM2G346895 | Zein protein | 1771.79±150.45 | 2010.59±162.55 | 0.3064 |
| GRMZM2G026939 | Z1A α-zein protein | 2725.62±301.45 | 2234.93±190.47 | 0.2040 |
| AF546188.1_FG001 | α-zein protein | 22923.83±1552.78 | 19958.35±1234.95 | 0.1670 |
| GRMZM2G088441 | Zein protein | 262.54±16.41 | 323.57±35.88 | 0.1658 |
| AF546188.1_FG002 | Zein protein | 51.00±4.68 | 34.85±8.51 | 0.1361 |
| GRMZM2G053120 | 19kDa α-zein PMS1 precursor | 257.58±45.21 | 162.07±34.80 | 0.1270 |
| GRMZM2G346897 | 22kDa zein 4 | 3723.56±140.90 | 3258.97±233.59 | 0.1260 |
| GRMZM2G008341 | 19A2 Precursor | 62.19±11.74 | 21.04±10.05 | 0.0240 |
The values are given as the FPKM and are the average of six biological replicates for each NIL (Mean ± SEM).
*P values < 0.0014 (0.05/37) reject the null hypothesis of equal expression after Bonferroni correction.
Although RNAseq data showed there is no differential effect of the maize and teosinte alleles of pbf1 on zein gene expression, it was previously shown by Wu and Messing (2012a) that knocking down pbf1 expression dramatically reduces the 27kDa γ-zine and 22kDa α-zein expression. We decided to check relative zein protein quantities directly in mature kernels. Zein proteins were extracted from mature kernels from eight plants from both of the homozygous NILs and analyzed by SDS–PAGE (Figure 1). There is no apparent visible difference in zein profile between maize and teosinte NILs. In particular, the known pbf1 target genes (the 27kDa γ-zine and 22kDa α-zein) did not show any visible difference in protein levels. Thus, consistent with the RNAseq results, there does not appear to be a difference in zein protein levels between the maize and teosinte pbf1 NILs.
Figure 1.
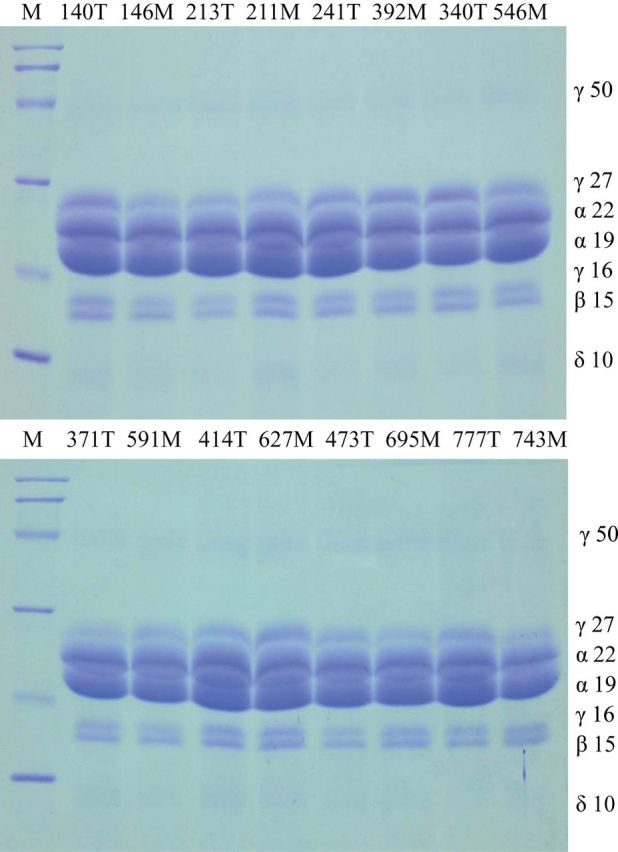
Zein accumulation in mature kernels from the homozygous maize and teosinte NILs for the 6.33 Mbp introgression containing the pbf1 gene. Samples were analyzed using a 15% SDS–PAGE. Maize and teosinte samples were loaded in alternate lanes and labeled M and T, respectively. Each lane was loaded with a sample equal to 500 μg dry seed flour. The protein markers are from top to bottom are 97.4, 66.2, 45, 31, 21.5, and 14.4kDa (Bio-Rad).
In our effort to identify the role pbf1 played in maize domestication, we have succeeded only in demonstrating how difficult this task can be. Although, we detected a 2-fold difference in expression between a maize and teosinte allele of pbf1, we were unable to tie this expression difference to a change in expression of the known targets of pbf1 (zeins) or any other gene in the genome. Although the maize versus teosinte haplotypes for the 6.33 Mbp introgression surrounding pbf1 has an effect on kernel weight (a domestication trait), the effect is in the wrong direction with the teosinte allele conferring larger, heavier kernels.
There are potential explanations for the mostly negative results that we obtained. First, pbf1 may regulate other unknown genes and through these impact an unknown domestication kernel phenotype. Second, maize domestication occurred in central Mexico approximately 9000 years ago. If the kernel or other domestication trait controlled by pbf1 is highly plastic and/or highly determined by environment, the phenotype may not have been expressed in our field conditions in Wisconsin. Third, the mostly maize genetic background in which we assayed the maize and teosinte alleles may suppress the effects of pbf1 on zein gene expression and zein content. Finally, the observed drop in kernel weight associated with the maize allele of pbf1 was unexpected. Because maize has larger kernels than teosinte, one would have expected the maize allele to confer larger kernels. Perhaps, the drop in kernel weight associated with the maize allele represents a negative pleiotropic effect of selection on some other aspect of kernel composition.
As scans for selection become more commonly implemented in diverse species, numerous gene candidates will need to be linked to a phenotype. Even for genes like pbf1 for which the biological function is well documented, identifying the phenotype that was altered during domestication may not always be straight forward.
Funding
National Science Foundation (IOS0820619, ISO1025869 to J.F.D.); State Scholarship Fund of China (2011325029 to Z.L.).
Supplementary Material
Acknowledgments
We thank Bao Kim Nguyen for assistance with the genotyping, and Vince Buffalo and Jeff Ross-Ibarra for information on the genomic locations of the prolamin-box loci.
References
- Ankom Technology.2004. Rapid determination of oil/fat utilizing high temperature solvent extraction. ANKOM XT20 fat analyzer. Fairport (NY): Ankom Technology. [Google Scholar]
- Baker CS.2013. Journal of Heredity adopts joint data archiving policy. J Hered. 104:1. doi:10:1093/jhered/ess137. [DOI] [PubMed] [Google Scholar]
- Doebley JF.1990. Molecular evidence and the evolution of maize. Econ Bot. 44:6–27. [Google Scholar]
- Flint-Garcia SA, Bodnar AL, Scott MP.2009. Wide variability in kernel composition, seed characteristics, and zein profiles among diverse maize inbreds, landraces, and teosinte. Theor Appl Genet. 119:1129–1142. [DOI] [PubMed] [Google Scholar]
- Gore MA, Chia JM, Elshire RJ, Sun Q, Ersoz ES, Hurwitz BL, Peiffer JA, McMullen MD, Grills GS, Ross-Ibarra J, et al. 2009. A first-generation haplotype map of maize. Science. 326:1115–1117. [DOI] [PubMed] [Google Scholar]
- Grabherr MG, Haas BJ, Yassour M, Levin JZ, Thompson DA, Amit I, Adiconis X, Fan L, Raychowdhury R, Zeng Q, et al. 2011. Full-length transcriptome assembly from RNA-Seq data without a reference genome. Nat Biotechnol. 29:644–652. [DOI] [PMC free article] [PubMed] [Google Scholar]
- Hall MB.2001. Factors affecting starch analysis of feeds. Gainesville (FL): Florida Cooperative Extension Service, Institute of Food and Agricultural Sciences, University of Florida. [Google Scholar]
- Hufford MB, Xu X, van Heerwaarden J, Pyhäjärvi T, Chia JM, Cartwright RA, Elshire RJ, Glaubitz JC, Guill KE, Kaeppler SM, et al. 2012. Comparative population genomics of maize domestication and improvement. Nat Genet. 44:808–811. [DOI] [PMC free article] [PubMed] [Google Scholar]
- Jaenicke-Després V, Buckler ES, Smith BD, Gilbert MT, Cooper A, Doebley J, Pääbo S.2003. Early allelic selection in maize as revealed by ancient DNA. Science. 302:1206–1208. [DOI] [PubMed] [Google Scholar]
- Kim D, Pertea G, Trapnell C, Pimentel H, Kelley R, Salzberg SL.2013. TopHat2: accurate alignment of transcriptomes in the presence of insertions, deletions and gene fusions. Genome Biol. 14:R36. [DOI] [PMC free article] [PubMed] [Google Scholar]
- Langmead B, Trapnell C, Pop M, Salzberg SL.2009. Ultrafast and memory-efficient alignment of short DNA sequences to the human genome. Genome Biol. 10:R25. [DOI] [PMC free article] [PubMed] [Google Scholar]
- Leiva-Neto JT, Grafi G, Sabelli PA, Dante RA, Woo YM, Maddock S, Gordon-Kamm WJ, Larkins BA.2004. A dominant negative mutant of cyclin-dependent kinase A reduces endoreduplication but not cell size or gene expression in maize endosperm. Plant Cell. 16:1854–1869. [DOI] [PMC free article] [PubMed] [Google Scholar]
- Li B, Dewey CN.2011. RSEM: accurate transcript quantification from RNA-Seq data with or without a reference genome. BMC Bioinformatics. 12:323. [DOI] [PMC free article] [PubMed] [Google Scholar]
- Matsuoka Y, Vigouroux Y, Goodman MM, Sanchez G J, Buckler E, Doebley J.2002. A single domestication for maize shown by multilocus microsatellite genotyping. Proc Natl Acad Sci USA. 99:6080–6084. [DOI] [PMC free article] [PubMed] [Google Scholar]
- Padmore JM.1990. Protein (crude) in animal feed – combustion method, method no. 990.03, p. 3–4. In: Helrich Kenneth, editor. Official methods of analysis of the association of official analytical chemists. 15th ed. First Supplement. Arlington (VA): AOAC, Inc. [Google Scholar]
- Piperno DR, Flannery KV.2001. The earliest archaeological maize (Zea mays L.) from highland Mexico: new accelerator mass spectrometry dates and their implications. Proc Natl Acad Sci USA. 98:2101–2103. [DOI] [PMC free article] [PubMed] [Google Scholar]
- Robinson MD, McCarthy DJ, Smyth GK.2010. edgeR: a Bioconductor package for differential expression analysis of digital gene expression data. Bioinformatics. 26:139–140. [DOI] [PMC free article] [PubMed] [Google Scholar]
- Robinson MD, Smyth GK.2008. Small-sample estimation of negative binomial dispersion, with applications to SAGE data. Biostatistics. 9:321–332. [DOI] [PubMed] [Google Scholar]
- Shannon LM.2013. The genetic architecture of maize domestication and range expansion [dissertation]. [Madison (WI)]: University of Wisconsin-Madison; p. 188. [Google Scholar]
- Vicente-Carbajosa J, Moose SP, Parsons RL, Schmidt RJ.1997. A maize zinc-finger protein binds the prolamin box in zein gene promoters and interacts with the basic leucine zipper transcriptional activator Opaque2. Proc Natl Acad Sci USA. 94:7685–7690. [DOI] [PMC free article] [PubMed] [Google Scholar]
- Wang Z, Messing J.1998. Modulation of gene expression by DNA-protein and protein-protein interactions in the promoter region of the zein multigene family. Gene. 223:333–345. [DOI] [PubMed] [Google Scholar]
- Wang X, Soloway PD, Clark AG.2011. A survey for novel imprinted genes in the mouse placenta by mRNA-seq. Genetics. 189:109–122. [DOI] [PMC free article] [PubMed] [Google Scholar]
- Wu Y, Messing J.2012a. Rapid divergence of prolamin gene promoters of maize after gene amplification and dispersal. Genetics. 192:507–519. [DOI] [PMC free article] [PubMed] [Google Scholar]
- Wu Y, Messing J.2012b. RNA interference can rebalance the nitrogen sink of maize seeds without losing hard endosperm. PLoS One. 7:e32850. [DOI] [PMC free article] [PubMed] [Google Scholar]
- Xu JH, Messing J.2009. Amplification of prolamin storage protein genes in different subfamilies of the Poaceae. Theor Appl Genet. 119:1397–1412. [DOI] [PubMed] [Google Scholar]
- Zhong S, Joung JG, Zheng Y, Chen YR, Liu B, Shao Y, Xiang JZ, Fei Z, Giovannoni JJ.2011. High-throughput illumina strand-specific RNA sequencing library preparation. Cold Spring Harb Protoc. 2011:940–949. [DOI] [PubMed] [Google Scholar]
Associated Data
This section collects any data citations, data availability statements, or supplementary materials included in this article.