

Abstract
Biased agonists of G protein–coupled receptors may present a means to refine receptor signaling in a way that separates side effects from therapeutic properties. Several studies have shown that agonists that activate the κ-opioid receptor (KOR) in a manner that favors G protein coupling over β-arrestin2 recruitment in cell culture may represent a means to treat pain and itch while avoiding sedation and dysphoria. Although it is attractive to speculate that the bias between G protein signaling and β-arrestin2 recruitment is the reason for these divergent behaviors, little evidence has emerged to show that these signaling pathways diverge in the neuronal environment. We further explored the influence of cellular context on biased agonism at KOR ligand–directed signaling toward G protein pathways over β-arrestin–dependent pathways and found that this bias persists in striatal neurons. These findings advance our understanding of how a G protein–biased agonist signal differs between cell lines and primary neurons, demonstrate that measuring [35S]GTPγS binding and the regulation of adenylyl cyclase activity are not necessarily orthogonal assays in cell lines, and emphasize the contributions of the environment to assessing biased agonism.
INTRODUCTION
The wide expression of κ-opioid receptors (KORs) and their involvement in physiological functions, such as antinociception (1–3) and mood perception (1, 4), have made KOR a possible target for drug development in the treatment of pain. However, although KOR agonists lack the side effects associated with μ-opioid agonists such as morphine, they still have certain side effects associated with their use, including sedation, dysphoria, diuresis, and hallucinations. These adverse events have limited the therapeutic development of KOR agonists (1, 4–6).
KORs are seven transmembrane spanning G protein–coupled receptors (GPCRs) (7, 8) and are widely expressed throughout the central and peripheral nervous systems (9–16). Endogenously, they are activated by opioid peptides, including dynorphins (17, 18). KORs are classically considered to be Gαi/o-coupled receptors that mediate antinociceptive properties by engaging these inhibitory Gα proteins (19, 20). In turn, KOR activation results in the inhibition of adenylyl cyclase activity, leading to decreased cyclic adenosine monophosphate (cAMP) accumulation, whereas G protein–dependent inward rectifying potassium (GIRK) channels are activated downstream of KOR–G protein signaling (21, 22). KORs also interact with β-arrestin proteins (23, 24), which can promote activation of several kinases, including the mitogen-activated protein kinase (MAPK) p38 (25), c-Jun N-terminal kinase (JNK) (26), and the extracellular signal–regulated kinases 1 and 2 (ERK1/2) (27). Downstream signaling to kinases can be mediated by both β-arrestin–dependent and G protein–dependent signaling pathways (25, 27–29).
Although most GPCRs have the potential to interact with both G proteins and β-arrestins, there are opportunities to influence a preference in GPCR signaling between downstream effectors by modifying the agonist; a concept referred to as functional selectivity or biased agonism (30–35). Several biased KOR agonists, representing five distinct chemical scaffolds, have been described that induce preferential G protein signaling over β-arrestin2 recruitment (28, 36–39). Studies in mouse models show that such G protein–biased agonists can preserve the anti-nociceptive (37, 38, 40, 41), antipruritic (40, 41), and antiepileptic (42) properties of a KOR agonist, whereas other responses, such as decreases in spontaneous locomotor activity or sedation, are absent (38–41). Our laboratory has shown that such a compound (triazole 1.1), at doses that enter the brain and occupy KORs, does not induce changes in dopamine levels in the nucleus accumbens in mice as do typical KOR agonists, such as U50,488H or U69,593 (41, 43–47).
These findings, coupled with evidence from intracranial self-stimulation studies (41), strongly suggest that by separating G protein signaling and β-arrestin recruitment pathways, KOR agonists can maintain antinociceptive and antipruritic properties while avoiding dopaminergic fluctuations and may thereby be a means to avoid dysphoria associated with KOR agonism. Although this is an attractive hypothesis, there still remains the question as to whether the separation in physiologies is actually due to the lack of β-arrestin recruitment to KOR in neurons as it is observed in conventional cellular assays. The evaluation of β-arrestin recruitment in the endogenous setting is fraught with technical limitations because there are currently no direct assays that can be reliably applied to assess the interactions between the endogenous β-arrestin and endogenous receptor (that is, immunohistological approaches do not always work because antibodies are poor and expression levels are low). Therefore, we compared assays designed to assess KOR–G protein signaling (stimulation of [35S]GTPγS binding and inhibition of forskolin-stimulated cAMP accumulation) to β-arrestin– dependent KOR internalization in mouse striatal neurons. These findings emphasize the usefulness and the limitations of cell-based signaling assays for determining differences in ligand signaling profiles and demonstrate that, when compared to a conventional KOR agonist, U69,593, triazole 1.1 displays bias for promoting [35S]GTPγS binding and inhibiting cAMP accumulation over promoting KOR internalization in primary striatal neurons.
RESULTS
Evaluation of G protein–dependent signaling assays in KOR-expressing cell lines
Assays measuring cAMP accumulation are amenable to neuronal cultures, however low levels of protein make it difficult to assess [35S]GTPγS binding in primary cultures; therefore, we asked whether the cAMP assay could be used as an orthogonal assay for the [35S]GTPγS binding in cell lines before testing in neurons. Triazole 1.1 and isoquinolinone 2.1 (iso 2.1) are nearly as potent as U69,593 in Chinese hamster ovary (CHO) cell lines expressing the human KOR as measured by [35S]GTPγS binding assays and are biased against β-arrestin2 recruitment relative to U69,593 as a reference agonist (Fig. 1, A and B, and Tables 1 and 2) (37, 41). Notably, triazole 1.1 and iso 2.1 displayed bias against forskolin-stimulated cAMP accumulation (Fig. 1C and Table 1) compared to their ability to stimulate [35S]GTPγS binding, indicating that in CHO cells, the assays are not orthagonal. The inhibition of cAMP accumulation is pertussis toxin– sensitive (Fig. 1D), implicating inhibitory the Gαi/o class of proteins downstream of KOR activation. Moreover, none of the agonists stimulated cAMP accumulation in the absence of forskolin (fig. S1), suggesting that the receptors are not alternatively coupling to Gas. Triazole 1.1 and iso 2.1 were also less potent than U69,593 in stimulating calcium influx in the KOR-CHO cells (Fig. 1E), an effect that was also blocked by pertussis toxin, implicating a dependence on engagement (Fig. 1F). Pretreatment of cellular membranes with pertussis toxin prevented agonist-stimulated [35S]GTPγS binding (Fig. 1G) yet had no effect on β-arrestin2 recruitment (Fig. 1H). These data indicate that triazole 1.1 and iso 2.1 efficiently stimulate pertussis toxin–sensitive Ga protein binding to [35S]GTPγS and inefficiently stimulate downstream signaling events that are also mediated by pertussis toxin– sensitive G proteins. Triazole 1.1 and iso 2.1 stimulate GIRK channels with potency similar to U69,593; no bias was detected between the GIRK and [35S]GTPγS binding assays (Fig. 1I and Table 1). A quantitative comparison of the bias factors was calculated using the operational model relative to the reference agonist U69,593 (Fig. 2 and summarized in Table 2) (48).
Fig. 1. Divergence in signaling across cell-based KOR signaling assays.
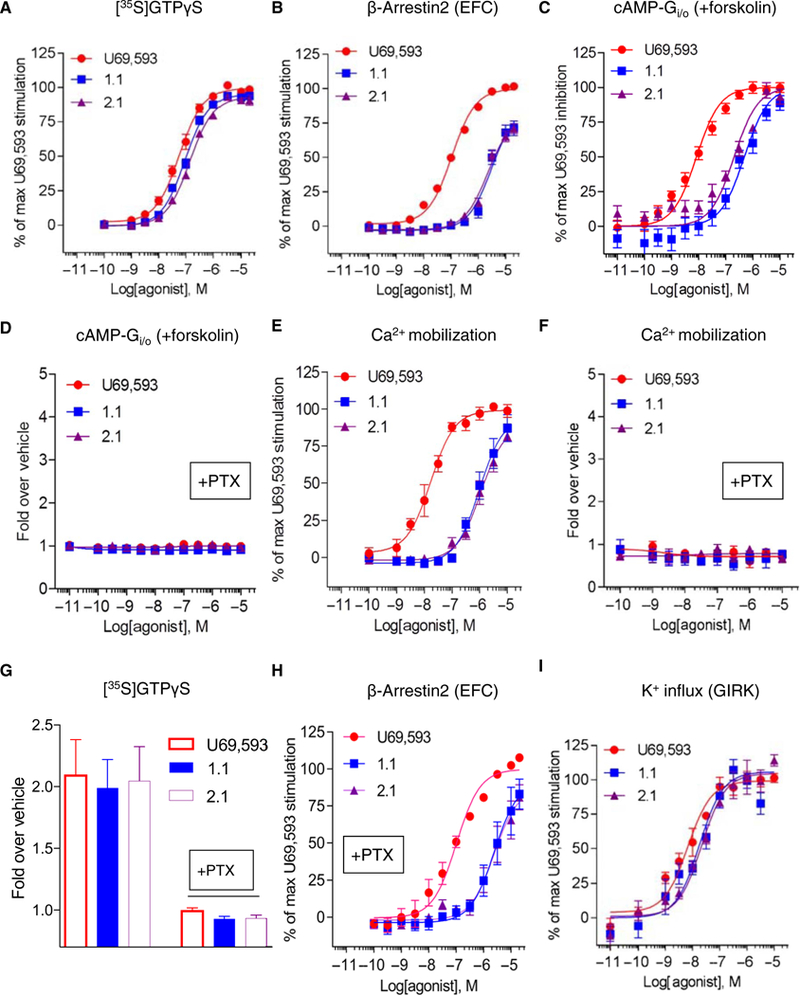
(A) Membrane [35S]GTPγS binding assay in hKOR-CHO cells treated with triazole 1.1 (blue squares) or iso 2.1 (purple triangles), relative to those treated with U69,593 (red circles) at the indicated doses for 1 hour at room temperature. (B) β-arrestin2 recruitment assay [enzyme fragment complementation (EFC)] in the DiscoveRx PathHunter U2OS cell line treated with the KOR agonists for 90 min at 37°C. (C and D) Inhibition of forskolin-stimulated cAMP accumulation assay without (C) or with (D) pertussis toxin (PTX) overnight pretreatment in hKOR-CHO cells incubated with the KOR agonists for 30 min at room temperature. (E and F) Intracellular calcium mobilization without or with pertussis toxin pretreatment in hKOR-CHO cells with the KOR agonist treatment. (G) [35S]GTPγS binding assay using membranes prepared from pertussis toxin–pretreated CHO-hKOR cells. (H) Effect of pertussis toxin overnight pretreatment on β-arrestin2 recruitment (EFC) [EC50 (μM) ± SEM: 105 ± 11 (U69), 2980 ± 741 (triazole 1.1), and 3132 ± 894 (iso 2.1); compare to “-PTX” condition in Table 1]. P > 0.05 by one-way analysis of variance (ANOVA) with Bonferroni’s multiple comparisons test. (I) Measurement of GIRK channel activation by a Fluorescent Imaging Plate Reader (FLIPR) potassium assay in CHO-hKOR-hGIRK1/2 cells incubated with increased concentrations of the KOR agonists. Data are presented as means ± SEM from n ≥ 3 independent experiments for all assays.
Table 1. Signaling parameters for the KOR agonists in the cell-based functional assays.
Data are presented as means ± SEM from n ≥ 3 independent experiments performed in duplicate to quadruplicate. Emax values were normalized calculation to the maximum stimulation by U69,593. Ca2+ accumulation, intracellular calcium mobilization assay; K+ accumulation, GIRK channel activation assay.
| Compound | [35S]GTPγS binding | |||
|---|---|---|---|---|
| EC50 (nM) | Emax (%) | LogR | ΔLogR | |
| U69,593 | 66 ± 13 | 100 | 7.26 ± 0.09 | 0 |
| 1.1 | 96 ± 10 | 95 ± 1 | 7.00 ± 0.05 | −0.29 ± 0.07 |
| 2.1 | 155 ± 30 | 94 ± 2 | 6.80 ± 0.07 | −0.44 ± 0.06 |
| βarr2 recruitment (EFC) | ||||
| EC50 (nM) | Emax (%) | LogR | ΔLogR | |
| U69,593 | 112 ± 11 | 100 | 7.00 ± 0.06 | 0 |
| 1.1 | 3338 ± 405 | 88 ± 6 | 5.44 ± 0.04 | −1.56 ± 0.09 |
| 2.1 | 2447 ± 276 | 82 ± 4 | 5.59 ± 0.06 | −1.42 ± 0.09 |
| Forskolin-stimulated cAMP accumulation | ||||
| EC50 (nM) | Emax (%) | LogR | ΔLogR | |
| U69,593 | 12 ± 2 | 100 | 8.02 ± 0.09 | 0 |
| 1.1 | 309 ± 65 | 94 ± 5 | 6.49 ± 0.12 | −1.64 ± 0.13 |
| 2.1 | 303 ± 46 | 98 ± 5 | 6.55 ± 0.04 | −1.33 ± 0.09 |
| Ca2+ accumulation | ||||
| EC50 (nM) | Emax (%) | LogR | ΔLogR | |
| U69,593 | 19 ± 5 | 100 | 7.79 ± 0.12 | 0 |
| 1.1 | 1064 ± 186 | 97 ± 9 | 5.96 ± 0.14 | −1.91 ± 0.16 |
| 2.1 | 1594 ± 491 | 98 ± 8 | 5.97 ± 0.15 | −1.82 ± 0.19 |
| K+ accumulation | ||||
| EC50 (nM) | Emax (%) | LogR | ΔLogR | |
| U69,593 | 8 ± 2 | 100 | 8.29 ± 0.18 | 0 |
| 1.1 | 21 ± 8 | 108 ± 8 | 8.03 ± 0.27 | −0.23 ± 0.03 |
| 2.1 | 22 ± 6 | 105 ± 9 | 7.85 ± 0.13 | −0.41 ± 0.18 |
Table 2. Analysis of bias factors between functional assays.
Using U69,593 as a reference agonist, the ΔΔLogR and bias factors () were calculated as described in “Data analysis and statistics” (Materials and Methods) using the ΔLogR values listed in Table 1. GTP, [35S]GTPγS binding assay; βarr2, β-arrestin2 recruitment assay (EFC); cAMP, forskolin-stimulated cAMP accumulation assay; Ca2+, intracellular calcium mobilization assay; GIRK, GIRK channel activation assay; 95% CI, 95% confidence interval.
| Comparison of assays | 1.1 |
2.1 |
||
|---|---|---|---|---|
| ΔΔLogR (95% CI) | Bias factor | ΔΔLogR (95% CI) | Bias factor | |
| GTP/βarr2 | 1.27 (1.03 to 1.52) | 19 | 0.98 (0.73 to 1.22) | 9 |
| GTP/cAMP | 1.35 (1.02 to 1.69) | 23 | 0.89 (0.64 to 1.13) | 8 |
| GTP/Ca2+ | 1.62 (1.24 to 1.99) | 42 | 1.38 (0.94 to 1.82) | 24 |
| GTP/GIRK | −0.06 (−0.30 to 0.18) | 0.9 | −0.04 (−0.39 to 0.32) | 0.9 |
| cAMP/GTP | −1.35 (−1.69 to −1.02) | 0.04 | −0.89 (−1.13 to −0.64) | 0.1 |
| cAMP/βarr2 | −0.08 (−0.46 to 0.30) | 0.8 | 0.09 (−0.20 to 0.38) | 1 |
| cAMP/Ca2+ | 0.26 (−0.21 to 0.74) | 2 | 0.49 (0.03 to 0.95) | 3 |
| cAMP/GIRK | −1.41 (−1.88 to −0.94) | 0.04 | −0.92 (−1.34 to −0.50) | 0.1 |
| Ca2+/GTP | −1.62 (−1.99 to −1.24) | 0.02 | −1.38 (−1.82 to −0.94) | 0.04 |
| Ca2+/βarr2 | −0.35 (−0.77 to 0.08) | 0.5 | −0.40 (−0.91 to 0.10) | 0.4 |
| Ca2+/cAMP | −0.26 (−0.74 to 0.21) | 0.5 | −0.49 (−0.95 to −0.03) | 0.3 |
| Ca2+/GIRK | −1.68 (−2.21 to −1.14) | 0.02 | −1.41 (−2.12 to −0.71). | 0.03 |
| GIRK/GTP | 0.06 (−0.18 to 0.03) | 1.1 | 0.04 (−0.32 to 0.39) | 1 |
| GIRK/βarr2 | 1.33 (1.04 to 1.62) | 21 | 1.01 (0.57 to 1.46) | 10 |
| GIRK/cAMP | 1.41 (0.94 to 1.88) | 26 | 0.92 (0.50 to 1.34) | 8 |
| GIRK/Ca2+ | 1.68 (1.14 to 2.21) | 48 | 1.41 (0.71 to 2.12) | 26 |
Fig. 2. Calculation of ligand bias for across cell-based KOR signaling assays.
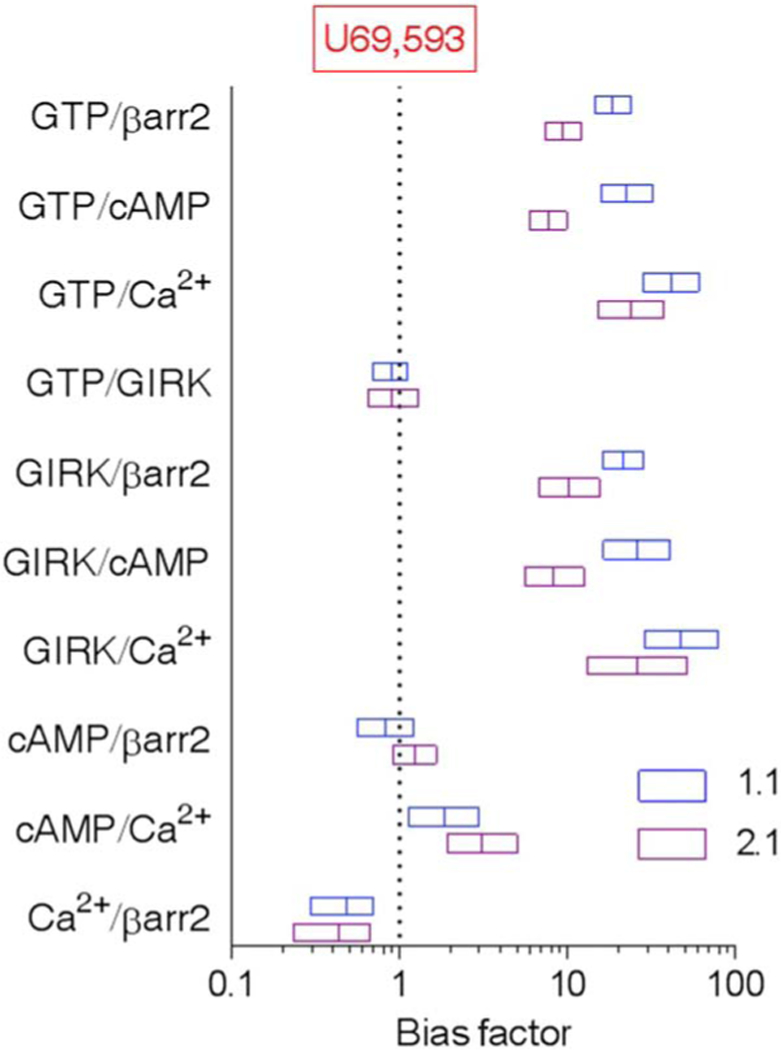
Bias factors of triazole 1.1 (blue boxes) and iso 2.1 (purple boxes) for the indicated pathways are calculated from the transduction coefficients listed in Tables 1 and 2 and are plotted on a log scale. Bias factor for the reference agonist U69,593 is 1 in all assays. Data are presented as means ± SEM. Errors were calculated by unpaired t test comparing ΔLogR values of the test compounds between two functional assays. Signaling pathways are presented as follows: [35S]GTPγS binding [guanosine 5′-triphosphate (GTP)], β-arrestin2 recruitment [βarr2 (EFC)], inhibition of forskolin-stimulated cAMP accumulation (cAMP), intracellular calcium mobilization (Ca2+), and GIRK channel activation (GIRK).
Evaluation of factors affecting regulation of adenylyl cyclase activity
To investigate this apparent discrepancy between pertussis toxin–sensitive, KOR-mediated [35S]GTPγS binding and the inhibition of forskolin-stimulated cAMP accumulation, we explored several potential effectors. The decreased potency in the cyclase assay by the biased agonists was not affected by shortening or lengthening drug exposure time (5, 15, 30, or 60 min; fig. S2 and table S1). Regulators of G protein signaling (RGS) proteins can affect the efficiency of coupling the G protein activation and the regulation of the secondary effectors, such as adenylyl cyclases (49, 50). Therefore, we overexpressed hRGS4, hRGS9.2, or hRGS12.3 (recombinant human RGS protein isoforms), which are highly expressed in brain, particularly in the striatum (51–53). Expression of RGS4 or RGS9.2 had no significant effects on the potency of either agonist, whereas expression of RGS12.3 decreased the potency of both agonists in the forskolin-stimulated cAMP accumulation assay (fig. S3, A to C and table S4). However, these attempts did not resolve the discrepancy.
Hence, we explored species differences with respect to KOR and the cell lines expressing KOR. In CHO cells expressing mouse KOR, triazole 1.1 and iso 2.1 retain their bias for promoting [35S]GTPγS binding over inhibition of cAMP accumulation and β-arrestin2 recruitment (fig. S4, A to D, and table S2). Expressing the mouse KOR in a mouse embryonic fibroblast (MEF) cell line did not restore potency to the biased agonists in the cyclase assay relative to U69,593 (fig. S5A and table S3). Moreover, elimination of β-arrestins did not affect the potency of any of the agonists in the cyclase assay performed in β-arrestin1/2-knockout (βarr1/2-KO) MEFs (fig. S5B and table S3).
A more general approach was then taken to determine whether a cytosolic factor was involved. U69,593 was significantly less potent in inhibiting forskolin-stimulated cAMP accumulation in isolated cellular membrane preparations compared with whole-cell assays, whereas triazole 1.1 was significantly more potent in the membrane assay compared to the whole-cell assay (Fig. 3A and Table 3). The effect on the relative potency between U69,593 and triazole 1.1 was sufficient to nearly eliminate the relative bias between [35S]GTPγS binding and cAMP accumulation for triazole 1.1 (Fig. 3B), suggesting that a cytosolic factor in the CHO-hKOR cells is affecting signal transduction between G protein binding and inhibition of adenylyl cyclase that does not affect KOR signaling to GIRK channel activation (Fig. 1I).
Fig. 3. Evaluation of forskolin-stimulated cAMP accumulation in isolated cell membranes.
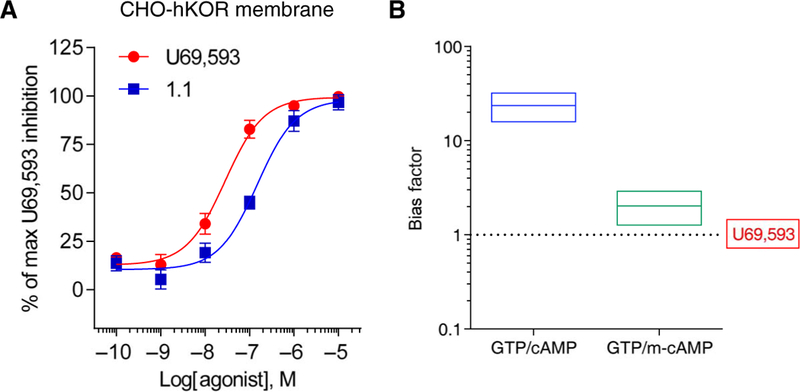
(A) Membrane-based inhibition of forskolin-stimulated cAMP accumulation assays using cell membranes prepared from CHO-hKOR cells that were incubated with increased concentrations of test compounds for 30 min at room temperature. Data are presented as means ± SEM of n = 7 independent experiments. (B) Bias factors are calculated using the transduction coefficients listed in Tables 1 and 3 and are plotted on a log scale. Data are presented as means ± SEM. Errors were calculated by unpaired t test comparing ΔLogR values of the test compounds between two functional assays. [35S]GTPγS binding (GTP),cell-based inhibition of forskolin-stimulated cAMP accumulation (cAMP), and membrane-based inhibition of forskolin-stimulated cAMP accumulation (m-cAMP).
Table 3. Signaling parameters for forskolin-stimulated cAMP accumulation in CHO-hKOR cells or using CHO-hKOR cell membranes.
U69,593 serves as the reference agonist. Data are presented as means ± SEM from n ≥ 4 independent experiments performed in duplicate to quadruplicate. P values were obtained by comparing the values of the KOR agonist treatment in CHO-hKOR cells to CHO-hKOR cell membranes using a Student’s t test.
| Assay system | U69,593 | 1.1 | Fold difference (EC50 1.1/EC50 U69) | LogR | ΔLogR | |
|---|---|---|---|---|---|---|
| hKOR (cell)* | EC50 (nM) | 12 ± 2 | 309 ± 65 | 34 ± 9 | 8.02 ± 0.09 | 0 |
| Emax (%) | 100 | 94 ± 5 | 6.49 ± 0.12 | −1.64 ± 0.13 | ||
| hKOR (membrane) | EC50 (nM) | 35 ± 8† | 155 ± 30‡ | 5 ± 0.6† | 7.54 ± 0.11 | 0 |
| Emax (%) | 100 | 98 ± 4 | 6.97 ± 0.14 | −0.57 ± 0.15 |
Whole-cell forskolin-stimulated cAMP accumulation assay in CHO-hKOR cells was shown in Table 1 for comparison to the membrane-based forskolin-stimulated cAMP accumulation.
P < 0.01.
P < 0.05
Evaluation of biased agonists in neurons
KORs are predominantly expressed in neurons; therefore, we asked whether the signaling bias profile would persist in a more native context. When human KOR was expressed in the human neuronal cell line SH-SY5Y, triazole 1.1 and iso 2.1 remained equally as potent as U69,593 in the [35S]GTPγS binding assay (Fig. 4A). In this context, triazole 1.1 and iso 2.1 were also potent agonists in the cyclase assay (Fig. 4B) and no longer displayed bias between the two (Table 4). Together, these data suggest that there is a fundamental difference between the neuronal and conventional cell lines that greatly affects the cyclase inhibition mediated by the two biased agonists at KORs.
Fig. 4. Evaluation of bias in a neuronal cell line expressing hKOR (SH-SY5Y-hKOR).
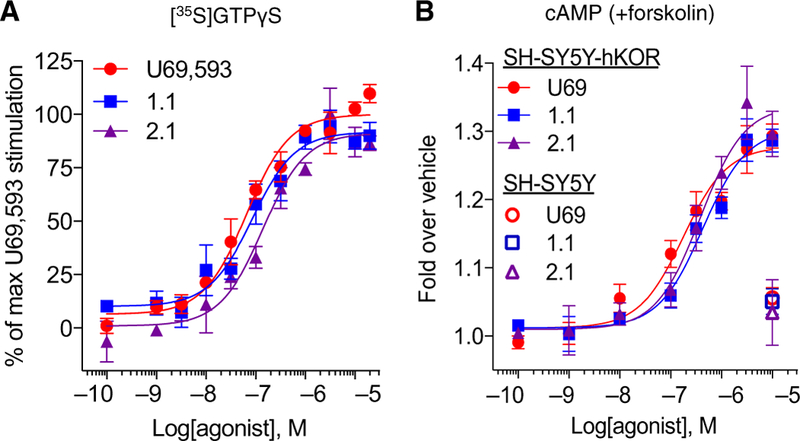
(A) [35S]GTPγS binding assay using membranes prepared from SH-SY5Y-hKOR cells that were incubated with increased concentrations of test compounds. Graphs are presented as means ± SEM of n ≥ 3 independent experiments. EC50 (μM) ± SEM: 66 ± 11 (U69), 99 ± 22 (triazole 1.1), and 174 ± 67 (iso 2.1); P > 0.05 for triazole 1.1 and iso 2.1 versus U69,593, one-way ANOVA with Bonferroni’s post hoc test. Emax (%) ± SEM: 100 (U69), 92 ± 2 (triazole 1.1), 92 ± 3 (iso 2.1). (B) Concentration response curves of the forskolin-stimulated cAMP accumulation assay in KOR agonist–treated SH-SY5Y cells with or without hKOR overexpression. EC50 (μM) ± SEM: 185 ± 50 (U69), 410 ± 76 (triazole 1.1), and 331 ± 55 (iso 2.1); P < 0.05 for triazole 1.1 versus U69 and P > 0.05 for iso 2.1 versus U69, one-way ANOVA with Bonferroni’s post hoc test. Emax (%) ± SEM: 100 (U69), 108 ± 6 (triazole 1.1), and 116 ± 9 (iso 2.1). Data are presented as means ± SEM of n ≥ 3 independent experiments.
Table 4. Bias analysis between [35S]GTPγS binding and forskolin-stimulated cAMP accumulation for SH-SY5Y-hKOR cells.
LogR, ΔLogR, ΔΔLogR, and bias factors () were calculated using U69,593 as the reference agonist, as described in “Data analysis and statistics” using the values stated in the figure legends of Fig. 4. Data are presented as means ± SEM from n ≥ 3 independent experiments performed in duplicate to triplicate. G, [35S]GTPγS; cAMP, forskolin-stimulated cAMP accumulation; 95% CI, 95% confidence interval.
| Compound | [35S]GTPγS binding |
cAMP |
ΔΔLogR (95% CI) | Bias factor (G/cAMP) | ||
|---|---|---|---|---|---|---|
| LogR | ΔLogR | LogR | ΔLogR | |||
| U69,593 | 7.18 ± 0.06 | 0 | 6.32 ± 0.30 | 0 | 0 | 1 |
| 1.1 | 7.06 ± 0.15 | −0.112 ± 0.09 | 6.26 ± 0.30 | −0.059 ± 0.12 | −0.053(−0.43 to 0.32) | 0.9 |
| 2.1 | 6.74 ± 0.13 | −0.434 ± 0.08 | 6.14 ± 0.48 | −0.219 ± 0.06 | −0.215 (−0.46 to 0.03) | 0.6 |
Convergence of G protein signaling assays in striatal tissue
In membranes prepared from striata taken from wild-type β-arrestin2 (βarr2-WT) mice, triazole 1.1 potently stimulated [35S]GTPγS binding (Fig. 5A and Table 5), confirming results reported in striata from C57BL/6 mice (41). In the cAMP accumulation assay performed in primary cultures of mouse striatal neurons isolated from βarr2-WT mice, triazole 1.1 had a similar potency as U69,593, and no bias was evident between the two agonists in these two assays (Fig. 5B and Table 5). In addition, pertussis toxin blocked all agonist activity, implicating a Gαi/o-dependent mechanism in KOR-mediated inhibition of adenylyl cyclase for both agonists in mouse striatal neurons (Fig. 5C).
Fig. 5. Evaluation of KOR-mediated G protein signaling in striatum and striatal neurons.
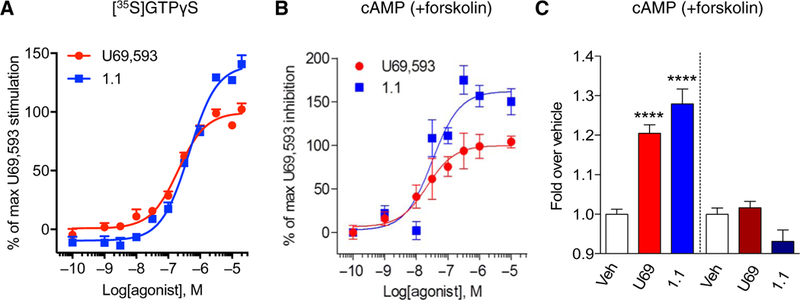
(A) [35S]GTPγS binding assay using membranes prepared from adult mouse striatum tissue. n = 6 independent experiments using at least one mouse striatum tissue each time. (B) Concentration response curves of inhibition of forskolin-stimulated cAMP accumulation in mouse primary striatal neurons. n = 4 independent experiments.(C) Inhibition of cAMP accumulation in response to vehicle (Veh) or KOR agonists (10 μM) without pertussis toxin pretreatment (left of the dashed line) or with pertussis toxin pretreatment (right of the dashed line) in mouse primary striatal neurons. Data are presented as means ± SEM of n = 4 independent experiments. ****P < 0.001 compared to vehicle treatment, one-way ANOVA with Bonferroni’s post hoc test.
Table 5. Signaling parameters for the assays using mouse striatal membranes and mouse primary striatal neurons.
U69,593 serves as the reference agonist. Data are presented as means ± SEM from n ≥ 4 independent experiments. G, [35S]GTPgS binding; cAMP, forskolin-stimulated cAMP accumulation; KORint, KOR internalization; 95% CI, 95% confidence interval.
| Compound | [35S]GTPγS binding |
ΔΔLog(Emax/EC50) (G/cAMP, 95% CI) | Bias factor (G/cAMP) | |||
|---|---|---|---|---|---|---|
| EC50 (nM) | Emax (%) | Log(Emax/EC50) | ΔLog(Emax/EC50) | |||
| U69 | 221 ± 26 | 100 | 8.68 ± 0.06 | 0 | 0 | 1 |
| 1.1 | 486 ± 98* | 141 ± 53 | 8.51 ± 0.07 | −0.17 ± 0.03 | −0.02 (−0.25 to 0.10) | 1.0 |
| Compound | Inhibition of cAMP accumulation |
ΔΔLog(Emax/EC50) (G/KORint) | Bias factor (G/KORint) | |||
| EC50 (nM) | Emax (%) | Log(Emax/EC50) | ΔLog(Emax/EC50) | |||
| U69 | 17 ± 4 | 100 | 7.76 ± 0.09 | 0 | 0 | 1 |
| 1.1 | 45 ± 12 | 167 ± 20 | 7.57 ± 0.15 | −0.19 ± 0.1 | 1.37 | 24 |
| Compound | KOR internalization |
ΔΔLog(Emax/EC50) (cAMP/KORint) | Bias factor (cAMP/KORint) | |||
| EC50 (nM)† | Emax (%)† | Log(Emax/EC50)† | ΔLog(Emax/EC50)† | |||
| U69 | 19 | 100 | 9.73 | 0 | 0 | 1 |
| 1.1 | 238 | 37 | 8.19 | −1.54 | 1.36 | 23 |
P < 0.05, Student’s t test for U69,593 versus triazole 1.1.
Values were obtained from the concentration response curve of which each data point is from the average of n ≥ 3 independent neuron preparations.
KOR internalization in primary striatal neurons
Given that the bias observed in CHO-hKOR cells observed between [35S]GTPγS binding and the forskolin-stimulated cAMP accumulation assay did not translate to the striatal neurons, we then questioned whether the [35S]GTPgγS/β-arrestin2 bias would be recapitulated in neurons. Technical limitations, such as low expression and poor selectivity of antibodies, currently prevent the direct assessment of endogenous KOR-β-arrestin2 interactions; therefore, we chose to use KOR internalization, which is β-arrestin–dependent [fig. S6, A to D (54)], as a surrogate measure of β-arrestin engagement in neurons. Because antibodies to KOR are not highly selective, we expressed the N-terminally hemagglutinin (HA)– tagged mouse KOR in primary striatal cultures derived from βarr2-WT and βarr2-KO mice. U69,593 induced robust and dose-dependent increases in KOR internalization. However, triazole 1.1 was much less efficient in promoting KOR internalization in the βarr2-WT striatal neurons (Fig. 6,A and B, and Table 5). In βarr2-KO striatal neurons, internalization induced by U69,593 (100 nM) was significantly diminished compared to βarr2-WT striatal neurons; no internalization was detected for triazole 1.1 (100 nM)–treated βarr2-KO neurons compared to vehicle-treated controls (Fig. 6C). In neurons, triazole 1.1 induced comparable [35S]GTPγS binding and inhibition of cAMP accumulation, whereas it displayed bias against KOR internalization (Table 5). Together with the demonstration that internalization of KOR is regulated by β-arrestin2 in neurons, these data suggest that triazole 1.1 maintains bias for G protein signaling over β-arrestin–dependent processes in vivo.
Fig. 6. Evaluation of β-arrestin2–dependent KOR internalization in striatal neurons.
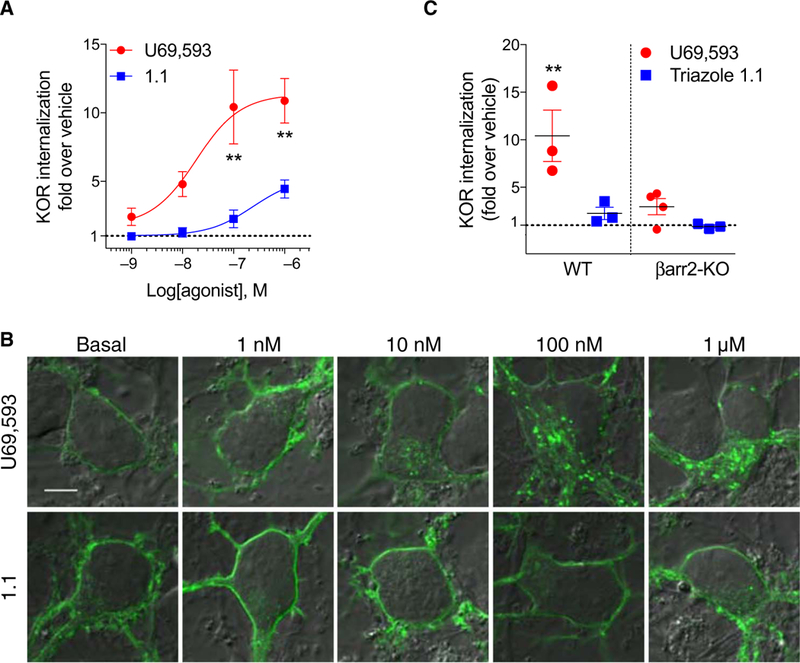
(A) KOR internalization concentration response curves in WT primary striatal neurons treated with U69,593 or triazole 1.1 for 30 to 50 min. F(1,17) = 28.31; P < 0.0001, two-way ANOVA; **P < 0.01, Bonferroni’s post hoc test. Each data point was obtained from the mean value of 6 to 11 confocal images of n ≥ 3 independent primary striatal neuron preparations. (B) Representative confocal images of KOR internalization in WT primary striatal neurons treated as in (A). Twenty-one to 69 images were analyzed for each treatment. Scale bar, 5 μm. (C) Scatterplot analysis of KOR internalization in response to 100 μM of either compound in WT and βarr2-KO primary striatal neurons. **P < 0.01 for U69,593 in WT versus U69,593 in βarr2-KO primary striatal neurons by one-way ANOVA with Bonferroni’s post hoc test. Data are presented as means ± SEM from n ≥ 3 independent experiments.
DISCUSSION
Here, we have used agonists that have been shown to display bias for stimulating KOR-mediated [35S]GTPγS binding over β-arrestin2 recruitment in cell-based signaling assays (37, 40, 41) to probe whether such bias would persist across different cellular contexts and particularly in neurons. In KOR signaling assays performed in conventional transfected CHO cell lines, accumulation of cAMP and [35S]GTPγS binding assays did not prove to be orthogonal assays because the compounds that are biased for promoting [35S]GTPγS binding over β-arrestin2 recruitment are also biased for inducing [35S]GTPγS binding over inhibiting cAMP accumulation (Figs. 1 and 2 and Table 1). However, in striatal neurons, both triazole 1.1 and U69,593 potently induce G protein signaling as determined by [35S]GTPγS binding and the cyclase assay, whereas triazole displays bias for these pathways over β-arrestin2–depedent internalization of KOR.
These findings emphasize the importance of context to the perception and detection of ligand signaling bias. Although our attempts to reveal specific factors, such as RGS protein expression, were not definitive, we did find that the apparent bias observed between the G protein assays ([35S]GTPγS and cAMP measures) in the cell lines and neurons may reside in cytosolic factors because isolating cellular membranes improved triazole 1.1 potency relative to U69,593, which lost potency when the cytosol was removed (Fig. 3).
There remain multiple potential factors that could be contributing to the divergence between pertussis toxin–sensitive[35S]GTPγS binding and inhibition of cAMP accumulation seen in the cell lines that is lost in the neurons, including contribution of membrane-associated proteins. For example, adenylyl cyclase isoenzymes are differentially expressed with adenylyl cyclase 5 that is preferentially expressed in striatal neurons and found at low levels in CHO cells (55). Phosphodiesterases (PDEs), which regulate the cAMP-dependent signaling pathway by catalyzing hydrolysis of cAMP to AMP, are also differentially expressed, with PDE3 and PDE4 found in MEFs and CHO cells (56, 57) and PDE1 and PDE10 found predominantly in striatum (58–60). Although we did not solve the missing (or contributing) factors that explain the divergence in the cell lines, we feel that these observations will be valuable for drug screening efforts that seek bias between G protein and β-arrestin recruitment downstream of KOR activation using cell-based expression systems.
Triazole 1.1 and iso 2.1 have been shown to produce antinociception (37) and antipruritic effects in mice (41). Further studies in mice showed that triazole 1.1 had no measurable effect on dopamine levels as measured by cyclic voltammetry in the mouse nucleus accumbens slice preparation and from microdialysates from freely moving mice (41), suggesting that this region would be a relevant tissue source in which to investigate biased signaling. Although we are able to measure [35S]GTPγS binding and cAMP accumulation in striatum, we were not able to directly measure KOR-β-arrestin2 interactions under endogenous conditions due to nonselective KOR antibodies and relatively low receptor numbers. Moreover, although our internalization studies support a divergence between the triazole’s ability to stimulate G protein signaling pathways over internalization/β-arrestin recruitment, they do not rule out a scenario where there are other factors at play beyond G proteins and β-arrestins determining KOR-mediated signaling. These yet identified factors may underlie the pathways that are involved in KOR regulation of dopamine levels and subsequent sedation and dysphoria.
Furthermore, although these studies compare the effects of triazole 1.1 to U69,593 in striatal neurons, they should not be seen as definitive for how all biased KOR agonists act in neurons. Earlier studies have examined the effects of diverse agonists on peripheral neurons wherein functional selectivity of KOR ligand–mediated signaling was reported (61) with divergences occurring between U50,488 and salvinorin A in regard to the activation of JNK and ERK, which correlated with differential responses to nociceptive stimuli. In other studies, 6′guanidinonal-trindole (6′GNTI) was shown to be biased for activating GTPγS binding over β-arrestin2 recruitment in cells (28, 36), whereas 6′GNTI induced AKT but not ERK1/2 phosphorylation in striatal neurons (as opposed to U69,593, which activated both kinases) (28). Nalfurafine has also been reported to show bias for activating ERK1/2 over p38 in human embryonic kidney (HEK) cells (62). Here, downstream kinase activation was not studied, although bias for [35S]GTPγS binding over ERK activation within the triazole 1.1 scaffold has previously been reported in CHO cells (63).
It should be noted that triazole 1.1 has a different signaling profile than certain other biased KOR agonists, such as 6′GNTI; triazole 1.1 is a full agonist in the GTPγS binding and the β-arrestin2 recruitment assay, whereas 6′GNTI is a partial agonist in both assays (28). Nalfurafine is a full agonist at KOR in GTPγS binding assays (its effects on β-arrestin recruitment have not been reported to date) (64), yet it is also a partial agonist at the β-opioid receptor and a low-affinity antagonist at nociceptin receptors (65). Therefore, other pharmacological properties (that is, efficacy, kinetics, potency, affinity, and polypharmacology), in addition to or besides signaling bias, will contribute to the effects on physiological responses. The studies described here are exemplary of triazole 1.1 actions in striatal neurons and not of all KOR biased agonists in all tissues; in vivo, KOR actions are likely more nuanced than being simply G protein– or β-arrestin–mediated.
Overall, our studies not only provide insight into the utility of cell-based receptor expression systems for evaluating ligand bias but also serve as a demonstration that bias is highly context-dependent and may or may not translate into the endogenous environment. Hence, had we began our studies with [35S]GTPγS binding and cAMP accumulation, we would have found agonists biased for [35S]GTPγS over cAMP accumulation, a condition that does not recapitulate in vivo. Had we screened for cAMP over β-arrestin2 recruitment, we would have only found weakly potent agonists. From our studies, we are confident that triazole 1.1 produces different signaling outputs downstream of KOR activation; however, we appreciate that changing the assay and the cellular context will change the perception of signaling bias. Ultimately, we anticipate that such evaluations in physiologically relevant contexts will point toward optimal and unwanted signaling pathways, and the generation of tools such as the triazole 1.1 will facilitate such discoveries.
MATERIALS AND METHODS
Compounds
U69,593 was purchased from Sigma, and triazole 1.1 and iso 2.1 were synthesized as described previously (37). U69,593 was prepared in ethanol, and triazole 1.1 and iso 2.1 were prepared in dimethyl sulfoxide (DMSO). All compounds were prepared as 10 mM stock in ethanol for U69,593 or DMSO for triazole 1.1 and iso 2.1. All reagents were diluted to working concentration in vehicle containing equal amount of DMSO and ethanol no more than 1% in any assay. Pertussis toxin from Bordetella pertussis was purchased from Sigma.
Constructs and cell line creation
The human KOR complementary DNA (cDNA) including three HA tags (3×HA-hKOR, cDNA.org) in pcDNA3.1 was cloned into a murine stem cell retroviral expression vector. Human GIRK1 (hGIRK1), human RGS4 (hRGS4), human RGS9 variant 2 (hRGS9.2), and human RGS 12 variant 3 (hRGS12.3) cDNA were purchased from OriGene, and hGIRK2 cDNA was purchased from GE Life Sciences. For 3×HA-hKOR-hGIRK1-hGIRK2, 3×HA-hKOR-Myc-hRGS4, or −9.2 or −12.3 constructs, the cDNA of each gene (cDNA were purchased from cDNA.org.) was cloned into a murine stem cell retroviral expression vector translationally linked by a high-efficient self-cleaving 2A peptide to ensure similar expression of each gene (66, 67). The cDNA of mouse KOR (Mammalian Gene Collection) was first cloned to N-terminal HA-tagged vector with the cytomegalovirus (CMV) promoter (Clontech). Then, the CMV promoter-mKOR sequence was subcloned into murine stem cell retroviral expression vector with hygromycin selection marker. Primer sequences are shown in table S5.
CHO cell lines stably expressing hKOR with hGIRK1/2 channels, or hKOR with hRGS proteins, a SH-SY5Y cell line stably expressing hKOR, and WT and βarr1/2-KO MEF cell lines that stably express hKOR or mKOR were generated by viral transduction using a Phoenix-HEK cell expression system. Infected cells were then subjected to puromycin selection and flow cytometry to select the cell populations with HA surface expression to make the cell lines (CHO-hKOR-hGIRK1/2, CHO-hKOR-hRGS4, CHO-hKOR-hRGS9.2, CHO-hKOR-hRGS12.3, SH-SY5Y-hKOR, and WT or βarr1/2 KO MEF-hKOR or mKOR). For the CHO-mKOR and U2OS-β-arrestin2-GFP-mKOR cell lines, the mKOR cDNA was expressed in CHO and U2OS-β-arrestin2-GFP cells by electroporation. The cells were then selected by hygromycin and subjected to flow cytometry to select cells for stable cell line propagation.
Cell culture
All CHO cell lines were maintained in Dulbecco’s modified Eagle’s medium (DMEM)/F-12 media (Invitrogen) supplemented with 10% fetal bovine serum (FBS), 1% penicillin/streptomycin, and either geneticin (500 μg/ml; CHO-hKOR cells) or puromycin (5 μg/ml; CHO-hKOR-hGIRK and CHO-hKOR-hRGS cells). WT and βarr1/2-KO MEF-hKOR or mKOR cells were maintained in DMEM (Invitrogen) supplemented with 10% FBS, 1% penicillin/streptomycin, and puromycin (5 μg/ml). U2OS-hKOR cells (DiscoveRx) and U2OS-βarr2-GFP-mKOR cells were maintained in MEM (Invitrogen) supplemented with 10% FBS, 1% penicillin/streptomycin, geneticin (500 μg/ml), and hygromycin (250 μg/ml). SH-SY5Y-hKOR and parental SH-SY5Y cells were maintained in DMEM/F12 GlutaMax media (Invitrogen) supplemented with 10% FBS and 1% penicillin/streptomycin with or without puromycin (0.5 μg/ml). All cells were grown at 37°C under 5% CO2 and 95% humidity.
Animals
WT and βarr2-KO were generated by homozygous breeding to generate neurons. Littermates of mixed male and female pups were euthanized on postnatal day 1 and prepared for primary neuron cultures as described below. All experiments were performed with the approval of the Institutional Animal Care and Use Committee of The Scripps Research Institute and in accordance with National Institutes of Health (NIH) guidelines.
Primary neuronal culture
Primary striatal neuronal cultures were using postnatal day 1 mouse neonates from homozygous breeding of WT or βarr2-KO mice. Striatal neurons were prepared as described (68). Neurons were plated on a poly-L-lysine–coated 96-well plate for forskolin-stimulated cAMP accumulation assays or a poly-L-lysine–coated glass-bottom confocal dish for KOR internalization assays. Media were replaced with one-third of refresh neural basal complete media supplemented with 10 μM B-D-arabinofuranoside (Sigma #C1768) from day in vitro 4 (DIV4) every other day until assay was performed.
[35S]GTPγS binding assay
Membranes from CHO-hKOR cells were prepared as described previously (28, 37). For each reaction, 15 μg of membrane protein was incubated in an assay buffer containing 0.1 nM [35S]GTPγS and compounds of increasing concentrations in a total volume of 200 μl for 1 hour at room temperature. Membranes from SH-SY5Y-hKOR cells and brain tissues were prepared as described previously (69). For each reaction,2.5 μg of membrane protein was incubated in an assay buffer containing 0.1 nM [35S]GTPγS and compounds of increasing concentrations in a total volume of 200 μl for 2 hours at room temperature. The reactions were then filtrated through 96-well GF/B filter plates (PerkinElmer) using a 96-well plate harvester (Brandel Inc.). The filters were dried at room temperature overnight, and the radioactivity was determined by a TopCount NXT Microplate Scintillation and Luminescence Counter (PerkinElmer Life Sciences).
β-Arrestin2 recruitment assay
The PathHunter β-arrestin assay was performed according to the manufacturer’s protocol (DiscoveRx) and as described previously (28, 37). Briefly, 5000 U2OS-β-arrestin2-EFC-hKOR cells were plated in 384-well white plates with Opti-MEM media (Invitrogen) containing 1% FBS ± pertussis toxin (100 ng/ml) overnight. The next day, cells were treated with compounds for 90 min at 37°C, followed by a 1-hour incubation of detection reagent at room temperature. Luminescence values were determined by using a Synergy HT luminometer (BioTek).
For β-arrestin2-GFP confocal imaging, 5000 U2OS-β-arrestin2-GFP-mKOR cells were split into a 384-well plate with MEM (Invitrogen) supplemented with 10% FBS in 37°C incubator overnight. The cells were then serum-starved in MEM for 30 min, followed by 20-min drug treatment at 37°C, and 30-min 4% paraformaldehyde fixation and Hoechst staining at room temperature. Each condition was duplicated, and one image in each well was acquired by using an Olympus FluoView IX81 confocal microscope (Olympus).
Forskolin-stimulated cAMP accumulation assay
Four thousand cells per well were split into 384-well low-volume plate (VWR) with Opti-MEM (Invitrogen) supplemented with 1% FBS for 3 hours at 37°C except SH-SY5Y-hKOR cells, which were plated for 1 hour at 37°C. Cells were then treated with drugs, 25 μM 4-(3-butoxy-4-methoxybenzyl)imidazolidin-2-one (PDE4 inhibitor), and 20 μM forskolin for 30 min at room temperature.
For membrane-based inhibition of cAMP accumulation assay, membrane preparation was adapted from Allen et al. (70). Briefly, CHO-hKOR cells were incubated in serum-free DMEM/F12 media for 60 min. Cells were then homogenized by a Dounce homogenizer 15 times in an ice-cold buffer [50 mM Hepes (pH 7.4)], followed by centrifugation at 500g at 4°C for 5 min. The supernatant was transferred to a 1.5-ml tube on ice, and the pellet was resuspended, homogenized, and centrifuged at 500g at 4°C for 5 min. Then, the supernatant was combined and spun at 20,000g at 4°C for 10 min. The membrane pellet was resuspended in an ice-cold buffer [50 mM Hepes (pH 7.4)] at concentrations of 2 to 4 μg protein/ul. Membranes were stored at −80°C until use. For forskolin-stimulated cAMP accumulation assay, membranes were diluted in an assay buffer (50 mM Hepes, 10 mM MgCl2, 100 mM NaCl, 200 μM adenosine 5′-triphosphate, 10 μM GTP, 100 μM 3-isobutyl-1-methylxanthine, 20 μM forskolin, and 30 μM bovine serum albumin) and plated at 2 μg of protein in each well. Membranes were treated with test compounds for 30 min at room temperature. The cAMP levels were determined as per the manufacturer’s instructions (Cisbio cAMP HiRange assay).
FLIPR calcium assay
CHO-hKOR cells (15,000 cells per well) were plated in a clear-bottom black 384-well plate (BD Falcon) with DMEM/F12 medium containing 10% FBS with or without pertussis toxin (100 ng/ml) for overnight. The cells were then incubated with 1× HBSS (Hanks’ balanced salt solution)/ 20 mM Hepes at 37°C for 2 hours followed by calcium-sensitive dye loading along with 125 mM probenecid for 1 hour at 37°C. The KOR agonist–induced intracellular calcium mobilization was determined by using a FLIPRTETRA instrument to measure fluorescence intensity [excitation/emission (Ex/Em) = 490 nm/515 nm].
FLIPR potassium assay
CHO-hKOR-hGIRK1/2 cells (12,500 cells per well) were plated in a clear-bottom black 384-well plate (BD Falcon) with complete DMEM/F12 medium overnight. The cells were then incubated with 1× HBSS/20 mM Hepes at 37°C for 2 hours, followed by thallium-sensitive dye loading along with 125 mM probenecid for 1.5 hours at room temperature. The KOR agonist–induced GIRK channel activation was determined by using a FLIPRTETRA instrument to measure fluorescence intensity (Ex/Em = 490 nm/515 nm).
KOR internalization assay
For KOR internalization assays, WT and βarr1/2 KO MEF-hKOR cells were cultured on collagen-coated glass-bottom confocal dishes. Primary striatal neurons were cultured on poly-L-lysine–coated glass-bottom confocal dishes and, at DIV4, were transfected with 3 μg of N-terminal HA-tagged mouse KOR cDNA using calcium phosphate precipitation as described (71), and the assay proceeded at DIV5/6. For both cell types, cells were then serum-starved in phenol red–free MEM (Invitrogen) for 30 min, followed by anti-HA Alexa Fluor 488 antibody staining (1:100) at 37°C for 10 min. Then, images of live cells were taken by using an Olympus FluoView IX81 confocal microscope before and after drug treatment for 20 to 50 min.
Image analysis
NIH ImageJ was applied to analyze the cell number and β-arrestin2-GFP punctum number for the β-arrestin2 recruitment assay using confocal microscopy and to quantify the numbers of internalized KOR puncta in soma area determined according to the differential interference contrast images for KOR internalization assay in primary striatal neurons.
Data analysis and statistics
Data analysis was performed in GraphPad Prism 6 (GraphPad) to produce sigmoidal concentration-response curves by using the standard three-parameter equation. Agonist stimulation was determined and presented by normalizing all values to the top of the maximum response (Emax) produced by U69,593 or by normalizing to vehicle to show the fold over vehicle. The values of half maximal effective concentration (EC50) and Emax for all drugs were obtained from the average of n ≥ 3 from individual experiment and presented as means ± SEM. For receptor internalization assays in primary striatal neurons, the limited number of neurons from each preparation permitted a limited number of KOR agonist concentrations to be tested, along with vehicle, for each experiment. The EC50 and Emax values for KOR internalization in primary striatal neuron were estimated by fitting the averaged data points from each experiment.
For comparison of the results between each cell-based functional assay, each data set was fit to the operational model using GraphPad Prism 6. Specifically, the agonist that produced the greatest maximal response was fit to Eq. 1 (72, 73):
| (1) |
The Emax is the maximal response of the system, Bottom is the baseline level of response, X is the agonist concentration, and n is the transducer slope. The parameter LogR is the transduction coefficient; LogR is a composite parameter that incorporates both the affinity and efficacy of the agonist into single parameter values (48). Except where indicated, U69,593 is used as the reference compound. Other partial agonists were fit to Eq. 2:
| (2) |
The parameter definitions in Eq. 2 are identical to Eq. 1. Two additional parameters are included in Eq. 2: The LogKA is the agonist equilibrium affinity constant and the LogRAiTest is the difference in LogR values between the reference and test agonist. The LogRAiTest value of each test compound was used to produce bias factors by subtracting of each agonist accordingly in two assays to generate as expressed in Eq. 3:
| (3) |
Triazole 1.1 is more efficacious than U69,593 in the [35S]GTPγS binding assays with striatal membrane and the inhibition of cAMP accumulation assays in primary striatal neurons. For this reason, triazole 1.1 was used to determine the maximum response in the system. To produce a complete picture of the effects observed, the bias factor was also produced from nonlinear regression using the three-parameter dose-response equation, as a function of the Emax and EC50, using the equation indicated in Eq. 4:
| (4) |
Statistical tests are noted in the figure legends. Student’s t test indicates an unpaired two-tailed analysis for at least three of independent experiments performed in multiple replicates.
Supplementary Material
Acknowledgments:
We appreciate L. Barak (Duke University) for providing us with the U2OS-β-arrestin2-GFP cell line.
Funding: This work was supported by National Institute on Drug Abuse grant R01DA031297 to L.M.B. and J.A.
Footnotes
Competing interests: The authors declare that they have no competing interests.
Data and materials availability: All data needed to evaluate the conclusions in the paper are present in the paper or the Supplementary Materials.
REFERENCES
- 1.Dykstra LA, Gmerek DE, Winger G, Woods JH, k opioids in rhesus monkeys.Diuresis, sedation, analgesia and discriminative stimulus effects. J. Pharmacol. Exp. Ther 242, 413–420 (1987). [PubMed] [Google Scholar]
- 2.Millan MJ, k-opioid receptor-mediated antinociception in the rat. I. Comparative actions of μ-and κ-opioids against noxious thermal, pressure and electrical stimuli. J. Pharmacol. Exp. Ther 251, 334–341 (1989). [PubMed] [Google Scholar]
- 3.Pasternak GW, Multiple opiate receptors: [3H]ethylketocyclazocine receptor binding and ketocyclazocine analgesia. Proc. Natl. Acad. Sci. U.S.A 77, 3691–3694 (1980). [DOI] [PMC free article] [PubMed] [Google Scholar]
- 4.Pfeiffer A, Brantl V, Herz A, Emrich HM, Psychotomimesis mediated by k opiate receptors. Science 233, 774–776 (1986). [DOI] [PubMed] [Google Scholar]
- 5.González D, Riba J, Bouso JC, Gómez-Jarabo G, Barbanoj MJ, Pattern of use and subjective effects of Salvia divinorum among recreational users. Drug Alcohol Depend 85,157–162 (2006). [DOI] [PubMed] [Google Scholar]
- 6.Knoll AT, Carlezon WA Jr., Dynorphin, stress, and depression. Brain Res 1314, 56–73 (2010). [DOI] [PMC free article] [PubMed] [Google Scholar]
- 7.Cox BM, Recent developments in the study of opioid receptors. Mol. Pharmacol 83, 723–728 (2013). [DOI] [PubMed] [Google Scholar]
- 8.Wu H, Wacker D, Mileni M, Katritch V, Won Han G, Vardy E, Liu W, Thompson AA, Huang X-P, Carroll FI, Mascarella SW, Westkaemper RB, Mosier PD, Roth BL,Cherezov V, Stevens RC, Structure of the human κ-opioid receptor in complex with JDTic. Nature 485, 327–332 (2012). [DOI] [PMC free article] [PubMed] [Google Scholar]
- 9.Tempel A, Zukin RS, Neuroanatomical patterns of the μ, δ, and κ opioid receptors of rat brain as determined by quantitative in vitro autoradiography. Proc. Natl. Acad. Sci. U.S.A 84, (1987). [DOI] [PMC free article] [PubMed] [Google Scholar]
- 10.Mansour A, Khachaturian H, Lewis ME, Akil H, Watson SJ, Anatomy of CNS opioid receptors. Trends Neurosci 11, 308–314 (1988). [DOI] [PubMed] [Google Scholar]
- 11.George SR, Zastawny RL, Briones-Urbina R, Cheng R, Nguyen T, Heiber M, Kouvelas A, Chan AS, O’Dowd BF, Distinct distributions of μ, δ and κ opioid receptor mRNA in rat brain. Biochem Biophys. Res. Commun 15, 1438–1444 (1994). [DOI] [PubMed] [Google Scholar]
- 12.Wang Y.-h., Sun J.-f., Tao Y.-m., Chi Z.-q., Liu J.-q., The role of k-opioid receptor activation in mediating antinociception and addiction. Acta Pharmacol. Sin 31, 1065–1070 (2010). [DOI] [PMC free article] [PubMed] [Google Scholar]
- 13.Vanderah TW, d and k opioid receptors as suitable drug targets for pain. Clin. J. Pain 26, S10–S15 (2010). [DOI] [PubMed] [Google Scholar]
- 14.Meng F, Xie GX, Thompson RC, Mansour A, Goldstein A, Watson SJ, Akil H, Cloning and pharmacological characterization of a rat k opioid receptor. Proc. Natl. Acad. Sci. U.S.A 90, 9954–9958 (1993). [DOI] [PMC free article] [PubMed] [Google Scholar]
- 15.Simonin F, Gavériaux-Ruff C, Befort K, Matthes H, Lannes B, Micheletti G, Mattéi MG, Charron G, Bloch B, Kieffer B, κ-opioid receptor in humans: cDNA and genomic cloning, chromosomal assignment, functional expression, pharmacology, and expression pattern in the central nervous system. Proc. Natl. Acad. Sci. U.S.A 92, 7006–7010 (1995). [DOI] [PMC free article] [PubMed] [Google Scholar]
- 16.Zhu J, Chen C, Xue J-C, Kunapuli S, DeRiel JK, Liu-Chen L-Y, Cloning of a human κ opioid receptor from the brain. Life Sci 56, PL201–PL207 (1995). [DOI] [PubMed] [Google Scholar]
- 17.Hollt V, Opioid peptide processing and receptor selectivity. Annu. Rev. Pharmacol. Toxicol 26, 59–77 (1986). [DOI] [PubMed] [Google Scholar]
- 18.Joh T, Nomiyama H, Maeda S, Shimada K, Morino Y, Cloning and sequence analysis of a cDNA encoding porcine mitochondrial aspartate aminotransferase precursor. Proc. Natl. Acad. Sci. U.S.A 82, 6065–6069 (1985). [DOI] [PMC free article] [PubMed] [Google Scholar]
- 19.Taiwo YO, Levine JD, κ- and δ-opioids block sympathetically dependent hyperalgesia. J. Neurosci 11, 928–932 (1991). [DOI] [PMC free article] [PubMed] [Google Scholar]
- 20.Tseng LF, Collins KA, Pretreatment with pertussis toxin differentially modulates morphine-and β-endorphin-induced antinociception in the mouse. J. Pharmacol. Exp. Ther 279, 39–46 (1996). [PubMed] [Google Scholar]
- 21.Yamada M, Inanobe A, Kurachi Y, G protein regulation of potassium ion channels. Pharmacol. Rev 50, 723–760 (1998). [PubMed] [Google Scholar]
- 22.Sadja R, Alagem N, Reuveny E, Gating of GIRK channels: Details of an intricate, membrane-delimited signaling complex. Neuron 39, 9–12 (2003). [DOI] [PubMed] [Google Scholar]
- 23.Appleyard SM, Celver J, Pineda V, Kovoor A, Wayman GA, Chavkin C, Agonist-dependent desensitization of the κ opioid receptor by G protein receptor kinase and β-arrestin. J. Biol. Chem 274, 23802–23807 (1999). [DOI] [PubMed] [Google Scholar]
- 24.McLaughlin JP, Xu M, Mackie K, Chavkin C, Phosphorylation of a carboxyl-terminal serine within the κ-opioid receptor produces desensitization and internalization. J. Biol. Chem 278, 34631–34640 (2003). [DOI] [PubMed] [Google Scholar]
- 25.Bruchas MR, Macey TA, Lowe JD, Chavkin C, Kappa opioid receptor activation of p38 MAPK is GRK3- and arrestin-dependent in neurons and astrocytes. J. Biol. Chem 281, 18081–18089 (2006). [DOI] [PMC free article] [PubMed] [Google Scholar]
- 26.McDonald PH, Chow C-W, Miller WE, Laporte SA, Field ME, Lin F-T, Davis RJ, Lefkowitz RJ, β-arrestin 2: A receptor-regulated MAPK scaffold for the activation of JNK3. Science 290, 1574–1577 (2000). [DOI] [PubMed] [Google Scholar]
- 27.McLennan GP, Kiss A, Miyatake M, Belcheva MM, Chambers KT, Pozek JJ, Mohabbat Y, Moyer RA, Bohn LM, Coscia CJ, Kappa opioids promote the proliferation of astrocytes via Gγγ and β-arrestin 2-dependent MAPK-mediated pathways. J. Neurochem 107, 1753–1765 (2008). [DOI] [PMC free article] [PubMed] [Google Scholar]
- 28.Schmid CL, Streicher JM, Groer CE, Munro TA, Zhou L, Bohn LM, Functional selectivity of 6′-guanidinonaltrindole (6′-GNTI) at κ-opioid receptors in striatal neurons. J. Biol. Chem 288, 22387–22398 (2013). [DOI] [PMC free article] [PubMed] [Google Scholar]
- 29.Gesty-Palmer D, Chen M, Reiter E, Ahn S, Nelson CD, Wang S, Eckhardt AE, Cowan CL, Spurney RF, Luttrell LM, Lefkowitz RJ, Distinct β-arrestin- and G protein-dependent pathways for parathyroid hormone receptor-stimulated ERK1/2 activation. J. Biol. Chem 281, 10856–10864 (2006). [DOI] [PubMed] [Google Scholar]
- 30.Kenakin T, Ligand-selective receptor conformations revisited: The promise and the problem. Trends Pharmacol. Sci 24, 346–354 (2003). [DOI] [PubMed] [Google Scholar]
- 31.Perez DM, Karnik SS, Multiple signaling states of G-protein-coupled receptors. Pharmacol. Rev 57, 147–161 (2005). [DOI] [PubMed] [Google Scholar]
- 32.Leach K, Sexton PM, Christopoulos A, Allosteric GPCR modulators: Taking advantage of permissive receptor pharmacology. Trends Pharmacol. Sci 28, 382–389 (2007). [DOI] [PubMed] [Google Scholar]
- 33.Mailman RB, GPCR functional selectivity has therapeutic impact. Trends Pharmacol. Sci 28, 390–396 (2007). [DOI] [PMC free article] [PubMed] [Google Scholar]
- 34.Kenakin T, Miller LJ, Seven transmembrane receptors as shapeshifting proteins: The impact of allosteric modulation and functional selectivity on new drug discovery. Pharmacol. Rev 62, 265–304 (2010). [DOI] [PMC free article] [PubMed] [Google Scholar]
- 35.Urban JD, Clarke WP, von Zastrow M, Nichols DE, Kobilka B, Weinstein H, Javitch JA, Roth BL, Christopoulos A, Sexton PM, Miller KJ, Spedding M, Mailman RB, Functional selectivity and classical concepts of quantitative pharmacology. J. Pharmacol. Exp. Ther 320, 1–13 (2007). [DOI] [PubMed] [Google Scholar]
- 36.Rives M-L, Rossillo M, Liu-Chen L-Y, Javitch JA, 6′-Guanidinonaltrindole (6′-GNTI) is a G protein-biased κ-opioid receptor agonist that inhibits arrestin recruitment. J. Biol. Chem 287, 27050–27054 (2012). [DOI] [PMC free article] [PubMed] [Google Scholar]
- 37.Zhou L, Lovell KM, Frankowski KJ, Slauson SR, Phillips AM, Streicher JM, Stahl E, Schmid CL, Hodder P, Madoux F, Cameron MD, Prisinzano TE, Aubé J, Bohn LM, Development of functionally selective, small molecule agonists at kappa opioid receptors. J. Biol. Chem 288, 36703–36716 (2013). [DOI] [PMC free article] [PubMed] [Google Scholar]
- 38.White KL, Elliott Robinson J, Zhu H, DiBerto JF, Polepally PR, Zjawiony JK, Nichols DE, Malanga CJ, Roth BL, The G protein–biased κ-opioid receptor agonist RB-64 Is analgesic with a unique spectrum of activities In vivo. J. Pharmacol. Exp. Ther 352, 98–109 (2015). [DOI] [PMC free article] [PubMed] [Google Scholar]
- 39.Spetea M, Eans SO, Ganno ML, Lantero A, Mairegger M, Toll L, Schmidhammer H, McLaughlin JP, Selective κ receptor partial agonist HS666 produces potent antinociception without inducing aversion after i.c.v. administration in mice. Br. J. Pharmacol 174, 2444–2456 (2017). [DOI] [PMC free article] [PubMed] [Google Scholar]
- 40.Morgenweck J, Frankowski KJ, Prisinzano TE, Aubé J, Bohn LM, Investigation of the role of βarrestin2 in kappa opioid receptor modulation in a mouse model of pruritus. Neuropharmacology 99, 600–609 (2015). [DOI] [PMC free article] [PubMed] [Google Scholar]
- 41.Brust TF, Morgenweck J, Kim SA, Rose JH, Locke JL, Schmid CL, Zhou L, Stahl EL, Cameron MD, Scarry SM, Aubé J, Jones SR, Martin TJ, Bohn LM, Biased agonists of the kappa opioid receptor suppress pain and itch without causing sedation or dysphoria. Sci. Signal 9, ra117 (2016). [DOI] [PMC free article] [PubMed] [Google Scholar]
- 42.Zangrandi L, Burtscher J, MacKay JP, Colmers WF, Schwarzer C, The G-protein biased partial k opioid receptor agonist 6′-GNTI blocks hippocampal paroxysmal discharges without inducing aversion. Br. J. Pharmacol 173, 1756–1767 (2016). [DOI] [PMC free article] [PubMed] [Google Scholar]
- 43.Di Chiara G, Imperato A, Opposite effects of mu and kappa opiate agonists on dopamine release in the nucleus accumbens and in the dorsal caudate of freely moving rats. J. Pharmacol. Exp. Ther 244, 1067–1080 (1988). [PubMed] [Google Scholar]
- 44.Mulder AH, Wardeh G, Hogenboom F, Frankhuyzen AL, κ and δ-opioid receptor agonists differentially inhibit striatal dopamine and acetylcholine release. Nature 308, 278–280 (1984). [DOI] [PubMed] [Google Scholar]
- 45.Mulder AH, Wardeh G, Hogenboom F, Frankhuyzen AL, Selectivity of various opioid peptides towards delta-, kappa; and MU-opioid receptors mediating presynaptic inhibition of neurotransmitter release in the brain. Neuropeptides 14, 99–104 (1989). [DOI] [PubMed] [Google Scholar]
- 46.Werling LL, Frattali A, Portoghese PS, Takemori AE, Cox BM, Kappa receptor regulation of dopamine release from striatum and cortex of rats and guinea pigs. J. Pharmacol. Exp. Ther 246, 282–286 (1988). [PubMed] [Google Scholar]
- 47.Gauchy C, Desban M, Krebs MO, Glowinski J, Kemel ML, Role of dynorphin-containing neurons in the presynaptic inhibitory control of the acetylcholine-evoked release of dopamine in the striosomes and the matrix of the cat caudate nucleus. Neuroscience 41, 449–458 (1991). [DOI] [PubMed] [Google Scholar]
- 48.Black JW, Leff P, Operational models of pharmacological agonism. Proc. R. Soc. Lond. B Biol. Sci 220, 141–162 (1983). [DOI] [PubMed] [Google Scholar]
- 49.Berman DM, Wilkie TM, Gilman AG, GAIP and RGS4 are GTPase-activating proteins for the G i subfamily of G protein a subunits. Cell 86, 445–452 (1996). [DOI] [PubMed] [Google Scholar]
- 50.Tesmer JJG, Berman DM, Gilman AG, Sprang SR, Structure of RGS4 bound to AlF4−-activated Giα1: Stabilization of the transition state for GTP hydrolysis. Cell 89, 251–261 (1997). [DOI] [PubMed] [Google Scholar]
- 51.Rahman Z, Gold SJ, Potenza MN, Cowan CW, Ni YG, He W, Wensel TG, Nestler EJ, Cloning and characterization of RGS9–2: A striatal-enriched alternatively spliced product of the RGS9 gene. J. Neurosci 19, 2016–2026 (1999). [DOI] [PMC free article] [PubMed] [Google Scholar]
- 52.López-Aranda MF, Acevedo MJ, Carballo FJ, Gutiérrez A, Khan ZU, Localization of the GoLoco motif carrier regulator of G-protein signalling 12 and 14 proteins in monkey and rat brain. Eur. J. Neurosci 23, 2971–2982 (2006). [DOI] [PubMed] [Google Scholar]
- 53.Snow BE, Antonio L, Suggs S, Gutstein HB, Siderovski DP, Molecular cloning and expression analysis of RatRgs12andRgs14. Biochem. Biophys. Res. Commun 233, 770–777 (1997). [DOI] [PubMed] [Google Scholar]
- 54.Li J-G, Luo L-Y, Krupnick JG, Benovic JL, Liu-Chen L-Y, U50, 488H-induced internalization of the human k opioid receptor involves a β-arrestin- and dynamin-dependent mechanism. k receptor internalization is not required for mitogen-activated protein kinase activation. J. Biol. Chem 274, 12087–12094 (1999). [DOI] [PubMed] [Google Scholar]
- 55.Matsuoka I, Suzuki Y, Defer N, Nakanishi H, Hanoune J, Differential expression of type I, II, and V adenylyl cyclase gene in the postnatal developing rat brain. J. Neurochem 68, 498–506 (1997). [DOI] [PubMed] [Google Scholar]
- 56.Bruss MD, Richter W, Horner K, Jin S-LC, Conti M, Critical role of PDE4D in β2-adrenoceptor-dependent cAMP signaling in mouse embryonic fibroblasts. J. Biol. Chem 283, 22430–22442 (2008). [DOI] [PMC free article] [PubMed] [Google Scholar]
- 57.Allen RA, Merriman MW, Perry MJ, Owens RJ, Development of a recombinant cell-based system for the characterisation of phosphodiesterase 4 isoforms and evaluation of inhibitors. Biochem. Pharmacol 57, 1375–1382 (1999). [DOI] [PubMed] [Google Scholar]
- 58.Coskran TM, Morton D, Menniti FS, Adamowicz WO, Kleiman RJ, Ryan AM, Strick CA, Schmidt CJ, Stephenson DT, Immunohistochemical localization of phosphodiesterase 10A in multiple mammalian species. J. Histochem. Cytochem 54, 1205–1213 (2006). [DOI] [PubMed] [Google Scholar]
- 59.Fidock M, Miller M, Lanfear J, Isolation and differential tissue distribution of two human cDNAs encoding PDE1 splice variants. Cell. Signal 14, 53–60 (2002). [DOI] [PubMed] [Google Scholar]
- 60.Polli JW, Kincaid RL, Expression of a calmodulin-dependent phosphodiesterase isoform (PDE1B1) correlates with brain regions having extensive dopaminergic innervation. J. Neurosci 14, 1251–1261 (1994). [DOI] [PMC free article] [PubMed] [Google Scholar]
- 61.Jamshidi RJ, Jacobs BA, Sullivan LC, Chavera TA, Saylor RM, Prisinzano TE, Clarke WP, Berg KA, Functional selectivity of kappa opioid receptor agonists in peripheral sensory neurons. J. Pharmacol. Exp. Ther 355, 174–182 (2015). [DOI] [PMC free article] [PubMed] [Google Scholar]
- 62.Schattauer SS, Kuhar JR, Song A, Chavkin C, Nalfurafine is a G-protein biased agonist having significantly greater bias at the human than rodent form of the kappa opioid receptor. Cell. Signal 32, 59–65 (2017). [DOI] [PMC free article] [PubMed] [Google Scholar]
- 63.Lovell KM, Frankowski KJ, Stahl EL, Slauson SR, Yoo E, Prisinzano TE, Aubé J, Bohn LM, Structure–activity relationship studies of functionally selective kappa opioid receptor agonists that modulate ERK 1/2 phosphorylation while preserving G protein over β-arrestin2 signaling bias. ACS Chem. Neurosci 6, 1411–1419 (2015). [DOI] [PMC free article] [PubMed] [Google Scholar]
- 64.Mizoguchi H, Leitermann RJ, Narita M, Nagase H, Suzuki T, Tseng LF, Region-dependent G-protein activation by κ-opioid receptor agonists in the mouse brain. Neurosci. Lett 356, 145–147 (2004). [DOI] [PubMed] [Google Scholar]
- 65.Seki T, Awamura S, Kimura C, Ide S, Sakano K, Minami M, Nagase H, Satoh M, Pharmacological properties of TRK-820 on cloned μ-, δ-and κ-opioid receptors and nociceptin receptor. Eur. J. Pharmacol 376, 159–167 (1999). [DOI] [PubMed] [Google Scholar]
- 66.Szymczak AL, Vignali DAA, Development of 2A peptide-based strategies in the design of multicistronic vectors. Expert. Opin. Biol. Ther 5, 627–638 (2005). [DOI] [PubMed] [Google Scholar]
- 67.Kim JH, Lee S-R, Li L-H, Park H-J, Park J-H, Youl Lee K, Kim M-K, Ahn Shin B, Choi S-Y, High cleavage efficiency of a 2A peptide derived from porcine teschovirus-1 in human cell lines, zebrafish and mice. PLOS ONE 6, e18556 (2011). [DOI] [PMC free article] [PubMed] [Google Scholar]
- 68.Mennerick S, Que J, Benz A, Zorumski CF, Passive and synaptic properties of hippocampal neurons grown in microcultures and in mass cultures. J. Neurophysiol 73, 320–332 (1995). [DOI] [PubMed] [Google Scholar]
- 69.Bohn LM, Zhou L, Ho J-H, Approaches to assess functional selectivity in GPCRs: Evaluating G protein signaling in an endogenous environment. Methods Mol. Biol 1335, 177–189 (2015). [DOI] [PMC free article] [PubMed] [Google Scholar]
- 70.Allen M, Hall D, Collins B, Moore K, A homogeneous high throughput nonradioactive method for measurement of functional activity of Gs-coupled receptors in membranes. J. Biomol. Screen 7, 35–44 (2002). [DOI] [PubMed] [Google Scholar]
- 71.Jiang M, Deng L, Chen G, High Ca2+-phosphate transfection efficiency enables single neuron gene analysis. Gene Ther 11, 1303–1311 (2004). [DOI] [PubMed] [Google Scholar]
- 72.Kenakin T, Christopoulos A, Signalling bias in new drug discovery: Detection, quantification and therapeutic impact. Nat. Rev. Drug Discov 12, 205–216 (2013). [DOI] [PubMed] [Google Scholar]
- 73.Griffin MT, Figueroa KW, Liller S, Ehlert FJ, Estimation of agonist activity at G protein-coupled receptors: Analysis of M2 muscarinic receptor signaling through Gi/o, Gs, and G15. J. Pharmacol. Exp. Ther 321, 1193–1207 (2007). [DOI] [PubMed] [Google Scholar]
Associated Data
This section collects any data citations, data availability statements, or supplementary materials included in this article.