Abstract
Background:
The prognostic value of tenascin-C in different types of cancers remains controversial. To clarify its prognostic value on overall survival rates, we have conducted a meta-analysis to quantitatively assess the prognostic roles of tenascin-C for patients with cancer.
Methods:
We systematically searched all published studies about the role of tenascin-C in cancers on PubMed, Web of Science, Cochrane Library, and Embase. The pooled hazard ratio with 95% confidence intervals was used to analyze the association between tenascin-C expression level and overall survival of patients with cancer. The pooled odds ratio with 95% confidence intervals was used to investigate the association between tenascin-C expression level and clinicopathologic features of patients with cancer. Trial sequential analysis was performed to obtain the required information size.
Results:
In this meta-analysis, 18 studies including 2732 patients were incorporated. The pooled hazard ratio of 18 trials was 1.73 (95% confidence interval: 1.29-2.32, P < .001) for overall survival, suggesting that elevated tenascin-C expression strongly predicted poor prognosis among patients with various cancers. Simultaneously, elevated tenascin-C expression was also significantly associated with lymph node metastasis (odds ratio = 2.42, 95% confidence interval: 1.79-3.26, P < .001). However, no significant correlation was observed between the tenascin-C expression and distant metastasis (odds ratio = 1.72, 95% confidence interval: 0.86-3.44, P = .127).
Conclusions:
Tenascin-C is considered as a promising unfavorable prognostic factor in human cancers. Likewise, tenascin-C can be used as a monitoring indicator for poor prognosis in a wide range of cancers.
Keywords: tenascin-C, cancer, prognosis, overall survival, clinicopathological features, monitor, meta-analysis
Introduction
In economically developed countries, cancer leads to a heavy burden on the society. In 2017, 1 688 780 new cancer cases and 600 920 cancer deaths are projected to occur in the United States.1 Moreover, Bray et al predicted an increase in the incidence of all-cancer cases from 12.7 million new cases in 2008 to 22.2 million by 2030.2 Hence, targeted interventions should be taken to reduce this number through resource dependent interventions. Although there have been significant improvements in diagnostic and therapeutic techniques for cancer, the prognosis of patients still remains poor. More and more scientists are committed to finding new effective biomarkers for the early diagnosis of cancer and to predicting the progression and prognosis of patients with cancer.
Tenascin-C (TN-C) is a hexametric glycoprotein that each subunit consists of an assembly domain (AD), epidermal growth factor-like repeats, a variable number of fibronectin type III repeats containing alternative spliced domains and the C-terminal fibrinogen globe3 (Figure 1). Tenascin-C is a glycoprotein of the extracellular matrix (ECM), whose intricate link to cancer has been recognized since its discovery in the mid-1980s.4 Recent studies have reported that aberrant expressions of TN-C were found in different types of cancers, such as lung cancer,5 prostate cancer,6 colorectal carcinomas,7 breast carcinoma,8 posterior fossa ependymoma,9 clear cell renal cell carcinoma,10 esophageal squamous cell carcinoma,11 supratentorial ependymomas,9 tongue cancer,12 bladder cancer,13 pancreatic cancer.14 Most studies revealed that TN-C played a key role in carcinogenesis and its high expression was associated with poor prognosis in a variety of malignant tumors.5,11,15 But a recent study reported that high expression of TN-C related to favorable prognosis of patients in supratentorial ependymoma.9 Because inconsistent evidence and none of published meta-analysis revealed the association of TN-C expression level and prognosis of patients with cancer, these results were still controversial. Therefore, this meta-analysis was performed to further determine whether high expression of TN-C can be served as a novel indicator for the prognosis of patients with cancer.
Figure 1.
Structural schematic diagram of tenascin-C monomer. Below the structure are the domains: AD, assembly domain; EGF-like repeats, epidermal growth factor-like repeats; FN III, fibronectin type III homology repeats; FBG, the C-terminal fibrinogen globe.
Materials and Methods
Study Strategy
The present review was based on a standard guideline for meta-analysis and systematic review of the studies of tumor markers in respect to prognosis.16 In order to get the relevant articles in this review, 2 authors independently used the following research tools: PubMed, Web of Science, Cochrane Library, and Embase to identify all relevant articles about TN-C as a prognostic factor for survival of patients in different types of cancers. The time frame of the literature search was from October 01, 1980 to October 01, 2017. The search strategy using both MeSH terms and text words was to enhance the sensitivity of the search. The core search comprised terms (“Tenascin-C” or “TN-C”) AND (“cancer” or “carcinoma” or “tumor” or “adenocarcinoma” or “neoplasm”) AND (“prognosis” or “prognostic” or “outcome” or “mortality” or “survival” or “recurrence”). We also used the reference lists of key articles published in English to search manually.
Study Selection
Eligible studies must conform to the following criterions: (1) immunohistochemistry (IHC) or enzyme-linked immunosorbent assay (ELISA) was used to assess TN-C expression; (2) the study provided data on tumor differentiation, distant metastasis (DM), lymph node metastasis (LNM), and tumor-node-metastasis stages; (3) hazard ratios (HRs) and their 95% confidence intervals (CIs) were directly extracted or synthesized; (4) the article language is limited to English. The following exclusion criteria were used: (1) letters, editorials, expert opinions, reviews, and case reports; (2) articles based on cancer cells or animal models but not based on patients.
Data Extraction and Quality Assessment
Two researchers conducted an independent study of all literature searches to identify qualified studies and to extract data from the studies. The data extracted for each study were as follows: (1) general data including primary author, age and gender of the study patients, sample size, and survival month; (2) clinicopathological characteristics including DM and LNM; (3) data for overall survival (OS) or disease-free survival; (5) cutoff value; (6) survival curves. If the only available data were in the form of the survival curves, the Kaplan-Meier curves were read using an Engauge Digitizer version 4.1 (free software down-loaded from http://sourceforge.net) and we extracted the survival rates to calculate the HR and 95% CI.17 The deviations related to risk assessment from 2 independent researchers were based on PRISMA recommendations.18 Any potential discrepancies and quality assessment between the authors (X.M. and S.Q.) were resolved through discussion with a third reviewer (J.T.). The Newcastle-Ottawa Scale (NOS) method was applied to evaluate the quality of included studies (Supplemental material table 3).19 The NOS score ranged from 0 to 9 and a study by the NOS score over 7 was accounted the high quality.
Statistical Analysis
Meta-analysis was carried out using STATA statistical software package version 12.0 (STATA Corp, College Station, Texas). Pooled HRs and corresponding 95% CIs were calculated to evaluate the impact of TN-C expression on OS. The χ2-based Q test and I 2 test were used to evaluate the heterogeneity across the studies. Random effect model was used for meta-analysis if there was significant heterogeneity (P ≤ .05, I 2 ≥ 50%), otherwise, fixed effect model was used. Besides, subgroup analysis was performed to explore the sources of heterogeneity. Meanwhile, we used funnel plots and Begg’s bias test to analyze the publication bias in this study.20
Trial Sequential Analysis
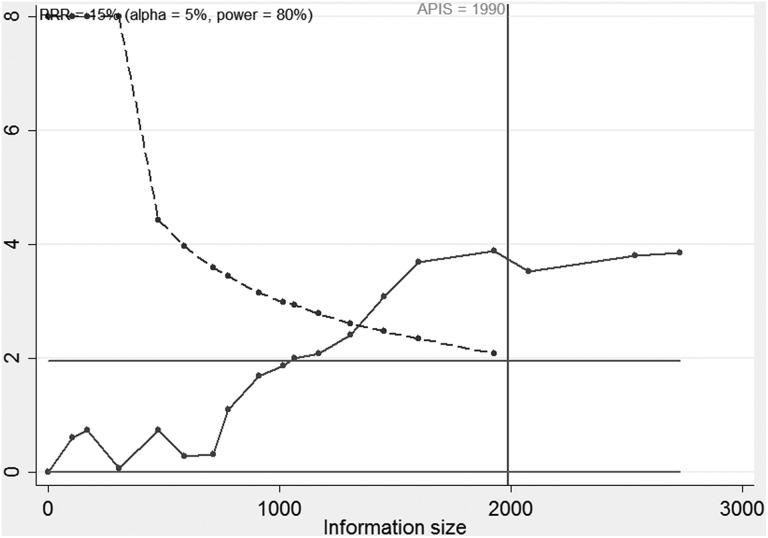
The meta-analyses and systematic reviews are regarded as the best available evidence if all qualified studies are covered. However, “the best available evidence” might not be considered equivalent to “sufficient evidence.” In our studies, the trial sequential analysis (TSA) was carried out to assess the robustness of the current conclusions.21 The O’Brien-Fleming α-spending–function and a priori information size (APIS) are adopted to estimate the required information size (RIS). We defined the sufficient power as the RIS for 80% power, 5% type 1 error, relative risk reduction of 15%, and average survival rates of 40%.21 According to the required power and risk for type I and type II errors, TSA monitoring boundaries were built. If a TSA monitoring boundary is crossed with Z-curve before the required power is reached, further trials are unnecessary. Otherwise, it is necessary to continue performing trials.
Results
Study Characteristics
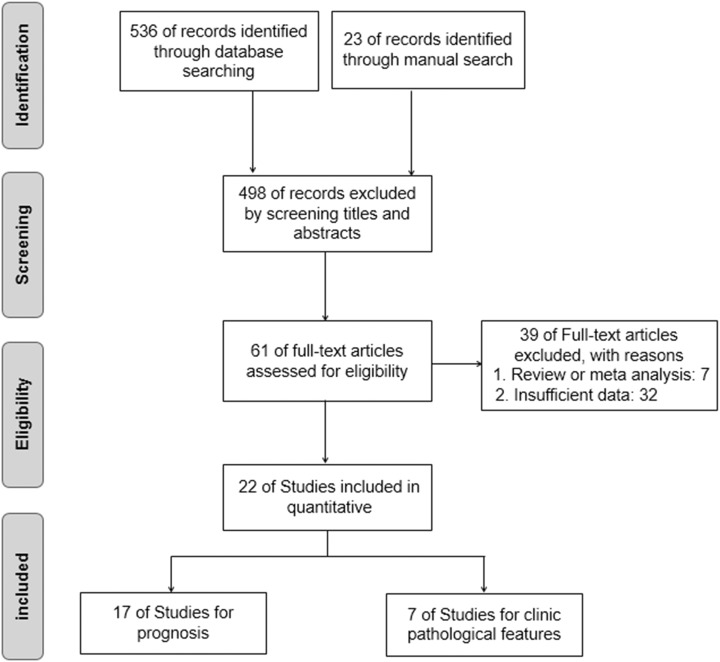
As shown in Figure 2, the initial search yielded 536 studies. After reviewing the titles and abstracts, 61 full-text articles were assessed for eligibility. Due to the absence of sample size of different groups, the CI for the HR or survival curves in some studies, 17 articles were ultimately accepted in the current meta-analysis.5-15,22-27 In these included articles, there were 5 studies from Japan, 7 studies from Europe, and 6 studies from China. Reference 9 which was included 2 times contains 2 separate studies, one is posterior fossa ependymomas and the other is supratentorial ependymoma. Thus, Table 1 summarized the main characteristics of the included 18 studies. The association between TN-C expression level and OS was explored in all studies.5-15,22-27 In these included studies, the level of TN-C expression was determined in the collected tumor tissue, serum, or urine. Meanwhile, 7 of the 18 studies showed that TN-C expression level was associated with LNM6,7,11,22,24-26 and 4 studies indicated that TN-C expression level was related to DM.14,26
Figure 2.
Flow diagram of the study search and selection process.
Table 1.
Characteristics of Included Studies.
| Study ID | Country | Tumor Type | Total Number | Sample Type | Method | Cutoff | Survival Analysis | Metastasis Analysis | Analysis Type | NOS |
|---|---|---|---|---|---|---|---|---|---|---|
| Ni et al 6 | China | Prostate cancer | 145 | Tissue | IHC | IHC score ≥ 2 | OS | LNM | Multivariate | 9 |
| Yang et al 22 | China | Breast ductal carcinoma | 150 | Tissue | IHC | IHC score ≥ 2 | OS | LNM | Multivariate | 9 |
| Ishiwata et al 27 | Japan | Nonsmall cell lung cancer | 63 | Serum | ELISA | Mean | OS | NR | Kaplan-Meier | 6 |
| Takahashi et al 7 | Japan | Colorectal carcinoma | 170 | Tissue | IHC | NR | OS/DFS | DM/LNM | Kaplan-Meier | 8 |
| Arak et al 23 | Austria | Posterior fossa, ependymoma | 52 | Tissue | IHC | NR | OS | NR | Multivariate | 7 |
| Tastekin et al 8 | Turkey | Breast cancer | 126 | Serum | ELISA | Mean | OS | NR | Multivariate | 6 |
| Ohno et al 10 | Japan | Clear cell renal cell carcinoma | 137 | Tissue | IHC | IHC ≥ 10% | OS | NR | Kaplan-Meier | 8 |
| Florian et al 24 | Germany | Nonsmall cell lung cancer | 103 | Serum | ELISA | mean | OS | LNM | Multivariate | 7 |
| Yang et al 25 | China | Esophageal squamous cell carcinoma | 136 | Tissue | IHC | IHC score ≥ 2 | OS/DFS | LNM | Multivariate | 8 |
| Andreiuolo et al 9 | France | Posterior fossa ependymomas | 330 | Tissue | IHC | IHC score ≥ 2 | OS | NR | Multivariate | 8 |
| Andreiuolo et al 9 | France | Supratentorial ependymoma | 148 | Tissue | IHC | IHC score ≥ 3 | OS | NR | Multivariate | 7 |
| Gocheva et al 15 | England | Lung adenocarcinoma | 458 | Tissue | IHC | NR | OS | NR | Kaplan-Meier | 7 |
| Sundquist et al 12 | Finland | Early stage tongue cancer | 196 | Tissue | IHC | IHC score ≥ 1 | OS | NR | Multivariate | 7 |
| Ohtsuka et al 11 | Japan | Esophageal squamous cell carcinoma | 111 | Tissue | IHC | NR | OS | DM/LNM | Kaplan-Meier | 8 |
| Guan et al 13 | China | Bladder cancer | 66 | Urine | ELISA | Mean | OS | NR | Multivariate | 5 |
| Tang et al 5 | China | Lung cancer | 133 | Tissue | IHC | IHC ≥ 10% | OS | NR | Kaplan-Meier | 6 |
| Xu et al 14 | China | Pancreatic cancer | 103 | Tissue | IHC | IHC score ≥ 2 | OS | DM | Kaplan-Meier | 7 |
| Emoto et al 26 | Japan | Colorectal carcinoma | 105 | Tissue | IHC | IHC score ≥ 3 | OS | DM/LNM | Kaplan-Meier | 7 |
Abbreviations: DFS, disease-free survival; DM, distant metastasis; ELISA, enzyme-linked immunosorbent assay; IHC, immunohistochemistry; LNM, lymph node metastasis; NR, not reported; NOS, Newcastle-Ottawa Scale; OS, overall survival.
Increased TN-C Expression Level and OS
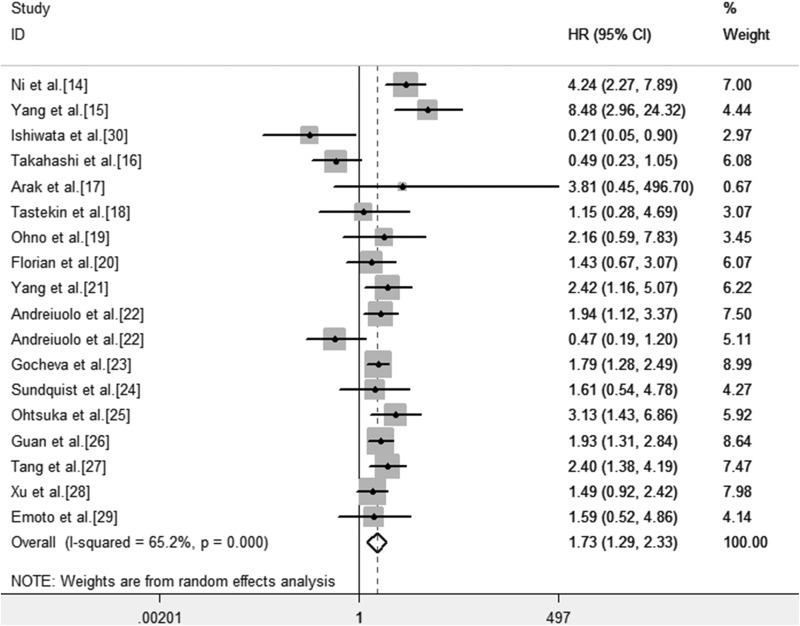
As indicated in Figure 3, the result was heterogenous indeed (I 2 = 65.2%, P < .001). Therefore, the random effects model was adopted to estimate the pooled HR as well as the corresponding 95% CI. The HR, expressed as the high TN-C expression group versus the low TN-C expression group in various carcinomas was 1.73 (95% CI: 1.29-2.32, P < .001). It indicated that the expression of TN-C at high levels was bound up with poor OS.
Figure 3.
Forest plot for the association between TN-C expression level with OS. CI indicates confidence interval; HR, hazard ratios; OS, overall survival; TN-C, tenascin-C.
Thereafter, the analysis was stratified by factors of sample type, sample size, region of participants, and clinicopathological features (LNM and DM) to analyze possible sources of heterogeneity. We showed the pooled HR for OS based on different types of tumor sample and region (Table 2). The high expression of TN-C in serum by ELISA was of no significance (HR = 0.77, 95% CI: 0.24-2.41, P = .651). It is possible that the structure of TN-C monomer is easily degraded in the serum. And it was observed that a significant disparity between the subgroup in Asia (I 2 = 46.8%, P = .043) and the subgroup in Europe (I 2 = .00%, P = .699) did exist. Compared to similar research subgroups in Europe, Asian researches had relatively high heterogeneity and a wider range of CIs, suggesting that the quality of Asian research needs to be further strengthened. Depending on subgroup analysis of this study, the impact of tumor sample types and regional factors on heterogeneity is more obvious. The reason for heterogeneity may be that the detection rates of positive results are obviously altered under different types of tumor sample. Additionally, the demographic characteristics (such as race, etc) of patients investigated in different regions are inconsistent and the conditions and level of scientific research varied widely in different regions.
Table 2.
Subgroup Analysis of the Pooled HRs of Overall Survival With TN-C Expression in Patients With Cancer.
| Subgroup Analysis | Studies (n) | Number of Patients | HR (95% CI) | Q Value | Heterogeneity | ||
|---|---|---|---|---|---|---|---|
| I 2 (%) | P | τ2 | |||||
| Sample type | |||||||
| Tissue | 14 | 2374 | 1.92 (1.33, 2.78) | 16.72 | 22.20 | .213 | 0.1085 |
| Serum | 3 | 292 | 0.77 (0.24, 2.41) | 3.47 | 42.40 | .176 | 0.4370 |
| Residence region | |||||||
| Asian | 11 | 1319 | 1.90 (1.15, 3.13) | 18.79 | 46.80 | .043 | 0.3273 |
| European | 7 | 1413 | 1.49 (1.06, 2.09) | 3.83 | 0.00 | .699 | 0.0000 |
| Clinicopathological features | |||||||
| LNM | 7 | 920 | 2.42 (1.79,3.26) | 9.27 | 35.30 | .159 | 0.0960 |
| DM | 4 | 489 | 1.72 (0.86,3.44) | 1.59 | 0.00 | .662 | 0.0000 |
| Sample size | |||||||
| <115 | 7 | 603 | 0.53 (0.28, 0.78) | 11.48 | 47.80 | .075 | 0.0000 |
| >115 | 11 | 2129 | 0.64 (0.44, 0.83) | 36.91 | 72.90 | .000 | 0.0000 |
Abbreviations: CI, confidence interval; DM, distant metastasis; HR, hazard ratios; LNM, lymph node metastasis; OS, overall survival; TN-C, tenascin-C.
Association Between TN-C Expression and Clinicopathological Features
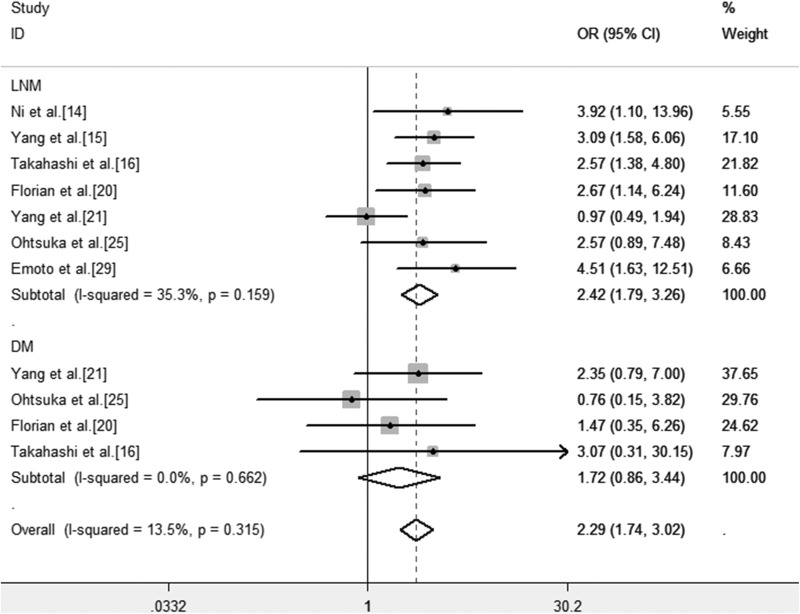
The association between TN-C expression and clinicopathological features in different types of cancers was assessed. We found that the TN-C expression level was significantly associated with lymph node metastasis (OR = 2.42, 95% CI: 1.79-3.26, P < .001; Figure 4). However, no significant correlation was observed between TN-C expression level and DM (OR = 1.72, 95% CI: 0.86-3.44, P = .127).
Figure 4.
Forest plots of OR for the association between TN-C expression level and clinicopathological features in patients with cancer. Note: Weights are from fixed effects analysis. CI indicates confidence interval; DM, distant metastasis; LNM, lymph node metastases; OR, odds ratios; TN-C, tenascin-C.
Sensitivity Analysis and Publication Bias
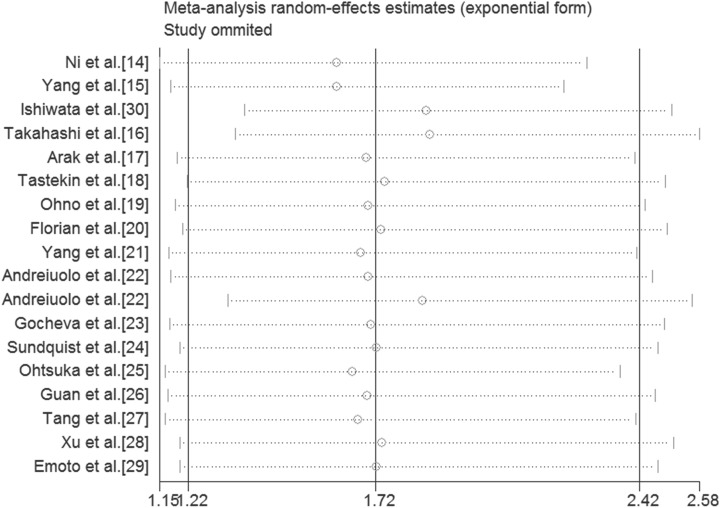
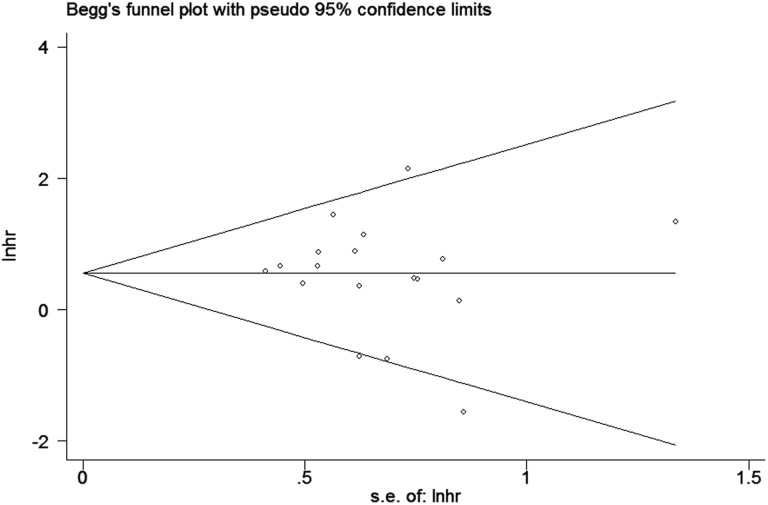
For conducting the meta-analysis of the relation between TN-C expression level and OS, we removed each study in turn from the pooled analysis to perform the sensitivity analysis, which was intended to assess the impact of the deleted data set on the overall HR. It turned out that individual study had little effect on our final results (Figure 5), indicating that our analysis was relatively stable and trustworthy. Furthermore, we evaluated the publication bias by funnel plot and Begg bias test. The shape of funnel was relatively symmetrical (Figure 6), and the P value of the Begg test was .606 for OS of all selected studies, demonstrating that there was no significant publication bias in the meta-analysis.
Figure 5.
Sensitivity analyses of studies concerning TN-C and OS. OS indicates overall survival; TN-C, tenascin-C.
Figure 6.
Funnel plot for TN-C expression level and OS in patients with cancers. OS indicates overall survival; TN-C, tenascin-C.
Trial Sequential Analysis
Eighteen trials (2732 patients) were used to investigate the relevance of TN-C expression level with the prognosis of patients with cancer. Therefore, we performed TSA and found that the APIS was 1990 patients (Figure 7). Figure 7 demonstrated that the cumulative Z-curve surpassed the conventional boundary and the TSA boundary based on APIS before reaching APIS, which indicated that the cumulative evidence was sufficient and the above results between TN-C expression level and OS were conclusive.
Figure 7.
Trial sequential analysis of all included studies. APIS indicates a priori information size; RRR, relative risk reduction.
Discussion
As the earliest discovered protein and the most important member of the tenascin gene family, TN-C is attracting increasing attention. Current evidence shows that TN-C plays a role in the pathogenesis of various cancers. Therefore, it is important and necessary to combine these published data through meta-analysis and evaluate the association between expression of TN-C and prognosis as well as clinicopathological characteristics in patients with cancer. In this research, 2732 patients were incorporated. Its results indicated that high expression of TN-C was relevant to poor prognosis in 14 types of cancer and provided sufficient evidence for the association between TN-C expression and clinicopathological features of various cancers. The analysis showed a pooled HR was 1.73 (95% CI: 1.29-2.32, P < .001) for OS, and a pooled OR was 2.42 (95% CI: 1.79-3.26, P < .001), and 1.72 (95% CI: 0.86-3.44, P = .127) for LNM and DM, respectively. Besides, subgroup analysis was used to investigate the association between HRs and these variables, such as sample type, sample size, region of participants, and clinicopathological features (LNM and DM), these factors are sources of heterogeneity. From the perspective of τ2 that reflects the heterogeneity between studies, the impact of tumor sample types and regional factors on heterogeneity is more obvious. Then we found that high expression of TN-C in cancer was significantly correlated with clinicopathological variables including LNM and DM. As a result, these findings indicated that TN-C may be a hopeful prognostic biomarker to predict patients’ survival in different types of cancers. Through the TSA, the result of the cumulative z-curve showed the cumulative evidence was sufficient and this meta-analysis was convincing.
Potential mechanism can be inferred from research results. Abundant TN-C could not only affect cell adhesion and migration but also influence the expression of tumor suppressor genes, oncogenes, and genes involved in the maintenance of genomic stability capable of influencing cancer growth.28,29 Tenascin-C could mediate loss of intercellular adhesion,30 through which it enhanced migration and metastasis of tumor cells. There were various molecular mechanisms affecting both the structure of ECM and functions of cancer cells. The ECM is increasingly recognized as a major player in cancer progression and metastasis, providing important regulatory cues for cellular responses.31 The cellular movement can be controlled by ECM networks that are rich with TN-C, which enhances migration and metastatic progression of tumor cells.32,33 They might interact with each other to form synergies for the association of high expression of TN-C with poor cancer prognosis.
Some of the previous studies had found that TN-C expression was obviously upregulated comparing with adjacent normal lung tissues in nonsmall cell lung carcinoma and the highest TN-C expression could be observed in the recurrent patients with nonsmall cell lung carcinoma.34 Saupe et al demonstrated that TN-C promoted tumor cell survival, proliferation, invasion, and metastasis by establishing a kind of tumor mouse model that imitated the high expression of TN-C detected in human cancer.33 Furthermore, Juhasz A et al detected that expression of TN-C in laryngeal and hypo pharyngeal cancers was linked to early metastatic recurrence and poor OS,35 which were related to tumor patient’s prognosis and clinicopathological features. However, TN-C has also been demonstrated to restrain cell migration, such as in the case of growth cones.36 So far, it was not rare to detect the high TN-C expression in both primary and metastasized tumors of patients with cancer and TN-C was also reported to be an effective novel prognostic biomarker for patients with cancer. However, previous studies were moderately limited because of relatively small sample sizes and these results were still controversial. The current comprehensive meta-analysis was performed to get more detailed and reliable results via large sample size, updated data, and reasonable subgroup analysis.
Undoubtedly, it should be emphasized that there would be some limitations in our meta-analysis. Above all, the number of samples was unevenly distributed and most of the included patients were from Asia, with a small part from Europe. Moreover, because of the dispersed data, the assessment between TN-C expression level and the prognosis of various patients with cancers might lead to a lack of specificity for clinical evaluation. Once more, the HR and 95% CI were estimated from the Kaplan-Meier survival curves in 8 studies, which might be less accurate than the data acquired directly from published statistics. Furthermore, there were only about 14 types of cancer, which couldn’t fully represent all the cancers. Finally, the cutoffs and methods of low or high expression levels of TN-C were different in the included studies, which might lead to heterogeneity of results. As a semiquantitative measurement, IHC was adopted in most studies. However, only a few studies picked the ELISA which belonged to the quantitative approach. Inevitably, there existed indefinable heterogeneity in this meta-analysis. Consequently, all studies of larger sample size, multicenter, and higher quality with uniform standard for determining the expression level of TN-C are necessary conditions to validate the results of this study.
Conclusion
Despite the above limitations, we can draw a preliminary conclusion based on TSA. There is a dramatic correlation between high expression of TN-C and OS of various patients with cancer and it might be considered as a potential and promising unfavorable prognostic factor in human cancers. From another point of view, TN-C, which can be used as a monitoring indicator for poor prognosis, may be widely applied into different types of cancers. Tenascin-C may have a good clinical application prospect for monitoring of therapeutic efficacy, prognosis evaluation, and individualized treatment of patients with cancer.
Supplemental Material
Supplemental Material, TCRT-18-0071-Supplementary_material for Prognostic Role of Tenascin-C for Cancer Outcome: A Meta-Analysis by Xinliang Ming, Shili Qiu, Xuefang Liu, Shuo Li, Yingchao Wang, Man Zhu, Nandi Li, Ping Luo, Chunzi Liang, and Jiancheng Tu in Technology in Cancer Research & Treatment
Abbreviations
- AD
assembly domain
- APIS
a priori information size
- CI
confidence interval
- DM
distant metastasis
- ECM
extracellular matrix
- ELISA
enzyme-linked immunosorbent assay
- HR
hazard ratio
- IHC
immunohistochemistry
- LNM
lymph node metastases
- NOS
Newcastle-Ottawa Scale
- OS
overall survival
- RIS
required information size
- TN-C
tenascin-C
- TSA
trial sequential analysis
Footnotes
Authors’ Note: The authors Xinliang Ming and Shili Qiu contributed equally to this work. The ethical permission was not applicable. The reasons are that we analyzed published data and our study did not involve human or animal research.
Declaration of Conflicting Interests: The author(s) declared no potential conflicts of interest with respect to the research, authorship, and/or publication of this article.
Funding: The author(s) disclosed receipt of the following financial support for the research, authorship, and/or publication of this article: The study was supported by 2012 US-China Biomedical Cooperation Projection (81261120403) and National Basic Research Program of China (973 Program; 2012CB720605) and Zhongnan Hospital of Wuhan University Science, Technology and Innovation Seed Fund (znpy2016046).
ORCID iD: Jiancheng Tu, MD  https://orcid.org/0000-0003-4304-1593
Supplemental Material: Supplemental material for this article is available online.
References
- 1. Siegel RL, Miller KD, Jemal A. Cancer Statistics, 2017. CA Cancer J Clin. 2017;67(1):7–30. [DOI] [PubMed] [Google Scholar]
- 2. Bray F, Jemal A, Grey N, Ferlay J, Forman D. Global cancer transitions according to the Human Development Index (2008-2030): a population-based study. Lancet Oncol. 2012;13(8):790–801. [DOI] [PubMed] [Google Scholar]
- 3. Yoshida T, Akatsuka T, Imanaka-Yoshida K. Tenascin-C and integrins in cancer. Cell Adhes Migr. 2015;1-2(9):96–104. [DOI] [PMC free article] [PubMed] [Google Scholar]
- 4. Chiquet M, Fambrough DM. Chick myotendinous antigen. II. A novel extracellular glycoprotein complex consisting of large disulfide-linked subunits. J Cell Biol. 1984;98(6):1937–1946. [DOI] [PMC free article] [PubMed] [Google Scholar]
- 5. Tang Y, Chen C, Sun HS, et al. Global Oct4 target gene analysis reveals novel downstream PTEN and TNC genes required for drug-resistance and metastasis in lung cancer. Nucleic Acids Res. 2015;43(3):1593–1608. [DOI] [PMC free article] [PubMed] [Google Scholar]
- 6. Ni WD, Yang ZT, Cui CA, Cui Y, Fang LY. Tenascin-C is a potential cancer-associated fibroblasts marker and predicts poor prognosis in prostate cancer. Biochem Biophys Res Commun. 2017;486(3):607–612. [DOI] [PubMed] [Google Scholar]
- 7. Takahashi Y, Sawada G, Kurashige J, Matsumura T, Uchi R. Tumor-derived tenascin-C promotes the epithelial-mesenchymal transition in colorectal cancer cells. Anticancer Res. 2013;33(5):1927–1934. [PubMed] [Google Scholar]
- 8. Tastekin D, Tas F, Karabulut SM, et al. Clinical significance of serum tenascin-C levels in breast cancer. Tumor Biol. 2014;35(7):6619–6625. [DOI] [PubMed] [Google Scholar]
- 9. Andreiuolo F, Le Teuff G, Bayar MA, et al. Integrating Tenascin-C protein expression and 1q25 copy number status in pediatric intracranial ependymoma prognostication: a new model for risk stratification. Plos One. 2017;12(6):e0178351. [DOI] [PMC free article] [PubMed] [Google Scholar]
- 10. Ohno Y, Izumi M, Yoshioka K, Ohori M, Yonou H. Prognostic significance of tenascin-C expression in clear cell renal cell carcinoma. Oncol Rep. 2008;20(3):511–516. [PubMed] [Google Scholar]
- 11. Ohtsuka M, Yamamoto H, Oshiro R, et al. Concurrent expression of C4.4A and tenascin-C in tumor cells relates to poor prognosis of esophageal squamous cell carcinoma. Int J Oncol. 2013;43(2):439–446. [DOI] [PubMed] [Google Scholar]
- 12. Sundquist E, Kauppila JH, Veijola J, Mroueh R, Lehenkari P. Tenascin-C and fibronectin expression divide early stage tongue cancer into low- and high-risk groups. Br J Cancer. 2017;116(5):640–648. [DOI] [PMC free article] [PubMed] [Google Scholar]
- 13. Guan Z, Zeng J, Wang Z, Xie H, Lv C. Urine tenascin-C is an independent risk factor for bladder cancer patients. Mol Med Rep. 2014;9(3):961–966. [DOI] [PubMed] [Google Scholar]
- 14. Xu Y, Li Z, Jiang P, et al. The co-expression of MMP-9 and tenascin-C is significantly associated with the progression and prognosis of pancreatic cancer. Diagn Pathol. 2015;10:211. [DOI] [PMC free article] [PubMed] [Google Scholar]
- 15. Gocheva V, Naba A, Bhutkar A, et al. Quantitative proteomics identify Tenascin-C as a promoter of lung cancer progression and contributor to a signature prognostic of patient survival. Proc Natl Acad Sci U S A. 2017;114(28):E5625–E5634. [DOI] [PMC free article] [PubMed] [Google Scholar]
- 16. McShane LM, Altman DG, Sauerbrei W, et al. Reporting recommendations for tumor marker prognostic studies (REMARK). J Natl Cancer Inst. 2005;97(16):1180–1184. [DOI] [PubMed] [Google Scholar]
- 17. Parmar MK, Torri V, Stewart L. Extracting summary statistics to perform meta-analyses of the published literature for survival endpoints. Stat Med. 1998;17(24):2815–2834. [DOI] [PubMed] [Google Scholar]
- 18. Moher D, Stewart L, Shekelle P. Implementing PRISMA-P: recommendations for prospective authors. Syst Rev. 2016;5:15. [DOI] [PMC free article] [PubMed] [Google Scholar]
- 19. Zeng X, Zhang Y, Kwong JS, et al. The methodological quality assessment tools for preclinical and clinical studies, systematic review and meta-analysis, and clinical practice guideline: a systematic review. J Evid Based Med. 2015;8(1):2–10. [DOI] [PubMed] [Google Scholar]
- 20. Egger M, Davey SG, Schneider M, Minder C. Bias in meta-analysis detected by a simple, graphical test. BMJ. 1997;315(7109):629–634. [DOI] [PMC free article] [PubMed] [Google Scholar]
- 21. Wetterslev J, Thorlund K, Brok J, Gluud C. Trial sequential analysis may establish when firm evidence is reached in cumulative meta-analysis. J Clin Epidemiol. 2008;61(1):64–75. [DOI] [PubMed] [Google Scholar]
- 22. Yang Z, Ni W, Cui C, Fang L, Xuan Y. Tenascin C is a prognostic determinant and potential cancer-associated fibroblasts marker for breast ductal carcinoma. Exp Mol Pathol. 2017;102(2):262–267. [DOI] [PubMed] [Google Scholar]
- 23. Araki A, Chocholous M, Gojo J, et al. Chromosome 1q gain and tenascin-C expression are candidate markers to define different risk groups in pediatric posterior fossa ependymoma. Acta Neuropathologica Communications. 2016;4(1):88. [DOI] [PMC free article] [PubMed] [Google Scholar]
- 24. Florian G, Suyin G, Hilke Z, Karl-Frederick M, Gerrit WE. Tenascin-C serum levels and its prognostic power in non-small cell lung cancer. Oncotarget. 2016;7(15):20945–20952. [DOI] [PMC free article] [PubMed] [Google Scholar]
- 25. Yang Z, Yeo S, Yin Y, et al. Tenascin-C, a prognostic determinant of esophageal squamous cell carcinoma. Plos One. 2016;11(1):e0145807. [DOI] [PMC free article] [PubMed] [Google Scholar]
- 26. Emoto K, Yamada Y, Sawada H, et al. Annexin II overexpression correlates with stromal tenascin-C overexpression: a prognostic marker in colorectal carcinoma. Cancer Am Cancer Soc. 2001;92(6):1419–1426. [DOI] [PubMed] [Google Scholar]
- 27. Ishiwata T, Takahashi K, Shimanuki Y, Ohashi R, Cui R. Serum tenascin-c as a potential predictive marker of angiogenesis in non-small cell lung cancer. Anticancer Res. 2005;25(1B):489–495. [PubMed] [Google Scholar]
- 28. Chiquet-Ehrismann R, Chiquet M. Tenascins: regulation and putative functions during pathological stress. J Pathol. 2003;200(4):488–499. [DOI] [PubMed] [Google Scholar]
- 29. Orend G, Chiquet-Ehrismann R. Tenascin-C induced signaling in cancer. Cancer Lett. 2006;244(2):143–163. [DOI] [PubMed] [Google Scholar]
- 30. Nagaharu K, Zhang X, Yoshida T, et al. Tenascin C induces epithelial-mesenchymal transition-like change accompanied by src activation and focal adhesion kinase phosphorylation in human breast cancer cells. Am J Pathol. 2011;178(2):754–763. [DOI] [PMC free article] [PubMed] [Google Scholar]
- 31. Hynes RO. The extracellular matrix: not just pretty fibrils. Science. 2009;326(5957):1216–1219. [DOI] [PMC free article] [PubMed] [Google Scholar]
- 32. Lowy CM, Oskarsson T. Tenascin C in metastasis: a view from the invasive front. Cell Adhes Migr. 2015;9(1-2):112–124. [DOI] [PMC free article] [PubMed] [Google Scholar]
- 33. Saupe F, Schwenzer A, Jia Y, et al. Tenascin-C downregulates wnt inhibitor dickkopf-1, promoting tumorigenesis in a neuroendocrine tumor model. Cell Rep. 2013;5(2):482–492. [DOI] [PubMed] [Google Scholar]
- 34. Parekh K, Ramachandran S, Cooper J, Bigner D, Patterson A, Mohanakumar T. Tenascin-C, over expressed in lung cancer down regulates effector functions of tumor infiltrating lymphocytes. Lung Cancer. 2005;47(1):17–29. [DOI] [PubMed] [Google Scholar]
- 35. Juhász MA, Bárdos H, Répássy G, Adány R. Characteristic distribution patterns of tenascin in laryngeal and hypopharyngeal cancers. Laryngoscope. 2000;110(1):84–92. [DOI] [PubMed] [Google Scholar]
- 36. Faissner A. The tenascin gene family in axon growth and guidance. Cell Tissue Res. 1997;290(2):331–341. [DOI] [PubMed] [Google Scholar]
Associated Data
This section collects any data citations, data availability statements, or supplementary materials included in this article.
Supplementary Materials
Supplemental Material, TCRT-18-0071-Supplementary_material for Prognostic Role of Tenascin-C for Cancer Outcome: A Meta-Analysis by Xinliang Ming, Shili Qiu, Xuefang Liu, Shuo Li, Yingchao Wang, Man Zhu, Nandi Li, Ping Luo, Chunzi Liang, and Jiancheng Tu in Technology in Cancer Research & Treatment


