

Abstract
As the active anticancer component of Rabdosia Rubescens, oridonin has been proved to show strong anticancer activity in cancer cells, which is also found to be closely related to its specific inhibition effects on the EGFR tyrosine kinase activity. In this study, atomic force microscopy based single molecule force spectroscopy (AFM-SMFS) was used for real-time and in-situ detection of EGF-EGFR interactions in living esophageal cancer KYSE-150 cells to evaluate the anticancer activity of oridonin for the first time. Oridonin was found to induce apoptosis and also reduce EGFR expression in KYSE-150 cells. AFM-SMFS results demonstrated that oridonin could inhibit the binding between EGF and EGFR in KYSE-150 cells by decreasing the unbinding force and binding probability for EGF-EGFR complexes, which was further proved to be closely associated with the intracellular ROS level. More precise mechanism studies based on AFM-SMFS demonstrated that oridonin treatment could decrease the energy barrier width, increase the dissociation off rate constant and decrease the activation energy of EGF-EGFR complexes in ROS dependent way, suggesting oridonin as a strong anticancer agent targeting EGF-EGFR interactions in cancer cells through ROS dependent mechanism. Our results not only suggested oridonin as a strong anticancer agent targeting EGF-EGFR interactions in ROS dependent mechanism, but also highlighted AFM-SMFS as a powerful technique for pharmacodynamic studies by detecting ligand-receptor interactions, which was also expected to be developed into a promising tool for the screening and mechanism studies of drugs.
Keywords: Oridonin, Esophageal cancer, EGFR, Atomic force microscopy, Single molecule force spectroscopy
1. Introduction
As well known, EGFR is a kind of cell surface receptor belonging to the ErbB family of extracellular protein ligands, which can be activated by binding with its specific ligands, including EGF and TNF-α. The binding of EGF and EGFR would lead to the formation of homodimer with EGFR or heterodimer with another member of the ErbB receptor family, such as ErbB2/Her2/neu, which would stimulate its intrinsic intracellular protein-tyrosine kinase activity, and further activate some downstream signaling proteins to initiate several signal transduction cascades, principally the MAPK, Akt and JNK pathways, leading to DNA synthesis and cell proliferation [1]. EGFR has been found to be amplified in different kinds of cancers, and its downstream pathway regulates epithelial-mesenchymal transition, migration, and tumor invasion by modulating ECM components, always promoting tumor invasion [2,3]. It has been reported that EGFR protein over-expression and gene amplification are associated with aggressive biological behaviors of esophageal squamous cell carcinoma (ESCC), and the over-expression of EGFR are thought to be common events in ESCC, which contributes to tumor differentiation and lymph node metastasis [4]. More than 60% of the clinical ESCC cases are found to show EGFR over-expression, and EGFR over-expression is significantly correlated with a differentiated degree, T stage, N stage, and tumor, node, metastases stage [5]. And the high expression level of EGFR in esophageal cancer may predict a clinical benefit of EGFR antagonists treatment [6], and the development of novel molecular targeted therapeutic agents for EGFR has also been high-lighted as treatment methods for esophageal cancer [7]. Therefore, increasing attentions are focused onto the discovery and development of drugs that could affect the function or activity of EGFR for esophageal cancer treatment.
Traditional Chinese Medicine (TCM), which is based on the thousands of years’ clinical experience in ancient China, is also becoming the most attractive field for new drug discovery that may also provide efficient EGFR targeting agents for cancer treatment. Rabdosia Rubescens is a kind of widely known TCM for the treatment of pharyngitis and esophageal cancer in the Henan province of China, and as its active component, oridonin has been reported to show excellent anti-inflammatory and anticancer effects [8–10]. Oridonin is found to inhibit EGFR downstream pathways and promote human epidermoid carcinoma A431 cell to death [11]. And additionally, oridonin is also reported to inhibit the total tyrosine kinase activity, the protein expressions of EGFR and the phosphorylation of EGFR in A431 cells [12–14]. Using a human laryngeal cancer cell with EGFR gene amplification, Kang et al. found that combing with other EGFR inhibition agent, oridonin showed stronger inhibition effects on laryngeal cancer cells, demonstrating that combined EGFR treatment should be a potentially very effective antineoplastic therapy for cancer [15]. More importantly, oridonin is also found to inhibit gefitinib-resistant lung cancer cells by suppressing EGFR phosphorylation, associated with the inhibition of ERK/MMP-12 and CIP2A/Akt signaling pathways [16]. These results collectively suggested that oridonin could be served as a potential EGFR targeting agent for cancer treatment, however, the exact effects of oridonin on the interactions of EGF and EGFR in cancer cells have not been investigated yet.
Based on its high resolution imaging and high force sensitivity, atomic force microscopy (AFM) has been widely used for physical and chemical studies [17,18]. And in recent decades, AFM has shown its wide applications to detect single molecule interactions in living cells, which dramatically extends our understanding of single molecule signaling events in cells [19–22]. Taking the advantages of force measurements and high resolution imaging, AFM can also be used to detect the distribution of EGFR in cancer cells at single molecule level [23]. And by functionalization of AFM tips with EGF or TNF-α, AFM single molecule force spectroscopy (SMFS) could be applied to detect the interactions between EGF/TNF-α and EGFR in living cells. More importantly, AFM can also be used to detect the pharmacological effects of drugs by detecting EGF-EGFR interactions in living cells [24]. Zhang et al. probed the inhibition effect of resveratrol on EGFR expression levels on MCF-7 cells by EGF-functionalized AFM tips, providing a better understanding of the nanobiology of EGFR molecules on the surface of MCF-7 cells [25]. Additionally, AFM was also applied to investigate the effect of Trastuzumab, as well as Pertuzumab, on HER2-modulated EGF-EGFR interactions, which demonstrated that EGF bound to EGFR more stably in the cells co-expressing EGFR and HER2, and the binding enhancement in the presence of HER2 was inhibited by either Trastuzumab or Pertuzumab [26]. Up to now, how to extend AFM-SMFS for intracellular signaling events studies, such as intra-cellular ROS level, by probing ligand-receptor interactions on living cell surface is still a big challenge.
In the present work, using EGF functionalized AFM tips, we determined the inhibition effects of oridonin on the single molecule interactions between EGF and EGFR in living esophageal cancer KYSE-150 cells and further investigated the potential mechanism of oridonin inhibited EGF-EGFR interactions. These results obtained on single molecule level not only clarified how oridonin inhibit EGFR signaling events in cancer cells, but also proved the potential of AFM-SMFS for pharmacological studies of drugs in living cells and for intracellular signaling molecule investigations by probing cell membrane receptors.
2. Materials and Methods
2.1. Materials
Oridonin (≥98%, HPLC) was purchased from mingwang biotechology (China). FBS, penicillin/streptomycin, DMEM medium, and trypsin kit were obtained from Gibco (USA). EGF was purchased from R&D (USA) and anti-EGFR antibody was obtained from Cell Signaling (USA). N-acetyl-l-cysteine (NAC), Annexin V-FITC/PI (Annexin V-Fluorescein Isothiocyanate/Propidium Iodide) apoptosis detection kit and DCFH-DA (2′,7′-dichlorodihydrofluorescein diacetate) ROS assay kit were purchased from Beyotime Institute of Biotechnology. RIPA lysis buffer, Anti-EGFR IgG, anti-β-actin IgG, anti-rabbit IgG were from Cell Signaling (USA).
2.2. Cell culture
Human esophageal cancer KYSE-150 cell line was obtained from tumor cell library of Chinese Academy of Medical Sciences (Bei-Jing, China). Cells are cultured with DMEM medium supplemented with 10% FBS, 100 U/mL penicillin, and 100 g/mL streptomycin in a humidified atmosphere of 5% CO2 at 37 °C.
2.3. Intracellular ROS Measurements
Intracellular ROS level of KYSE-150 cells was determined by flow cytometry using a DCFH-DA based kit. The cells were seeded into 6 well plates with a density of 1 × 10⁵ cells/well for 24 h and incubated with different concentration of oridonin for 3 h. To scavenge the ROS produced by oridonin, cells were pretreated with 2.5mM MNAC for 1 h and then treated with oridonin for 3 h. After oridonin treatment, cells were harvested, washed three times with PBS and incubated with DCFH-DA solution for 30 min dark at 37 °C. Flow cytometry (BD, USA) was used to detect the intracellular ROS level after the cells were collected and washed twice with PBS.
2.4. Cell apoptosis detection
Annexin V-FITC/PI apoptosis detection kit was used to detect the apoptosis of oridonin treated KYSE-150 cells according to the manufacturer’s instructions. The cells were seeded into 6 well plates with a density of 1 × 10⁵ cells/well for 24 h and incubated with different concentration of oridonin for 24 h. To scavenge the ROS produced by oridonin, cells were pretreated with 2.5mM MNAC for 1 h and then treated with oridonin for 24 h. After incubated with oridonin, KYSE-150 cells were harvested, washed three times with PBS, suspended in Annexin V binding buffer, and incubated with FITC-labeled Annexin V and PI for 5 min at room temperature in dark. Then, the samples were immediately analyzed by Flow cytometry (BD, USA).
2.5. Western blot analysis
Harvested KYSE-150 cells were cultured at density of 3 × 10⁵ cells/mL in six well plates (2 mL/well) for overnight incubation. Then, cells were stimulated with oridonin for 24 h. To scavenge the over-produced ROS induced by oridonin, cells were pretreated with 2.5mM MNAC for 1 h and then treated with oridonin for 24 h. RIPA lysis buffer was used to extract the whole cell proteins from KYSE-150 cells and the protein concentrtions were determined using Bio-Rad protein assay kit according to the manufacturer’s guidelines. Protein was then denatured by boiling at 100 °C for 10 min sample buffer. The samples were then separated by electrophoresis on 8% SDS-polyvinylamide minigels, after which they were transferred to polyvinylidene difluoride membranes. The transferred membranes were blocked with 5% skim milk in TBST solution for 1 h, and then washed three times with TBST (5μ min/time). After incubated with anti-EGFR antibodies overnight at 4 °C, the membranes were washed three times with TBST, and incubated with secondary antibodies with fluorescence (anti-rabbit IgG, 1:5000) at room temperature for 1 h followed by the fluorescence imaging by Odyssey infrared imaging system (LI-COR Biosciences, USA). The relative intensities of the target bands were then normalized to the corresponding β-actin band intensities for further analysis.
2.6. AFM sample preparation
To prepare AFM samples, KYSE-150 cells were harvested by 0.25% trypsin and cultured into cell culture dishes with a density of 3 × 10⁵ cells/well. After 24 h incubation, cells were stimulated with oridonin for 24 h. To scavenge the over-produced ROS induced by oridonin, cells were pretreated with 2.5mM MNAC for 1 h and then treated with oridonin for 24 h. After oridonin treatment, cells were washed with PBS buffer to discard the suspending cells in medium, and then immediately used for force measurements in DMEM medium by AFM.
2.7. AFM tip functionalization
AFM silicon nitride (Si3N4) tips (type: NP-10), which had average spring constant of 0.12 N/m (tip B), were obtained from Veeco (Santa Barbara, California, USA). The exact spring constant of the AFM tips used was 0.133 ± 0.014 N/m, which was calculated by thermal noise method implemented in the Nanoscope software on AFM (Bioscope Catalyst, Bruker, USA). The functionalization of EGF onto AFM tips was performed by the similar method as described previously [25,27]. The functionalization processes of AFM tips were shown as Fig. 4A. The AFM tips were immersed in ethanol for 10 min and irradiated with ultraviolet light for 30μ min to remove the impurities on tip surface. Then, the tips were cleaned by immersing in piranha solution (H2SO4:H2O2 = 3:1, v/v) for 5 min, which could remove the residual impurities and induce the formation of hydroxy group on tip surface. The cleaned tips were incubated in APTES (1.0% v/v) in ethanol for 1 h at room temperature to make sure that the amino groups were introduced onto the surface of AFM tips by the reaction between the hydroxy group on tip surface and the Si-O group in APTES. After rinsed thoroughly with the solvent to remove any unbound silane, the tips were incubated with 2.5% glutaraldehyde in PBS solution for 0.5 h at room temperature, which would couple glutaraldehyde onto tip surface by the reaction between the amino group on tip surface and the aldehyde group of glutaraldehyde. The amino group activated AFM tips were washed with PBS for three times and then incubated with 100 g/mL EGF solution overnight at 4 °C, which could couple EGF onto AFM tips by the reaction between the aldehyde group on tip surface and the amino group of EGF. The tips were washed with PBS solution to remove the unbounded EGF, and then immediately used for force measurement.
Fig. 4.
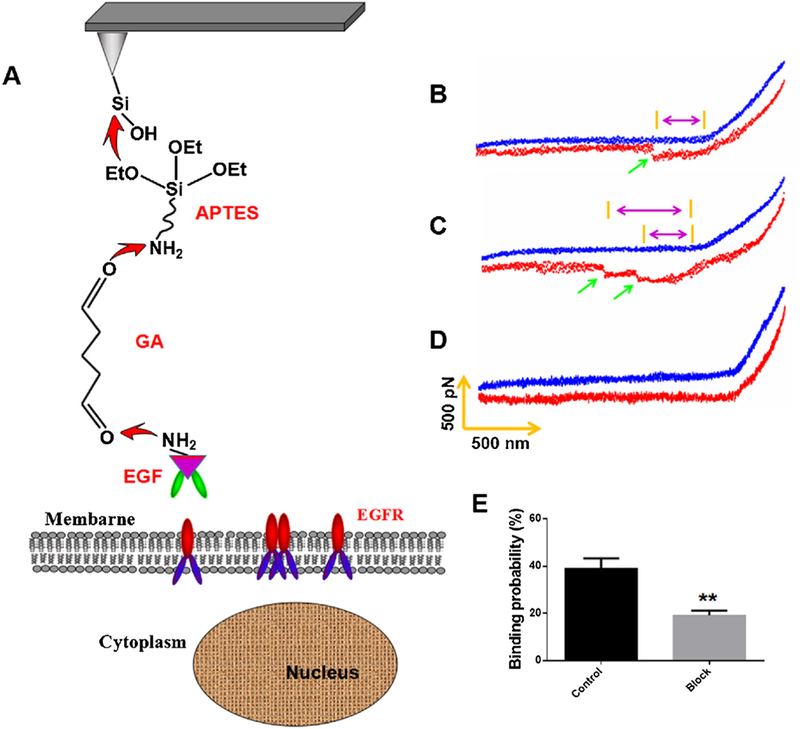
AFM force measurements with EGF-functionalized AFM tip on living KYSE-150 cells. (A) AFM tip functionalization procedure and schematic representation of the single-molecule force measurement between EGF-functionalized AFM tips and EGFR in KYSE-150 cells. (B, C) Representative force curves obtained with EGF-modified AFM tips in KYSE-150 cells, and (D) after the system was blocked with free anti-EGFR antibody. (E) The binding probability of EGF-functionalized tips in KYSE-150 cells before and after blocking, data was expressed as mean ± S.E.M. from four independent experiments, and in each experiments, more than 1000 force curves were measured on living cells, **p < 0.01.
2.8. AFM analysis
AFM-SMFS measurements of EGF and EGFR on the surface of KYSE-150 cells were carried out on an AFM system (Bioscope Catalyst, Bruker, USA). To detect the interaction force between EGF and EGFR, all the force curves were performed using a pulling velocity of 4.1 μm/s, with a rupture size of 2 μm on living KYSE-150 cells in DMEM medium. During the force measurements, AFM tip was positioned onto a cell, engaged at a vertical set point and threshold force of 1 nN, delayed at the cell surface for 100 ms and then retracted. For antibody blocking experiments, cells were pre-incubated with anti-EGFR antibody (100 g/mL) for 0.5 h, and then used for force measurements at the same condition. More than 6000 original force-distance curves for each group were recorded from five independent experiments. For the dynamic force spectrum measurement, the forces were recorded at different loading rate (calculated from the scanner’s instantaneous velocity and the effective spring constant of the AFM tip) ranging from 10 to 10,000 pN/s. The force–distance curves were analyzed using the instrument equipped Nanoscope analysis software to determine the rupture force (unbinding force) and rupture length between EGF and EGFR. From each histogram, the most likely single EGF-EGFR rupture force can be determined by fitting the distributions of the rupture forces with the Gaussian model. The maximum values of the Gaussian peaks represent a single-molecule-based statistical measure of the strength of the EGF-EGFR bond. Based on the dynamic force spectrum results, the kinetic bond rupture parameters were calculated using the Bell, Evans and Ritchie model [28,29].
2.9. Statistical analysis
All data was expressed as mean ± S.E.M. Statistical analysis was performed using Student’s t-test, and p < 0.05 was regarded as statistically significant.
3. Results
3.1. Oridonin induced apoptosis of KYSE-150 cells by inducing ROS overproduction
Firstly, we determined the effects of oridonin on ROS production in KYSE-150 cells by flow cytometry, which indicated that oridonin could increase the intracellular ROS level of KYSE-150 cells (Fig. 1A–F). The relative ROS level in KYSE-150 cells increased from 100 ± 11% to 114.3 ± 0.54%, 142.3 ± 2.77% and 167.3 ± 1.02% after 10μM, 30μM and 50μM oridonin treatment, respectively (Fig. 1G). NAC, as a kind of ROS scavenger, was used to pretreat KYSE-150 cells to remove the excessive ROS induced by oridonin. And the results implied that the relative ROS level in control and 50μM oridonin treated KYSE-150 cells were 108.2 ± 7.78% and 99.39 ± 1.54% with NAC pretreatment, respectively.
Fig. 1.
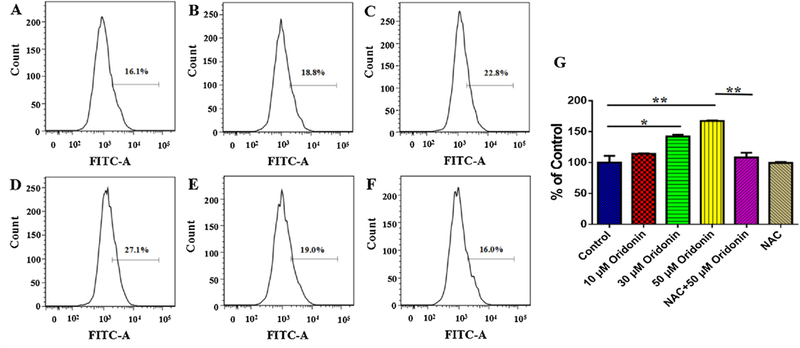
Effects of oridonin on intracellular ROS level of KYSE-150 cells. (A) Control KYSE-150 cells, (B) 10 μM oridonin treated KYSE-150 cells, (C) 30 μM oridonin treated KYSE-150 cells, (D) 50 μM oridonin treated KYSE-150 cells, (E) 2.5 μM MNAC and 50 μM oridonin treated KYSE-150 cells, (F) 2.5Μm MNAC treated KYSE-150 cells. (G) Statistical results of oridonin induced ROS production in KYSE-150 cells, data was expressed as mean ± S.E.M. from three independent experiments, *p < 0.05, **p < 0.01.
The apoptosis induction effects of oridonin on KYSE-150 cells were also tested by flow cytometry, and the results were presented in Fig. 2A–F, which demonstrated the apoptosis induction effects of oridonin through ROS dependent way. The statistical results demonstrated that the apoptotic cells increased from 7.04 ± 0.77% to 12.4 ± 1.38%, 27.27 ± 2.07% and 46.19 ± 4.2% after 10μM, 30μM and 50μM oridonin treatment, respectively (Fig. 2G). However, by remove of excessive intracellular ROS through NAC pretreatment, the apoptotic cells in 50μM oridonin treated group were reversed to be 13.74 ± 0.29% (Fig. 2G). And NAC treatment showed no sig-nificant effects on the apoptosis of control KYSE-150 cells, which showed the percentage of apoptotic cells as 8.63 ± 0.69% (Fig. 2G). These results suggested that oridonin could induce KYSE-150 cell apoptosis in ROS dependent way.
Fig. 2.
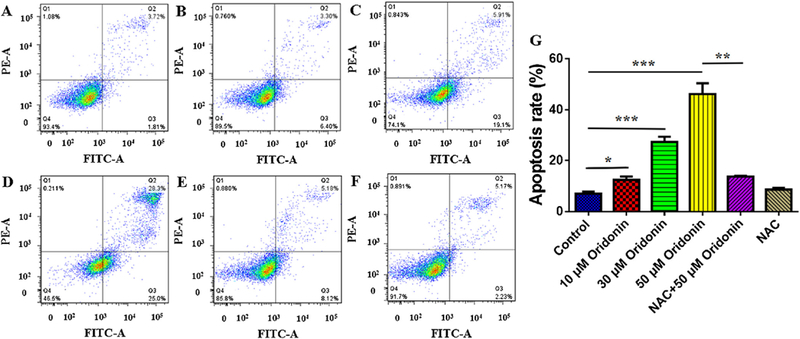
Effects of oridonin on apoptosis of KYSE-150 cells. (A) Control KYSE-150 cells, (B) 10 μM oridonin treated KYSE-150 cells, (C) 30 μM oridonin treated KYSE-150 cells,(D) 50 μM oridonin treated KYSE-150 cells, (E) 2.5 μM MNAC and 50 μM oridonin treated KYSE-150 cells, (F) 2.5 μM MNAC treated KYSE-150 cells. (G) Statistical results of oridonin induced KYSE-150 cell apoptosis, data was expressed as mean ± S.E.M. from three independent experiments, *p < 0.05, **p < 0.01, ***p < 0.001.
3.2. Oridonin inhibit EGFR expression in KYSE-150 cells in ROS dependent way
To confirm the expression of EGFR in KYE-150 cells and also to understand the effects of oridonin on EGFR, we further determined the expression of EGFR in KYSE-150 cells. As shown in Fig. 3A, oridonin treatment was found to decrease the EGFR expression in KYSE-150 cells, and the remove of excessive ROS by NAC could also reverse oridonin inhibited EGFR expression. The statistical analysis implied that the relative expression level of EGFR decreased from 100% for control cells to 86.27 ± 3.19%, 83.44 ± 3.09% and 73.97 ± 1.95% for 10μM, 30μM and 50μM oridonin treated KYSE-150 cells, respectively. And with NAC pretreatment, the relative expression level of EGFR were found to be 94.31 ± 4.84% and 101.2 ± 2.71% for 50μM oridonin treated KYSE-150 cells and control KYSE-150 cells, respectively. These consequence demonstrated that oridonin could also inhibit EGFR expression in KYSE-150 cells in ROS-dependent way.
Fig. 3.
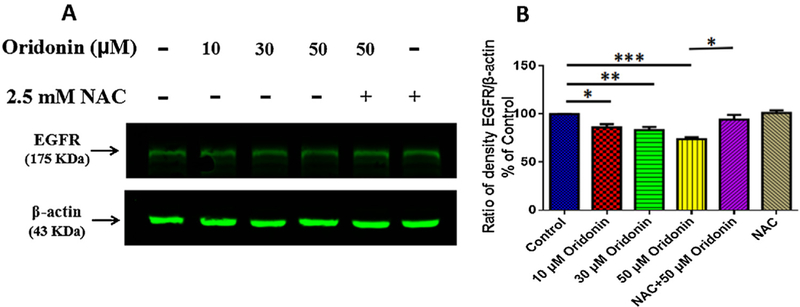
Effects of oridonin on EGFR expression of KYSE-150 cells. (A) Western blot analysis of EGFR expression in KYSE-150 cells. (B) Statistical results of the effects of oridonin on EGFR expression in KYSE-150 cells, data was expressed as mean ± S.E.M. from three independent experiments, *p < 0.05, **p < 0.01, ***p < 0.001.
3.3. Effects of oridonin on EGF-EGFR interactions in KYSE-150 cells
According to the previous report, EGFR mostly exists as monomer at the resting state, and as EGF protein was modified on the AFM tip and only one pair of EGF-EGFR was measured during the short tip–cell contact time, the rupture force we detected was the force between EGF and EGFR monomer. The single molecule force spectroscopy of AFM was firstly carried out on living KYSE-150 cells to detect the interactions between EGF and EGFR using EGF functionalized AFM tips using a similar method as reported previously [24,26], as shown in Fig. 4A. Typical rupture force curves for EGF-EGFR complex was shown in Fig. 4B, C, which presented single molecule force curve for one pair of EGF-EGFR interaction (Fig. 4B) and occasionally two pairs of EGF-EGFR interaction (Fig. 4C). To demonstrate the specificity of EGF functionalized AFM tips, anti-EGFR antibody was added into the culture medium for 0.5 h incubation, which always resulted in no force peak could be detected by AFM (Fig. 4D). And the binding probability of EGF-EGFR complex in living KYSE-150 cells also significantly decreased from38.99% ± 8.54 to 19.15 ± 4.01%. The pretreatment with ant-EGFR antibody, which might compete for the binding sites of EGFR with the EGF molecules on AFM tips, made the specific force peak for EGF-EGFR complex disappeared and also significantly decreased the binding probability. These results confirmed the specificity of EGF functionalized AFM tips for EGFR detections in KYSE-150 cells.
Then, using this kind of specific AFM tips, we determined the rupture force for EGF-EGFR complex in KYSE-150 cells to clarify the anticancer effects of oridonin and the roles of ROS in the anticancer effects of oridonin in esophageal cancer cells. As shown in Fig. 5A, control KYSE-150 cells showed average rupture force of 67.1 ± 20.1 pN for EGF-EGFR complex. After 24 h oridonin treatment, the average rupture force for EGF-EGFR complex decreased to 65.3 ± 20.6 pN (Fig. 5B), 64.1 ± 22.5 pN (Fig. 5C) and 60.7 ± 21.0 pN (Fig. 5D) for 10μM oridonin, 30μM oridonin and 50μM oridonin treated KYSE-150 cells, respectively.
Fig. 5.
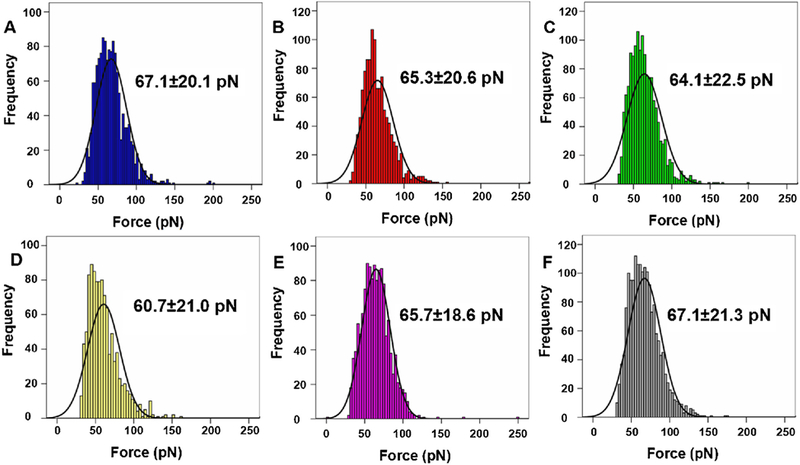
Unbinding forces measured on the surface of KYSE-150 cells by EGF-functionalized AFM tips. Histogram of unbinding forces of EGF-EGFR complexes obtained on (A) control KYSE-150 cells, (B) 10 μM oridonin treated KYSE-150 cells, (C) 30 μM oridonin treated KYSE-150 cells, (D) 50 μM oridonin treated KYSE-150 cells, (E) 2.5 μM MNAC and 50 μM oridonin treated KYSE-150 cells, (F) 2.5 μM MNAC treated KYSE-150 cells. The black lines in the histograms are the corresponding Gaussian fits. Data was expressed as mean ± S.D., n > 6000.
Then, we further determined the effects of ROS-scavenger NAC on oridonin decreased rupture force for EGF-EGFR complex in KYSE-150 cells. With pretreatment of NAC, the average rupture force for EGF-EGFR complex in 50μM oridonin treated KYSE-150 cells increased to 65.7 ± 18.6 pN (Fig. 5E). And the average rupture force for EGF-EGFR complex in NAC treated KYSE-150 cells without oridonin treatment was 67.1 ± 21.3 pN (Fig. 5F). As widely known, the rupture force detected by AFM always implied the force to break the binding of ligand-receptor complexes, which could partially reflect the stability of ligand-receptor complexes. The decreased rupture force for EGF-EGFR complex in KYSE-150 cells upon oridonin treatment demonstrated that oridonin treatment could decrease the stability of EGF-EGFR complex in KYSE-150 cells, which resulted in smaller forces to break EGF-EGFR binding. And as the remove of excessive ROS by NAC resulted in the reverse of rupture force for EGF-EGFR complex, these results suggested that ROS played the most important roles in oridonin decreased stability of EGF-EGFR complex.
Except for the rupture force of EGF-EGFR complex, we also determined the emergence probability of the specific rupture events for EGF-EGFR complex in KYSE-150 cells upon oridonin treatment, which could be set as binding probability for EGF-EGFR complex. As shown in Fig. 6B, the binding probability for EGF-EGFR complex in control KYSE-150 cells was 40.00 ± 3.46%, which decreased to 35.72 ± 2.48%, 33.13 ± 3.19% and 26.25 ± 2.78% after 10μM, 30μM and 50μM oridonin treatment, respectively. However, the pretreatment with NAC dramatically reversed the binding probability for the binding probability from 26.25 ± 2.78% to 34.62 ± 2.64% in 50μM oridonin treated KYSE-150 cells. And the pretreatment with NAC showed no significant effects on the binding probability for the binding probability with an average binding probability of 39.19 ± 1.82%. These results collectively suggested that oridonin could decrease the binding probability between EGF and EGFR in KYSE-150 cells dose dependently, and after the remove of excessive ROS by NAC, oridonin decreased binding probability between EGF and EGFR was reversed. The decreased binding probability for EGF-EGFR complex induced by oridonin demonstrated the weaker interaction potential for EGF-EGFR complex and lower expression of EGFR in KYSE-150 cells after oridonin treatment, suggesting the anticancer effects of oridonin by influencing the interaction of EGF-EGFR and expression of EGFR in KYSE-150 cells. It was also worth to note that NAC pretreatment could also reverse oridonin induced EGF-EGFR binding probability decrease in KYSE-150 cells, which further proved that ROS played the key role in the effects of oridonin against EGF-EGFR interactions. The rupture length for EGF-EGFR complex in KYSE-150 cells upon oridonin treatment was also determined (Fig. 7), which were found to be about 350 nm. However, the rupture length for EGF-EGFR complex we obtained showed no dose dependent changes after oridonin treatment, which suggested that oridonin had no significant effects on the rupture length for EGF-EGFR complex in KYSE-150 cells.
Fig. 6.
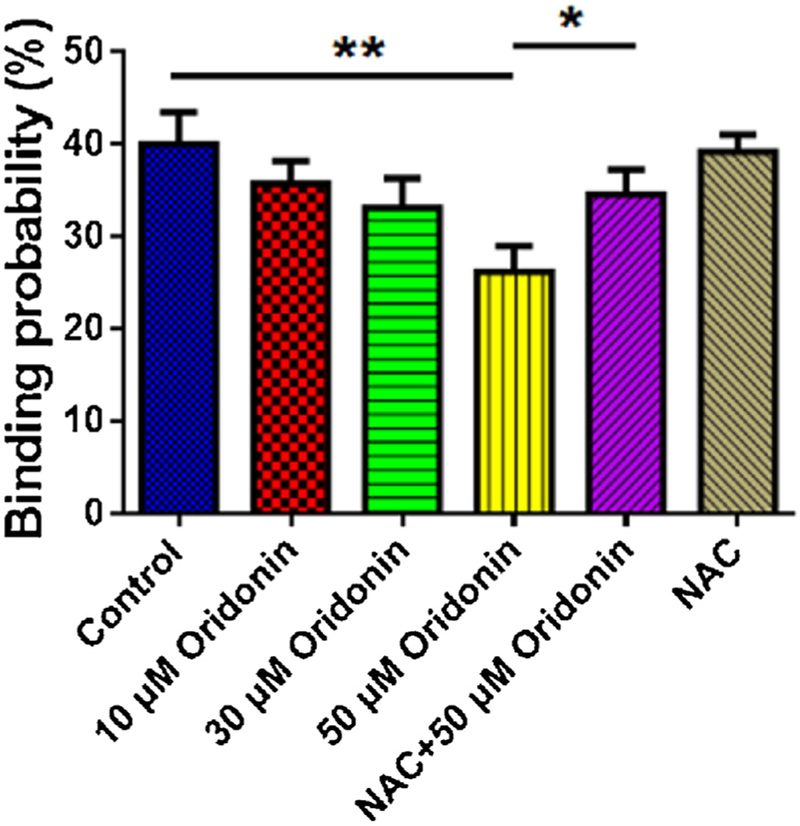
Effects of oridonin on the binding probability for EGF-EGFR complex in KYSE-150 cells, data was expressed as mean ± S.E.M. from five independent experiments, and in each experiments, more than 1000 force curves were calculated, *p < 0.05, **p < 0.01.
Fig. 7.
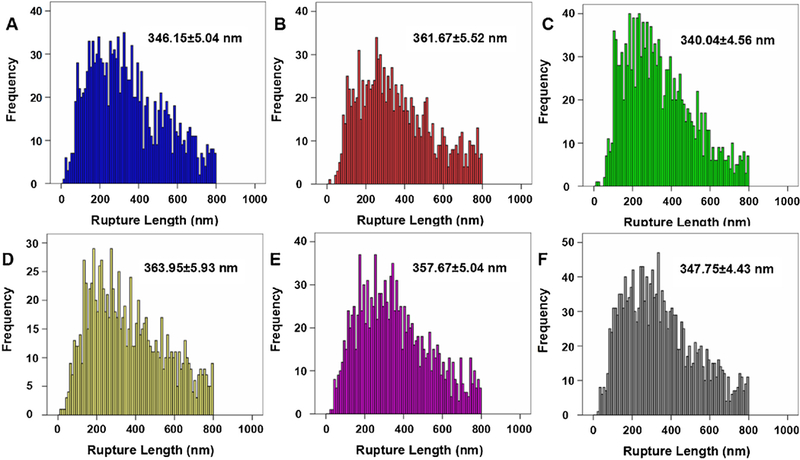
Histogram distribution of the rupture length for EGF-EGFR complex in KYSE-150 cells. Rupture length for EGF-EGFR complex obtained on (A) control KYSE-150 cells, (B) 10 μM oridonin treated KYSE-150 cells, (C) 30 μM oridonin treated KYSE-150 cells, (D) 50 μM oridonin treated KYSE-150 cells, (E) 2.5 mM NAC and 50 μM oridonin treated KYSE-150 cells, (F) 2.5 mM NAC treated KYSE-150 cells by EGF-functionalized AFM tips. Data was expressed as mean ± S.D., n > 6000.
3.4. Effects of oridonin on the dynamic force spectra and dissociation kinetics for EGF-EGFR complex in KYSE-150 cells
To further verify the inhibition mechanism of oridonin on EGF-EGFR interactions, we checked the rupture forces of EGF-EGFR complex in the presence of oridonn at different AFM loading rates, which was plotted into dynamic force spectra of EGF–EGFR under different conditions as shown in Fig. 8.
Fig. 8.
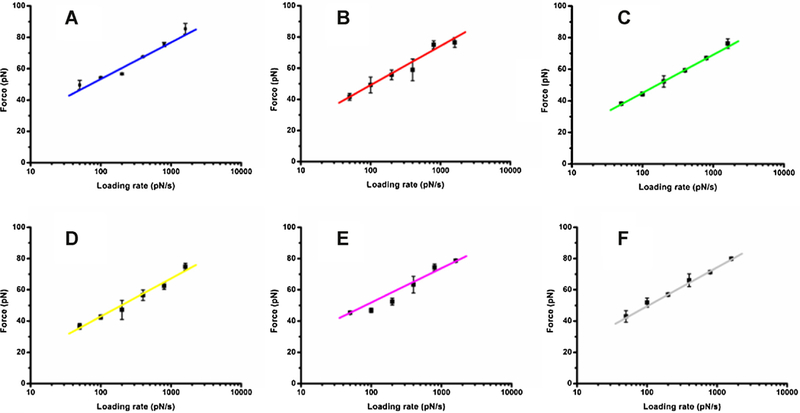
Effects of oridonin on the dynamic force spectra for EGF-EGFR complex in KYSE-150 cells. (A) Control KYSE-150 cells, (B) 10 μM oridonin treated KYSE-150 cells,(C) 30 μM oridonin treated KYSE-150 cells, (D) 50 μM oridonin treated KYSE-150 cells, (E) 2.5 μM MNAC and 50 μM oridonin treated KYSE-150 cells, (F) 2.5 μM MNAC treated KYSE-150 cells. Forces were measured at different loading rates by EGF-modified tips and each data point represented the mean value of three independent experiments with about 1000 effective force curves.
The rupture force values ranged from 30 pN to 100 pN in the loading rates of 10–10,000 pN/s in oridonin treated or untreated KYSE-150 cells (Fig. 8). The forces of EGF–EGF complex in KYSE-150 cells all increased linearly with the logarithm of loading rate. The above dynamic force spectra allowed us to determine the disso-ciation kinetic parameters of EGF-EGFR complex in KYSE-150 cells under different conditions based on Bell model, which told the relationship between the rupture force F of the ligand–receptor pair and the loading rate γ as the following equation [28,29]:
Where koff (0) is off-rate constant for dissociation in the absence of external force F, χβ is the position of the energy barrier that should be overcome during the dissociation (energy barrier width), kB is the Boltzman constant and T is Kelvin temperature.
The dynamic force spectra of EGF-EGFR under different oridonin treatment conditions all increased linearly with the logarithm of loading rate, thus could be all fitted into linear equation shown as Y = aX + b. Combing with Bell model, a and b can be calculated as following:
Based on these formulas, the energy barrier width (χβ) for EGF-EGFR complex in control KYSE-150 cells, 10μM oridonin treated KYSE-150 cells, 30μM oridonin treated KYSE-150 cells, 50μM oridonin treated KYSE-150 cells, 2.5mM MNAC + 50μM oridonin treated KYSE-150 cells and 2.5mM MNAC treated KYSE-150 cells was 0.172 ± 0.003 nm, 0.170 ± 0.009 nm, 0.164 ± 0.013 nm, 0.167 ± 0.016 nm, 0.169 ± 0.006 nm and 0.174 ± 0.002 nm, respectively (Table 1). In addition, the dissociation off-rate constant (koff (0)) for EGF-EGFR-complex in control-KYSE-150 cells was 0.034 ± 0.002 s−1,-which increased to-0.038 ± 0.002 s−1, 0.049 ± 0.005 s−1 and 0.054 ± 0.003 s−1 after 10μM, 30μM and 50μM oridonin treated KYSE-150 cells, respectively (Table 1). Pretreatment with NAC had few effects on the dissociation off-rate constant for EGF-EGFR complex, which showed koff (0) value of 0.035 ± 0.003 s−1. However, NAC pretreatment could reverse 50μM oridonin increased koff (0) value to 0.041 ± 0.002 s−1 (Table 1). These results demonstrated that oridonin could increase the dissociation off-rate constant for EGF-EGFR complex in dose dependent manner. The dissociation off-rate constant for ligand-receptor complex describes the speed of dissociation reactions for the ligand-receptor complex, which thus could also indicate the stability of ligand-receptor complex. Therefore, oridonin was found to increase the dissociation reactions for the EGF-EGFR complex in KYSE-150 cells, which meant that oridonin decreased the stability of EGF-EGFR complex in KYSE-150 cells. The remove of excessive ROS by NAC could reverse oridonin increased dissociation off-rate constant, which demonstrated that NAC could reverse oridonin decreased stability of EGF-EGFR complex, suggesting the important roles of ROS in oridonin decreased EGF-EGFR complex stability in KYSE-150 cells.
Table 1.
Effects of oridonin on the dissociation kinetics for EGF-EGFR complex. xβ, koff (0) and ΔG0 are the energy barrier width, the dissociation off-rate constant and the activation energy for the EGF-EGFR complex on the surface of KYSE-150 cells, respectively.
| KYSE-150 cells | xβ (nm) | koff(0) (s−1) | ∆G0 (kBT) |
|---|---|---|---|
| Control | 0.172 ± 0.003 | 0.034 ± 0.002 | 24.043 ± 0.114 |
| 10 μM Oridonin | 0.170 ± 0.009 | 0.038 ± 0.002 | 23.987 ± 0.058 |
| 30 μM Oridonin | 0.164 ± 0.013 | 0.049 ± 0.005** | 23.743 ± 0.105* |
| 50 μM Oridonin | 0.167 ± 0.016 | 0.054 ± 0.003*** | 23.650 ± 0.061** |
| NAC + 50 μM Oridonin | 0.169 ± 0.006 | 0.041 ± 0.002*## | 23.977 ± 0.046## |
| NAC | 0.174 ± 0.002 | 0.035 ± 0.003 | 24.080 ± 0.090 |
All groups are compared with control group, n = 3,
p < 0.05
p < 0.01
p < 0.001, and 2.5 μM MNAC + 50 μM oridonin treated group is also compared with 50 μM oridonin treated group
p < 0.05
p < 0.01.
The energy barrier height G, which describes how difficult the reaction occurs, is another significant parameter for the study of energy landscapes of ligand-receptor dissociation. The activation energy ∆G0 is defined as the minimum energy required to start a chemical reaction, which is the minimum energy required for EGF-EGFR dissociation in KYSE-150 cells here. As reported previously, the activation energy ∆G0 for dissociation in absence of external force is evaluated as the following model [30,31]:
where τD = 10−9 s as reported. Based on this model, we further evaluated the activation energy ∆G0 for EGF-EGFR dissociation in living KYSE-150 cells to understand the effects of oridonin on the activation energy ∆G0 for EGF-EGFR dissociation. The obtained results (Table 1) demonstrated that the activation energy for EGF-EGFR complex decreased from 24.043 ± 0.114 kBT in control KYSE-150 cells to 23.987 ± 0.058 kBT, 23.743 ± 0.105 kBT and 23.650 ± 0.061 kBT for 10μM, 30μM and 50μM oridonin treated KYSE-150 cells, respectively. However, with the pretreatment with NAC, the activation energy for EGF-EGFR complex in control and 50μM oridonin treated KYSE-150 cells was 23.997 ± 0.046 kBT and 24.080 ± 0.090 kBT, respectively (Table 1). As our expected, the activation energy ∆G0 for EGF-EGFR dissociation decreased after oridonin treatment, which suggested that the EGF-EGFR complex in oridonin treated KYSE-150 cells were easier to dissociate compared with that in control cells. However, the pretreatment with NAC, which could remove the intracellular ROS induced by oridonin, inhibited oridonin decreased activation energy ∆G0 for EGF-EGFR dissociation, also suggesting that ROS is the key point for oridonin induced EGF-EGFR dissociation in KYSE-150 cells.
4. Discussion
Although oridonin was found to inhibit EGFR expression in KYSE-150 cells by western blot analysis, the detailed effects of ori-donin on EGFR function was still poor understood. EGF is the native ligand for EGFR and the binding of EGF-EGFR could always initiate the EGFR downstream signaling events to worsen the development of tumor. To investigate the effects of oridonin on EGFR functions in KYSE-150 cells, AFM-SMFS was applied to detect the interac-tion between EGF and EGFR in living KYSE-150 cells. Oridonin was found to inhibit the binding between EGF and EGFR, which included the decreased unbinding force and decreased binding probability. Unbinding force is a parameter that describes the force to break the ligand-receptor complex. The decreased unbinding force for EGF-EGFR complexes demonstrated that the binding of EGF-EGFR complexes were nuch weaker after oridonin treatment because much lower force was needed to break these complexes, which also meant that the EGF-EGFR complexes were less stable after oridonin treatment. Binding probability is a parameter that can also reflect the expression level of receptor in living cells, which there-fore shows the similar results with the results obtained by Western Blot. The remove of excessive intracellular ROS induced by oridonin could dramatically reverse oridonin inhibited EGF-EGFR binding in KYSE-150 cells, indicating that ROS played a critical role in oridonin inhibited EGF-EGFR binding.
The dissociation kinetics of ligand-receptor complexes were very useful to understand the inner mechanism of ligand-receptor interactions, which thus could be applied to determine the potential mechanism of drug treated cells [26]. By dissociation kinetics calculation based on AFM results, oridonin was found to induce decreased energy barrier width and decreased activation energy of EGF-EGFR complexes in KYSE-150 cells. These two parameters describe the energy landscape for the dissociation of ligand-receptor complex. Thus, the obtained results also suggested the less stable property of EGF-EGFR complex in KYSE-150 cells after oridonin treatment. And additionally, the dissociation off rate con-stant of EGF-EGFR complexes increased with oridonin treatment, which also implied that the EGF-EGFR complexes in KYSE-150 cells were more easily to dissociate after oridonin treatment. And very interestingly, we also found that the remove of excessive intracel-lular ROS induced by oridonin could dramatically reverse oridonin induced energy barrier width decrease, activation energy decrease and dissociation off rate constant increase of EGF-EGFR complexes in KYSE-150 cells, which further demonstrated the critical role of ROS in oridonin inhibited EGF-EGFR binding.
It was also worth to note that, using AFM-SMFS, we also found that probing EGF-EGFR interactions might also reflect the intracellular ROS level in KYSE-15 cells. Intracellular ROS, as one of the key factors that regulates cell metabolism and function, is also proved to play very important roles in cancer development and cancer death [32,33]. Therefore, the induction of excessive ROS in cancer cells has been developed into an important strategy for new anticancer drug development. And additionally, the function of EGFR in cancer cells is also closely related to the intracellular ROS level, which therefore leads to a lot of anticancer drugs that could both affect the EGFR function and ROS function in cancer cells [34–36]. Our results demonstrated that oridonin could dramatically inhibit EGF-EGFR interactions through decreasing the unbinding force, decrease the binding probability, decreasing the energy barrier width, increasing the dissociation off rate constant and decreasing the activation energy in ROS dependent way. These results thus proposed the possibility of AFM-SMFS as a cell surface detection nanotechnique, could also be developed to monitor intracellular ROS level by probing cell membrane receptors, which however, still needs to be further validated. And additionally, further investigations on the mechanism of how oridonin induced ROS reflects EGF-EGFR binding may provide a deeper insight into the anticancer mechanism of oridonin and contribute to the use of oridonin for clinical cancer treatment.
Taking the results obtained here by AFM into account, we proposed a potential mechanism for oridonin targeted EGFR therapy in KYSE-150 cells through an indirect way (Fig. 9). Oridonin could induce ROS production in KYSE-150 cells, which could directly inhibit the expression of EGFR and induce ROS-dependent apoptosis of KYSE-150 cells. Then, AFM-SMFS results demonstrated that oridonin could inhibit the binding between EGF and EGFR in KYSE-150 cells by decreasing the energy barrier width, decreasing the activation energy and increasing the dissociation off-rate constant by the regulation of excessive intracellular ROS induced by oridonin. And additionally, the inhibition of EGF-EGFR binding could therefore inhibit EGFR downstream pathways to induce KYSE-150 cell death. These AFM results provide novel information about the binding between EGF and EGFR in KYSE-150 cells at single molecule level, and also enhance our understanding about how oridonin inhibit EGFR signaling events by inhibiting EGF-EGFR binding, which is very important for the pharmacological studies of oridonin against EGFR in living cancer cells.
Fig. 9.
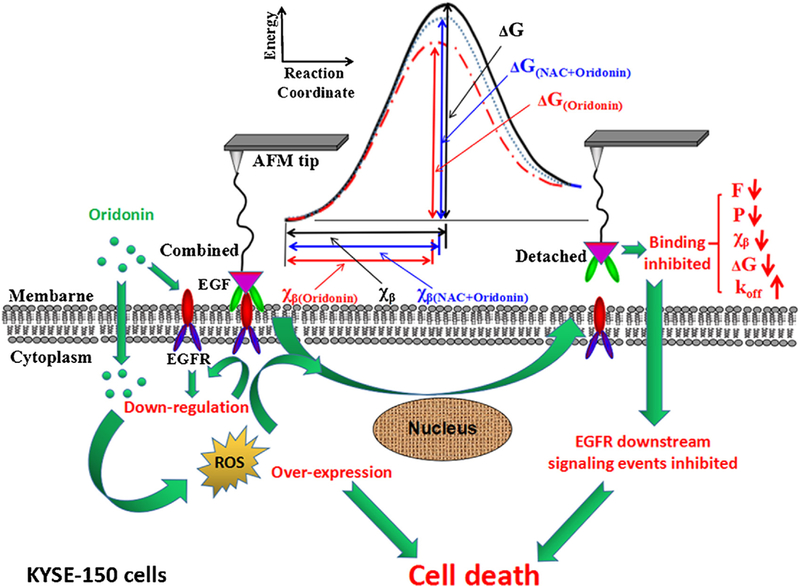
Schematic diagram illustrating the molecular mechanism of oridonin inhibited EGF-EGFR binding and cell death by ROS dependent way in KYSE-150 cells. F, P, xβ, koff and ΔG is the unbinding force, binding probability, energy barrier width, dissociation off-rate constant and activation energy for EGF-EGFR complex on the surface of KYSE-150 cells, respectively.
5. Conclusion
In summary, using EGF functionalized AFM tips, this work proved that oridonin could decrease the unbinding force and binding probability between EGF and EGFR in KYSE-150 cells by decreasing the energy barrier width, decreasing the activation energy and increasing the dissociation off-rate constant of EGF-EGFR complexes in ROS dependent way. And for the first time, we also demonstrated the intracellular ROS level in cancer cells could also be reflected by the investigation of cell membrane ligand-receptor interactions. These results collectively suggested that oridonin was a strong anticancer agent that targeting EGF-EGFR interactions in ROS dependent way. More importantly, this work also highlighted AFM-SMFS as a powerful nanotool for pharmacodynamic studies by detecting ligand-receptor interactions, which could not only dramatically extend our understanding of pharmacological effects of drugs into single molecule level, but could also be further developed into a promising tool for screening and mechanism studies of drugs.
Acknowledgements
This work was financially supported by Macau Science and Technology Development Fund (No.028/2014/A1) and the NIH RO1 grants (HL64560/OD015092/AI106590/HL129887).
Footnotes
Conflict of interests
The authors declare that they have no conflict of interests.
Appendix A. Supplementary data
Supplementary data associated with this article can be found, in the online version, at http://dx.doi.org/10.1016/j.phrs.2016.11.036.
References
- [1].Oda K, Matsuoka Y, Funahashi A, Kitano H, A comprehensive pathway map of epidermal growth factor receptor signaling, Mol. Syst. Biol 1 (2005) (2005) 0010. [DOI] [PMC free article] [PubMed] [Google Scholar]
- [2].Appert-Collin A, Hubert P, Cremel G, Bennasroune A, Role of erbb receptors in cancer cell migration and invasion, Front. Pharmacol 6 (2015) 283. [DOI] [PMC free article] [PubMed] [Google Scholar]
- [3].Mitsudomi T, Yatabe Y, Epidermal growth factor receptor in relation to tumor development: egfr gene and cancer, FEBS J 277 (2010) 301–308. [DOI] [PubMed] [Google Scholar]
- [4].Lin G, Sun XJ, Han QB, Wang Z, Xu YP, Gu JL, Wu W, Zhang GU, Hu JL, Sun WY, Mao WM, Epidermal growth factor receptor protein overexpression and gene amplification are associated with aggressive biological behaviors of esophageal squamous cell carcinoma, Oncol. Lett 10 (2015) 901–906. [DOI] [PMC free article] [PubMed] [Google Scholar]
- [5].Cui Y, Dong C, Wu BQ, Duan XC, Shi G, Gong M, Wang TY, Expression of cyclooxygenase-2, vascular endothelial growth factor, and epidermal growth factor receptor in chinese patients with esophageal squamous cell carcinoma, J. Cancer Res. Ther 11 (Suppl. 1) (2015) C44–C48. [DOI] [PubMed] [Google Scholar]
- [6].Wang CY, Deng JY, Cai XW, Fu XL, Li Y, Zhou XY, Wu XH, Hu XC, Fan M, Xiang JQ, Zhang YW, Chen HQ, Perez R, Jiang GL, Zhao KL, High egfr and low p-akt expression is associated with better outcome after nimotuzumab-containing treatment in esophageal cancer patients: preliminary clinical result and testable hypothesis, Oncotarget 6 (2015) 18674–18682. [DOI] [PMC free article] [PubMed] [Google Scholar]
- [7].Mohamed A, El-Rayes B, Khuri FR, Saba NF, Targeted therapies in metastatic esophageal cancer: advances over the past decade, Crit. Rev. Oncol. Hematol 91 (2014) 186–196. [DOI] [PubMed] [Google Scholar]
- [8].Owona BA, Schluesener HJ, Molecular insight in the multifunctional effects of oridonin, Drugs R. D 15 (2015) 233–244. [DOI] [PMC free article] [PubMed] [Google Scholar]
- [9].Zhao Z, Chen Y Oridonin, a promising antitumor natural product in the chemotherapy of hematological malignancies, Curr. Pharm. Biotechnol 15 (2014) 1083–1092. [DOI] [PubMed] [Google Scholar]
- [10].Liu Z, Ouyang L, Peng H, Zhang WZ, Oridonin: targeting programmed cell death pathways as an anti-tumour agent, Cell Proliferat 45 (2012) 499–507. [DOI] [PMC free article] [PubMed] [Google Scholar]
- [11].Yu Y, Fan SM, Ye YC, Tashiro S, Onodera S, Ikejima T, The tyrphostin ag1478 augments oridonin-induced a431 cell apoptosis by blockage of jnk mapk and enhancement of oxidative stress, Free Radic. Res 46 (2012) 1393–1405. [DOI] [PubMed] [Google Scholar]
- [12].Li D, Wu LJ, Tashiro SI, Onodera S, Ikejima T, Oridonin induces human epidermoid carcinoma a431 cell apoptosis through tyrosine kinase and mitochondrial pathway, J. Asian Nat. Prod. Res 10 (2008) 77–87. [DOI] [PubMed] [Google Scholar]
- [13].Li D, Wu LJ, Tashiro S, Onodera S, Ikejima T, Oridonin inhibited the tyrosine kinase activity and induced apoptosis in human epidermoid carcinoma a431 cells, Biol. Pharm. Bull 30 (2007) 254–260. [DOI] [PubMed] [Google Scholar]
- [14].Li D, Wu LJ, Tashiro SI, Onodera S, Ikejima T, Oridonin-induced a431 cell apoptosis partially through blockage of the ras/raf/erk signal pathway, J. Pharmacol. Sci 103 (2007) 56–66. [DOI] [PubMed] [Google Scholar]
- [15].Kang N, Zhang JH, Qiu F, Tashiro S, Onodera S, Ikejima T, Inhibition of egfr signaling augments oridonin-induced apoptosis in human laryngeal cancer cells via enhancing oxidative stress coincident with activation of both the intrinsic and extrinsic apoptotic pathways, Cancer Lett 294 (2010) 147–158. [DOI] [PubMed] [Google Scholar]
- [16].Xiao X, He Z, Cao W, Cai F, Zhang L, Huang Q, Fan C, Duan C, Wang X, Wang J, Liu Y, Oridonin inhibits gefitinib-resistant lung cancer cells by suppressing egfr/erk/mmp-12 and cip2a/akt signaling pathways, Int. J. Oncol 48 (2016) 2608–2618. [DOI] [PubMed] [Google Scholar]
- [17].Elbourne A, McLean B, Voitchovsky K, Warr GG, Atkin R, Molecular resolution in situ imaging of spontaneous graphene exfoliation, J. Phys. Chem Lett 311 (2016) 3118–3122. [DOI] [PubMed] [Google Scholar]
- [18].Deniset-Besseau A, Prater CB, Virolle MJ, Dazzi A, Monitoring triacylglycerols accumulation by atomic force microscopy based infrared spectroscopy in streptomyces species for biodiesel applications, J. Phys. Chem. Lett 5 (2014) 654–658. [DOI] [PubMed] [Google Scholar]
- [19].Puntheeranurak T, Neundlinger I, Kinne RK, Hinterdorfer P, Single-molecule recognition force spectroscopy of transmembrane transporters on living cells, Nat. Protoc 6 (2011) 1443–1452. [DOI] [PubMed] [Google Scholar]
- [20].Carvalho FA, Connell S, Miltenberger-Miltenyi G, Pereira SV, Tavares A, Ariens RAS, Santos NC, Atomic force microscopy-based molecular recognition of a fibrinogen receptor on human erythrocytes, ACS Nano 4 (2010) 4609–4620. [DOI] [PubMed] [Google Scholar]
- [21].Kawas LH, Benoist CC, Harding JW, Wayman GA, Abu-Lail NI, Nanoscale mapping of the met receptor on hippocampal neurons by afm and confocal microscopy, Nanomedicine 9 (2013) 428–438. [DOI] [PubMed] [Google Scholar]
- [22].Zhao W, Cai M, Xu H, Jiang J, Wang H, A single-molecule force spectroscopy study of the interactions between lectins and carbohydrates on cancer and normal cells, Nanoscale 5 (2013) 3226–3229. [DOI] [PubMed] [Google Scholar]
- [23].Xiao L, Chen Q, Wu Y, Qi X, Zhou A, Simultaneous topographic and recognition imaging of epidermal growth factor receptor (egfr) on single human breast cancer cells, Biochim. Biophys. Acta 1848 (2015) 1988–1995. [DOI] [PubMed] [Google Scholar]
- [24].Zhang J, Liu H, Zhu R, Hinterdorfer P, Zhang B, Tang J, Single molecular dissection of the ligand binding property of epidermal growth factor receptor, Analyst 138 (2013) 5325–5331. [DOI] [PubMed] [Google Scholar]
- [25].Zhang L, Yang F, Cai JY, Yang PH, Liang ZH, In-situ detection of resveratrol inhibition effect on epidermal growth factor receptor of living mcf-7 cells by atomic force microscopy, Biosens. Bioelectron 56 (2014) 271–277. [DOI] [PubMed] [Google Scholar]
- [26].Zhang X, Shi X, Xu L, Yuan J, Fang X, Atomic force microscopy study of the effect of her 2 antibody on egf mediated erbb ligand-receptor interaction, Nanomedicine 9 (2013) 627–635. [DOI] [PubMed] [Google Scholar]
- [27].Kao FS, Ger W, Pan YR, Yu HC, Hsu RQ, Chen HM, Chip-based protein–protein interaction studied by atomic force microscopy, Biotechnol. Bioeng 109 (2012) 2460–2467. [DOI] [PubMed] [Google Scholar]
- [28].Bell GI, Models for the specific adhesion of cells to cells, Science 200 (1978) 618–627. [DOI] [PubMed] [Google Scholar]
- [29].Merkel R, Nassoy P, Leung A, Ritchie K, Evans E, Energy landscapes of receptor-ligand bonds explored with dynamic force spectroscopy, Nature 397 (1999) 50–53. [DOI] [PubMed] [Google Scholar]
- [30].Bieri O, Wirz J, Hellrung B, Schutkowski M, Drewello M, Kiefhaber T, The speed limit for protein folding measured by triplet–triplet energy transfer, Proc. Natl. Acad. Sci. U. S. A 96 (1999) 9597–9601. [DOI] [PMC free article] [PubMed] [Google Scholar]
- [31].Nunes JM, Hensen U, Ge L, Lipinsky M, Helenius J, Grubmuller H, Muller DJ, A force buffer protecting immunoglobulin titin, Angew. Chem. Int. Ed. Engl 49 (2010) 3528–3531. [DOI] [PubMed] [Google Scholar]
- [32].Hecht F, Pessoa CF, Gentile LB, Rosenthal D, Carvalho DP, Fortunato RS, The role of oxidative stress on breast cancer development and therapy, Tumour Biol 37 (2016) 4281–4291. [DOI] [PubMed] [Google Scholar]
- [33].Tochhawng L, Deng S, Pervaiz S, Yap CT, Redox regulation of cancer cell migration and invasion, Mitochondrion 13 (2013) 246–253. [DOI] [PubMed] [Google Scholar]
- [34].Mondal A, Biswas R, Rhee YH, Kim J, Ahn JC, Sulforaphene promotes bax/bcl2, mapk-dependent human gastric cancer ags cells apoptosis and inhibits migration via egfr, p-erk1/2 down-regulation, Gen. Physiol. Biophys 35 (2016) 25–34. [DOI] [PubMed] [Google Scholar]
- [35].Hwang H, Biswas R, Chung PS, Ahn JC, Modulation of egfr and ros induced cytochrome c release by combination of photodynamic therapy and carboplatin in human cultured head and neck cancer cells and tumor xenograft in nude mice, J. Photochem. Photobiol. B 128 (2013) 70–77. [DOI] [PubMed] [Google Scholar]
- [36].Palanivel K, Kanimozhi V, Kadalmani B, Akbarsha MA, Verrucarin an induces apoptosis through ros-mediated egfr/mapk/akt signaling pathways in mda-mb-231 breast cancer cells, J. Cell. Biochem 115 (2014) 2022–2032. [DOI] [PubMed] [Google Scholar]