

Abstract
Previous studies have proposed that selecting which hand to use for a reaching task appears to be modulated by a factor described as “task difficulty,” defined by either the requirement for spatial precision or movement sequences. However, we previously reported that analysis of the movement costs associated with even simple movements plays a major role in hand selection. We further demonstrated, in right-handers, that cognitive-perceptual loading modulates hand selection by interfering with the analysis of such costs. It has been reported that left-handers tend to show less dominant-hand bias in selecting which hand to use during reaching. We therefore hypothesized that hand selection would be less affected by cognitive-perceptual loading in left-handers than in right-handers. We employed a visual search task that presented different levels of difficulty (cognitive-perceptual load), as established in previous studies. Our findings indicate that left-handed participants tend to show greater modulation of hand selection by cognitive-perceptual loading than right-handers. Left-handers showed lower dominant hand reaction times than right-handers, and greater high-cost movements that reached to extremes of the contralateral workspace under the most difficult task conditions. We previously showed in this task that midline-crossing has high-energy and time costs and that they occur more frequently under cognitively demanding conditions. The current study revealed that midline-crossing was associated with the lowest reaction times, in both handedness groups. The fact that left-handers showed lower dominant hand reaction times, and a greater number of high-cost cross-midline reaches under the most cognitively demanding conditions suggests that these actions were erroneous.
Keywords: Cognitive-perceptual load, Hand selection, Reaching, Task difficulty, Left-hander
Introduction
Most individuals tend to prefer one hand for carrying out a variety of unimanual tasks, including reaching for objects, but will also choose the non-preferred hand under some conditions (Fagard, 2013; Scharoun & Bryden, 2014). While the process of choosing which hand to use for a given unimanual task is not well understood, it appears to recruit cognitive resources to evaluate movement costs (Przybyla, Good, & Sainburg, 2012; Liang, Wilkinson, & Sainburg, 2018). The cognitive nature of this process belies the apparent automaticity of simple reaching movements, and the fact that we do not consciously think about which hand to use in most reaching situations. Nevertheless, Rosenbaum’s (1980) seminal work has demonstrated that even simple actions, such as reaching to targets, invoke cognitive decision making processes to plan many aspects of the movement, including which hand to use. Rosenbaum measured reaction time under different pre-cued conditions, varying the amount of information about the impending movement that was provided to participants prior to the “go” signal. The results indicated that as more information was provided prior to the movement about the direction, distance, and which hand to use, reaction time was systematically reduced. In fact, this reduction was most substantial when the hand was pre-cued, indicating the large cognitive cost of choosing which hand to use. The complex nature of this decision process is emphasized by the fact that biomechanical and accuracy costs are also taken into account when deciding which hand to use for a given movement (Leconte & Fagard, 2006; Przybyla et al., 2012; Coelho, Przybyla, Yadav, & Sainburg, 2013). For example, Przybyla et al. (2012) showed that participants increased their choice to use the non-dominant hand, under no-vision conditions, when non-dominant hand use became more advantageous to task performance, suggesting that a cost-analysis might underlie arm selection processes that occur prior to reaching movements. Similarly, Stoloff and colleagues (2011) showed that participants increased non-dominant hand selection when noise was introduced to one or the other hand, which provided more direct evidence of the cost- analysis underlying hand selection process. Thus, deciding which hand to reach with appears to invoke cognitive processes that strive to minimize a variety of movement costs that vary depending on task goals (Gabbard & Rabb, 2000; Stoloff, Taylor, Xu, Ridderikhoff, & Ivry, 2011; Przybyla et al., 2012).
In an attempt to better understand this process, some studies have focused on how workspace location of targets influences hand choice (Bishop, Ross, Daniels, & Bright, 1996; Gabbard, 1998; Gabbard, Helbig, & Gentry, 2001; Mamolo, Roy, Bryden, & Rohr, 2004; Leconte & Fagard, 2006; Przybyla, Coelho, Akpinar, Kirazci, & Sainburg, 2013). It has become clear that reaching to different locations in the workspace can elicit different choices to use one hand or the other. Not surprisingly, when reaching to the right or left lateral workspace, individuals most commonly use the hand that is ipsilateral to the target location. However, when reaching to the workspace close to the midline, the dominant hand is used most often; a right-handed individual will typically reach for objects close to midline, on either side, with the right dominant hand (Bishop et al., 1996; Mamolo et al., 2004). Yet the tendency to cross the midline with the dominant hand might be enhanced when the task is more “complex” (Gabbard, 1998; Gabbard, Helbig & Gentry, 2001; Leconte & Fagard, 2006; Pryzyla et al., 2013; Gonzalez, Flindall, & Stone, 2015). For example, one will use the dominant hand to cross midline more often when a task requires manipulation of a tool, as compared to simply pointing to or grasping a target object (Steenhuis & Bryden, 1999; Mamolo et al., 2004; Hill & Khanem, 2009). However, the role of task “complexity” in this process has been called into question by Bryden, Pryde, and Roy (2000) and Bryden and Roy (2006). They examined whether the requirement to pick up and toss an object versus simply orient and place the object in a slot would elicit different hand choices, but these task conditions failed to modulate hand choice. Whereas object and target location in the workspace clearly modulates hand choice, the role of task complexity is probably related to how “complexity” is operationally defined in a given study.
In order to better understand the role of cognitive processes in hand selection, we previously exploited a visual memory and search task to vary the cognitive load required under three different conditions (Liang et al., 2018). We used 16 symbols, which were line drawings of clothing, with subsets of four items colored blue, red, yellow, or brown. Participants were shown a single symbol (line drawing) in the middle of the workspace on a mirror positioned above the table on which their hands rested. After viewing the symbol for 1.5 seconds, a new display was shown. In the control condition, the same single symbol appeared at some location in the workspace. In the experimental conditions, the symbol appeared among 15 other symbols either clustered into four different same-color quadrants of the workspace or randomly scattered across the workspace. In either of these 16-symbol conditions, the participant was required to visually scan the workspace to find the previously displayed target stimulus and reach a hand to it.
Previous research (Wilkinson & McIlvane, 2013; Wilkinson, O’Neill, & McIlvane, 2014; Liang et al., 2018) has demonstrated that the different conditions presented participants with varied cognitive-perceptual requirements (Figure 1). In the control condition, only one symbol was shown, requiring neither memory of the previously displayed stimulus nor visual scanning of competing stimuli. In the other two conditions (16 symbols), the participants visually scanned the workspace in order to find the previously presented stimulus. The targets and the movements required to reach those targets were matched across all three conditions. Therefore, any change in the hand choices between conditions should not be due to condition-related differences in movement costs. Our previous study demonstrated that under the control condition (Figure 1A), with the least cognitive load, reaction times were shortest, and participants crossed midline the least (Liang et al., 2018). Because crossing midline required longer distance, time, and energy movements, this performance (i.e., not crossing the midline) was interpreted as optimal. Consistent with findings in visual search studies (Wilkinson & McIlvane, 2013; Wilkinson et al., 2014), as progressively greater cognitive demands were required, participants had greater reaction times, and made more midline crossings. We interpreted these findings as indicating that the more demanding conditions interfered with hand selection decisions, and thus resulting in increased random choices, leading to more crossing of midline with both hands (dominant and nondominant). Such suboptimal performance under the cognitive-perceptually demanding condition suggests that cognitive processes are engaged to avoid costly actions such as midline crossing. Our findings were consistent with previous studies (Pryzbyla et al., 2012) indicating that hand selection requires substantial cognitive resources that consider various movement-related costs.
Figure 1.
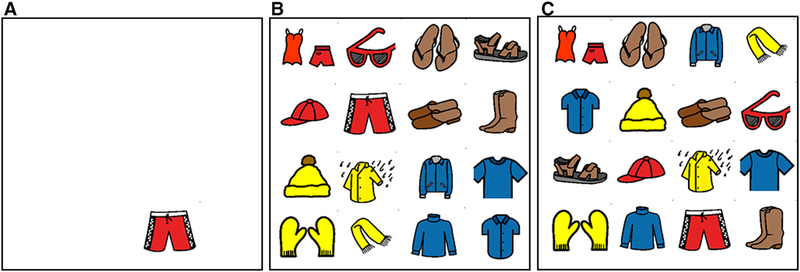
Experimental Conditions. Figure reproduced from Liang et al. (2018). One-symbol control condition (A) means that only the target symbol was displayed. Clustered condition (B) means that symbols were clustered based on internal colors (red, brown, blue, and yellow). Distributed condition (C) means that adjacent symbols were not sharing any internal colors. The Picture Communication Symbols© 1981–2016 by Tobii Dynavox. All Rights Reserved Worldwide. Used with permission. Boardmaker® is a trademark of Tobii Dynavox.
Participants in our previous study were exclusively right-handed. Left-handers tend to show greater symmetry in their motor behavior (Oldfield, 1971; Bryden, 1977; Borod, Caron, & Koff, 1984), and it is therefore possible that they might show different effects of cognitive loading on hand-selection. Compared to right-handers, left-handers tend to exhibit significantly less frequent use of their dominant hand (Doyen, Duquenne, Nuques, & Carlier, 2001; Gurd, Schulz, Cherkas, & Ebers, 2006), reflecting less behavioral lateralization. Neural imaging studies indicate that left-handers show less strongly and more variably lateralized activation patterns in motor related regions and networks during voluntary movements, as compared to right-handers (Klöppel et al., 2007; van den Berg, Swinnen, & Wenderoth, 2011; Pool, Rehme, Fink, Eickhoff, & Grefkes, 2014). For example, the left hemisphere is consistently reported to be more activated in ipsilateral hand movement tasks than the right hemisphere in right-handers (e.g., Verstynen et al., 2005). In contrast, left-handers showed less ipsilateral activation in primary motor cortex (M1) than right-handed counterparts during a repetitive finger-thumb opposition task (Kim et al., 1993). Similarly van den Berg et al. (2011) showed that transcranial magnetic stimulation applied to contralateral consistently disrupted the timing of dominant hand unimanual finger tapping in right-handers. However, the effect is less consistent in left-handers, such that some left-handed participants showed more disruptions when the nondominant (left) M1 was stimulated whereas other left-handers showed more disruptions when the dominant (right) M1 was stimulated (van den Berg et al., 2011). These findings suggest that left-handers, at least as a group, might be less lateralized than right-handers.
In the current study, we ask whether the differences in neural and behavioral lateralization between left- and right- handers result in differences in hand selection, compared to right-handers, and how hand selection is modulated by cognitive-perceptual load. Given previous reports on reduced dominant-arm bias in left-handers, it is reasonable to predict that the left-handed participants would exhibit less frequent midline crossings as the cognitive load increases. For the reaction time measure, asymmetries favoring the right hemisphere (left-hand advantage in reaction time) have not been explored in left-handers (Johnstone and Carey, 2016). Based on the few studies (e.g., Barthélémy & Boulinguez, 2001) suggesting left-hand advantage in left-handers linked to right hemisphere specialization on motor preparation, we expect shorted reaction times in the dominant left hand of the left-handers than the dominant right hand of the right-handed counterparts. Finally, midline crossing (contralateral reaching) is often thought to constitute a more complex skill that is a biomechanically less efficient action than ipsilateral movements. Such increments in complexity and biomechanical inefficiency presumeably lead to an increased difficulty in preparation of the movement (Henry and Rogers, 1960; Leconte & Fagard, 2006). We therefore predicted that longer reaction times would be associated with a lower percentage of midline crossing in right-handers. We further speculated that if left-handers have weaker dominant arm bias in midline crossing as well as a weaker left-arm advantage in reaction time compared to right-handed counterparts, then the negative association of reaction time with midline crossing predicted in the right-handers may simply not apply to left-handed participants, resulting in either a positive or zero relationship between these two variables.
Experimental Procedures
Participants
Participants were 10 left- and 10 right- handed (as indicated by self-report) young adult participants who were enrolled in college or who had successfully gained a college degree. Participants were age- and gender- matched, with a mean age of 23 years old; half were males. The sample size was determined through power analysis based on our precedent report (Liang et al., 2018), as well as an a priori power analysis using using GPower (Faul, Erdfelder, Lang, & Buchner, 2007) indicating a sample size of 6 for detecting a significant effect at repeated measures ANOVA with a power of 0.80, an alpha of 0.05 and an effect size of 0.25. As described in the Experimental Procedure, each participant completed 48 trials for each experimental condition which also helped to provide representative sample. Informed consent was obtained from each participant after the nature of the study had been explained. All procedures were approved via the Institutional Review Board at the Pennsylvania State University.
Stimulus Materials
As in previous studies (Wilkinson & McIlvane, 2013; Liang et al., 2018), stimuli were16 line-drawing picture symbols taken from the Mayer Johnson Boardmaker symbol set (PCS; Mayer-Johnson, 1992). They were divided into four subsets of symbols (Figure 1B or 1C) that shared an internal color: four items worn on the feet (brown), four worn on the torso (blue), four summertime items (red), and four inclement weather items (yellow). Semantic or categorical relations within each set of symbols were loose and their physical shapes were quite dissimilar. For instance, within the summertime item set, the baseball cap and the swimsuits were both red, but differed in shape.
Experimental Set-up and Data Collection
We followed the same protocol used in our previous study (Liang et al., 2018). Participants sat in a raised chair and faced a horizontal workspace (Figure 2A). Arms rested on and were gently strapped onto air sleds, to minimize the effects of friction and gravity, and thus diminish the potential for fatigue to influence our findings. A mirror, positioned above the workspace, reflected stimuli that were projected by an overhead television. Although the participants’ hands were beneath the mirrored workspace, their location relative to the display was indicated via small cursors (green crosses) on the mirror surface (Figure 2B), such that when the participant moved their hands the cursors moved in tandem. Participants’ hands were placed under the mirrored surface rather than over the stimulus display to allow the participants to see the display at all times without occlusion by their own hands. We chose the starting hand positions as were used in a number of hand choice studies (Przybyla et al., 2012; Coelho et al., 2013). These hand positions are comfortable for the horizontal table set-up, and provide symmetric access to all stimuli from a midline to lateral axis for each hand. The stimuli were displayed with custom software written in REALbasic (REAL Software). A six-degree-of-freedom Trackstar (Northern Digital Technology) magnetic tracking system sampled limb positions and orientations at a rate of 116 Hz. For motion tracking, we digitized the bony structures in each limb as described in Liang et al. (2018).
Figure 2.

Schematics of the Experimental Apparatus (A) and Task (B). Figure reproduced from Liang et al. (2018).There was an array of either 1 or 16 symbols (see Figure 1 for details). FOB, Fight of Birds sensor. Cursors (green) representing left and right hand positions were displaced 30 cm to the center of the workspace. The Picture Communication Symbols© 1981–2016 by Tobii Dynavox. All Rights Reserved Worldwide. Used with permission. Boardmaker® is a trademark of Tobii Dynavox.
We processed the data with custom programs written in IgorPro (WaveMetrics). We low-pass filtered the displacement data at 8 Hz with a third-order dual-pass Butterworth filter before differentiation to obtain velocity and acceleration profiles. Because there were minor oscillations of the cursors in the start circle, we defined the start of each reach as the first minimum in tangential velocity that was under 8% of the maximum velocity for that trial. Likewise, we defined the end of each reach as the first minimum following peak velocity that was below 8% of maximum velocity. The start and end point of movement were verified manually, and corrected if necessary.
Experimental Procedure
Identical to our previous study (Liang et al., 2018), the task was a 0-delay identity matching to sample task. When participants had placed their hands within the two green circles on the reflected display, a “sample” appeared in the midline of the display. This sample was one of the line drawings from the set of 16 symbols. The sample was displayed for 1.5 seconds and then disappeared, being replaced by one of the choice arrays for the experimental conditions. The participants’ task was to move whichever hand they wanted to the line drawing in the choice array that was identical to the sample they had just seen, and no further instruction was given. Correct selections resulted in the ringing of a chime and an accumulation of “points” presented on the computer screen.
Experimental Conditions and Session Design
As in our previous study in right-handers (Liang et al., 2018), all participants received 48 trials for each condition. The positions of the stimuli were pseudorandomized between trials, such that participants could not predict the target location on any given trial. The influence of practice effects on the performances of interest was also minimized. Trials of the same condition were grouped into a block. Each of the 16-symobl conditions had an associated one-symbol condition, resulting in four blocks of 48 trials (total = 192 trials). The order of these sessions was quasi-randomly counterbalanced, such that a one-symbol condition (control) was always presented first; otherwise, the order in which participants experienced the 16-symbol conditions (clustered/ distributed) was counterbalanced.
Data Analysis
Four independent variables were examined: experimental condition (control, clustered, distributed), target column, hand (dominant, non-dominant hand), and handedness group (left- and right-handed). Target column was defined spatially and was adjusted for hand dominance of each handedness group. Specifically, for columns from left to right (columns 1–4), the four spaces ipsilateral (closest) to the dominant hand were identified as ipsilateral column (column 1 for left-handers, column 4 for right-handers), the four spaces medial to and on the same side of dominant hand as ipsimedial column (column 2 for left-handers, column 3 for right-handers), the four spaces medial to but not on the same side of the dominant hand (column 3 for left-handers, column 2 for right-handers), and the four spaces contralateral to (farthest) to the dominant hand as contralateral column (column 4 for left-handers, column 1 for right-handers). Target column was included as an independent variable in order to examine whether visual-perceptual characteristics (experimental condition) influenced the production of ipsilateral vs contralateral reaches and their temporal performance (reaction time) within and between left- and right- handers.
Outcome measures were proportion of midline crossings (percentage) and reaction time (seconds). Reaction time was the time between the imperative “go” signal and the beginning of movement. It is thought to reflect cognitive processes in movement preparation, in which the more complex the task condition is associated with longer reaction time (Henry & Rogers, 1960; Rosenbaum, 1980; Ghez, Hening, & Gordon, 1991). Repeated measures ANOVA examined the influence of the four independent variables on the outcome measures. We next examined the linear relationship between reaction time and the percentage of contralateral reaches, and therefore used R (R Core Team, 2014) and lme4 (Pinheiro et al., 2018) to perform a linear mixed effects analysis. As fixed effects, we entered reaction time of each participant into the model as our predicting variable. As random effects, we had intercepts for participants to account for any non-independence by assuming a different “baseline” percentage of contralateral reaches for each participant.
Results
Cognitive Load Modulates Hand Selection More in Left-Handers
Figure 3 shows the proportion of hand reaches averaged across participants for each hand and for each target, for each condition. Each circular pie-graph represents the percentage value of one target. The column positions are displayed in a right-hand coordinate system for direct between-hand comparison. Thus, the right-most column is ipsilateral (IL in Figure 3) to the dominant hand, regardless of whether that hand is the right (right-handers), or left hand (left-handers). The proportion of reaches with the dominant hand is shown in black, with the non-dominant hand in grey. The upper panels show the results for left-handers while the lower panels show data for right-handers. “Control” panels show the results for the control condition, with “Clustered” panels for the clustered condition, and “Distributed” panels for the distributed condition. Thus, the degree of cognitive load of the task is ordered from left (“Control” panels; low cognitive load) to right (panels “Distributed”; high cognitive load).
Figure 3.
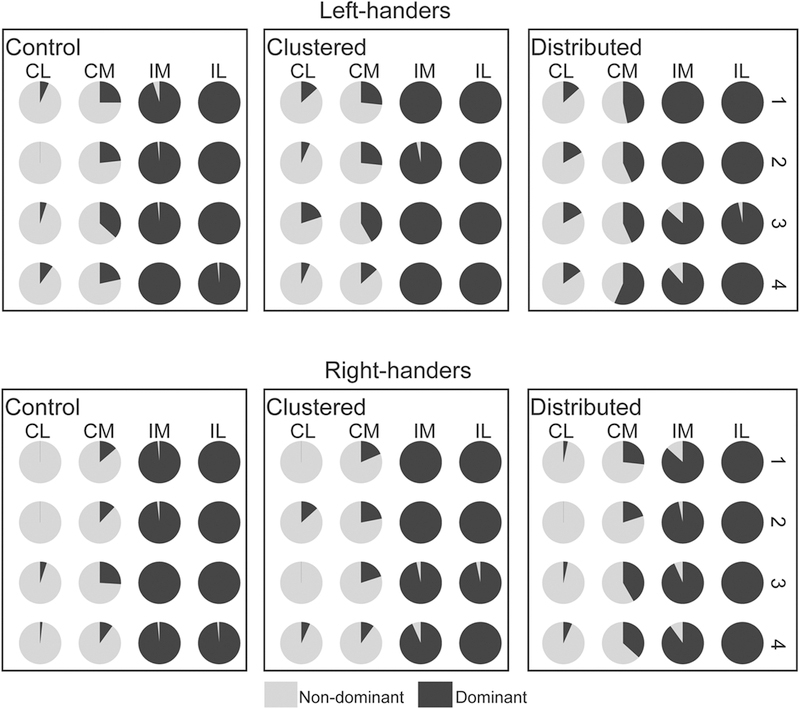
Proportion of Contralateral Reaches (Midline-crossing) by Both Hands across Conditions, in Left- and Right- handed Participants. Means were computed across participants (n = 10 for each handedness group). Each target is shown as a circular pie-graph (light grey area for non-dominant hand, and black area for dominant hand). The results for each display condition: control, clustered and distributed. Upper panels represent results of left-handed participants, whereas lower panels were for right-handed participants. CL = contralateral to dominant hand; CM = contramedial to dominant hand; IM = ipsimedial to dominant hand; IL = ipsilateral to dominant hand. Error bars in the current and the following bar graphs are standard errors.
Three distinct patterns should be noted (Figure 3). First, for both groups the dominant hand (black) reached across midline to the contralateral targets (CL, CM) more than did the non-dominant hand (grey). Second, as the cognitive load of the task increased, there were more hand reaches into contralateral hemispace by both dominant (black) and non-dominant (grey) hands. Thus, the size and number of the black pie-slices in the CM and CL columns is largest for the “Distributed” panels in Figure 3, and the size and number of the gray pie-slices in the IM and IL columns is larger for the “Distributed” panels. Finally, left- and right- handers showed differences in these patterns. Specifically, left-handers seemed to reach more across midline into the farthest column (CL in Figure 3) with their dominant hand more than did right-handers, most noticeable in the highest cognitive load condition (“Distributed”). This is represented by the larger and more numerous black pie-slices in column CL in “Distributed”, than for right-handers in “Distributed”. One-way ANOVA that the visual differences between left- and right- handers observed in Figures 3 reached statistical significance, such that left-handers reached to the farthest column with their dominant hand significant more than right-handers did when the cognitive load was the highest, F(1,19)= 4.817, p =0.042 (Figure 4).
Figure 4.

The Proportion of Dominant Hand Reaches to the Column (CL in Figure 3) that is Farthest to the Dominant Hand by Left- and Right- Handers. Control condition = only the target symbol was displayed; Clustered condition = symbols were clustered based on internal colors (red, brown, blue, and yellow); Distributed condition =adjacent symbols were not sharing any internal colors.
Visual Display Complexity Modulates Reaction Time in Both Handedness Groups
Reaction time has been shown to reflect the complexity of cognitive processes during motor planning (Henry & Rogers, 1960; Rosenbaum, 1980; Ghez, Hening, & Gordon, 1991). Mixed 3×2×2 ANOVA (condition, within subjects; hand, within subjects; handedness group, between subjects) revealed significant effects of conditions, hand, condition by hand interaction, and three-way interaction. Consistent with our prediction of the main effect of conditions, reaction times were increased gradually from low to medium, and then to high cognitive load conditions. However, the 3-way interaction, F(2, 36) = 8.634, p = 0,001, , is best explained by conducting separate 2-way ANOVAs for the dominant and non-dominant hands. Post-hoc 2-way ANOVA within only the dominant hand (Figure 5) showed a significant main effect of condition, F(2,36) = 52.338, p <0.001, , such that cognitive load increased reaction time, as expected. There was also a significant between-group difference, F(1,18) = 7.297, p = 0.015, , such that left-handers reacted significantly faster than right-handers using their dominant hands, regardless of conditions. Post-hoc two-way ANOVA within only the non-dominant revealed only a significant main effect of condition, F(2,36) = 52.338, p <0.001, . Thus, the non-dominant hands of the two handedness groups behaved similarly and showed an increase in reaction time across conditions, such that greater cognitive load was associated with larger reaction times.
Figure 5.
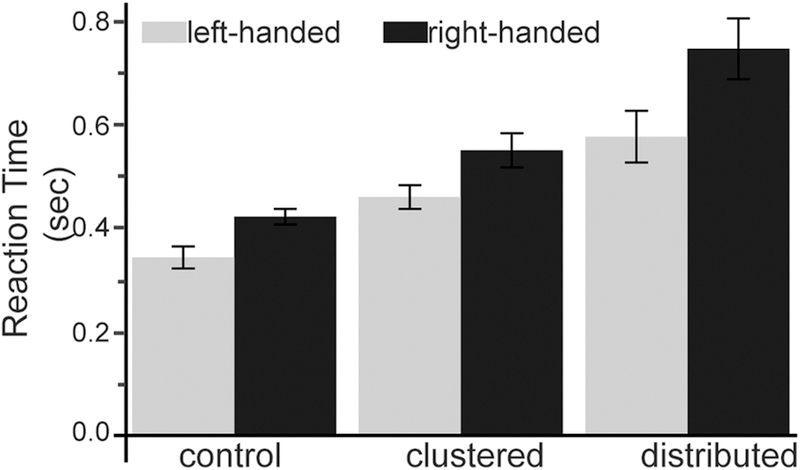
Reaction Time across Conditions and Between groups. Control condition = only the target symbol was displayed; Clustered condition = symbols were clustered based on internal colors (red, brown, blue, and yellow); Distributed condition =adjacent symbols were not sharing any internal colors. Error bars in the current and the following bar graphs are standard errors.
In order to better understand the interaction between handedness groups and hands, we conducted an additional post-hoc test, in which we collapsed data across conditions, which similarly effected within both hands and both groups. This two-way ANOVA (hand, within subjects; handedness group, between subjects) indicated a significant interaction between hand and group, F(1,19) = 9.930, p = 0.002. Further post-hoc analysis within hand showed that left-handers were significantly faster than right-handers when they used their dominant hands, F(1,19) = 8.892, p = 0.008, (Figure 6), but not when using their non-dominant hands. In fact, as shown in figure 6, there is an insignificant trend for the non-dominant hand of right-handers to be slightly quicker (lower reaction times) than left-handers.
Figure 6.
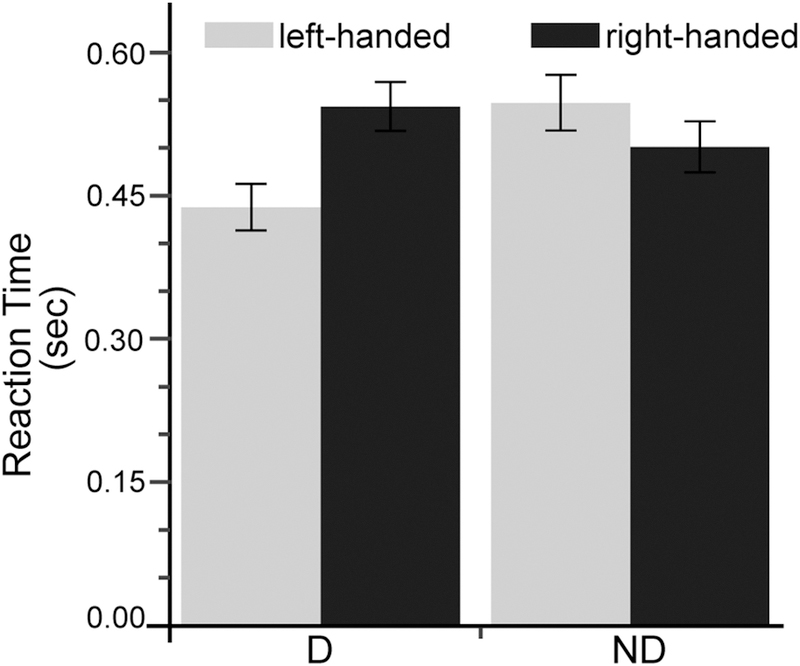
Reaction Time in Dominant (D)- Versus Non-dominant (ND) Hands in Both Handedness Groups.
Reaction Time is Negatively Related to the Percentage of Contralateral Reaches by Dominant Hand
Because we found that the main significant difference in reaction time between the two handedness groups occurred for the dominant hand, and because most contralateral reaches were produced with the dominant hand, we examined how reaction times were related to the percentage of contralateral reaches when using the dominant hand. A preliminary analysis of handedness group was conducted in which handedness (left- versus right- handers) was added as a fixed effect to assess if it (alone or with reaction time) was associated with the percentage of contralateral reaches. Handedness group was never a significant variable to account for the variances (Figure 7). We therefore removed the handedness variable from the equation to preserve degrees of freedom/power, and all analyses were conducted only with reaction time. Linear mixed model revealed a significant negative relationship such that the shorter the reaction time, the higher chance an individual reached across midline, regardless of handedness groups.
Figure 7.
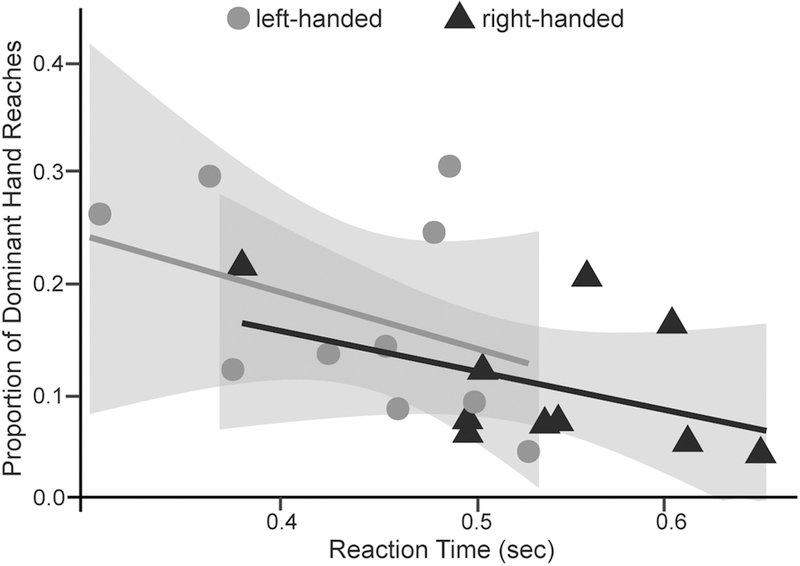
Relationship between Reaction Time and the Percentage of Contralateral Reaches by the Dominant Hand.
Discussion
We have recently shown that right-handed participants crossed midline more and spent more time to respond when the cognitive demands of a memory-search-and-reach task increased (Liang et al., 2018). Because reaches across midline were more costly in terms of time, distance, energetics, and error (Przybyla et al., 2012; Liang et al., 2018), we interpreted these results as evidence that reaches across midline reflect erroneous choices that emerge when cognitive decision making is impeded. The current study confirmed that left-handers also tend to make more choices to cross midline, under cognitively demanding task conditions. This task difficulty-dependent pattern in both left- and right-handers reinforces the cognitive-perceptual explanation for decision making during reaching movements. However, in contrast with previous literature indicating that left-handers tend to show a weaker bias in hand selection, in the current task, left-handers were more likely to use the dominant hand to cross midline than were right-handers, particularly under high cognitive load conditions. The choice to cross midline emerges when cognitive decisions about hand choice are impeded by other cognitive demands, suggesting that this choice is erroneous.
Consistent with this proposition, we previously showed that cross-midline reaches have high-energy and time costs and that they occur more frequently under cognitively demanding conditions (Liang et al., 2018). The fact that the incidence of cross-midline reaches varied inversely with reaction time supports this proposition, suggesting that when processing times are lowest, the likelihood of erroneous choices increases. In fact, the current study revealed lower dominant arm reaction times in left-handers than in right-handers, and showed that left-handers made a greater incidence of high-cost movements that reached to extremes of the contralateral workspace under the most cognitively demanding task conditions. The fact that left-handers showed overall lower dominant hand reaction times, and a greater number of high-cost cross-midline reaches under the most cognitively demanding conditions suggests that in our task, the cognitive conditions interfered with hand choice greater in left-handers than in right-handers.
Hand Selection
Perhaps the most interesting result of the current study was that left-handers tended to use their dominant hand more often than did right-handers. In fact, they made significantly more dominant hand reaches into the most lateral region of the contralateral workspace than right-handers did. These findings seem to contradict previous studies that have reported less pronounced use of the dominant hand in left-handers as compared to right-handers (Oldfield, 1971; Bryden, 1977; Borod et al., 1984). However, previous studies have either used questionnaires about common daily activities, or studied tasks with varying motor complexities but did not vary cognitive load between conditions (e.g., Borod et al., 1984; Calvert & Bishop, 1998; Mamolo et al., 2004; Mamolo, Roy, Bryden, & Rohr, 2005). In contrast, our task varied the cognitive load of the task, without changing the motor demands between conditions. In our study, when cognitive costs were low, both left- and right- handers showed similar patterns of hand choice. However, when cognitive load was the highest, left-handers chose to make the most motorically demanding movements, crossing midline with the dominant arm to the most contralateral targets in the workspace. That is, despite the greater mechanical, distance, and time costs, left-handers increased the use of their left hand to cross midline. This pattern was substantially weaker in right-handers. We also found that contralateral reaches were associated with reduced reaction times in both handedness groups, and that left-handers had the lowest reaction times with their dominant hands. Because crossing-midline in this task is more motorically costly, and because the incidence of midline crossing with either hand increases with cognitive loading, we previously concluded that midline crossing reflected an error in hand choice (Liang et al., 2018). In fact, these erroneous choices were increased as more cognitive resources were required by the task, thereby competing with motor planning (Liang et al., 2018).
In the current study, left-handers made the most “wrong decisions” when their reaction times were lowest, suggesting reduced planning, prior to movement. It is plausible that our manipulation of the spatial organization of the visual symbols may have been a sensitive or cognitively demanding factor during decision making such that the cognitive loads it elicited may have affected the left-handers more than the right-handed counterparts. One explanation might be that our visual search task biased the left-hemisphere, regardless of handedness, thus allowing more efficient visual-motor processing when right-handers used the dominant arm than when left-handers used the dominant arm. Consistent with this hypothesis, Kingstone and colleagues (1995) examined split brain patients performing visual search tasks, and showed that strategic visuospatial attentional processes are preferentially lateralized to the left cerebral hemisphere. This interpretation is supported by the trend for the right hand of left-handers to show longer reaction times (Figure 6) than the left hand of right-handers, although this trend did not reach statistical significance.
Reaction Time
Reaction time, across conditions, was faster in the dominant hand of the left-handers than that of the right-handers. Previous studies report that the right-handers exhibit reaction time asymmetry favoring the left hand during reaching to unpredictable visual targets, suggesting hemispheric asymmetry of motor planning processes (e.g., Carson, Chua, Goodman, Byblow, & Elliott, 1995; Mieschke, Elliott, Helsen, Carson, & Coull, 2001; Barthélémy & Boulinguez, 2002), although there is evidence of right-hand advantage (e.g., see review by Marzi, Bisiacchi, & Nicoletti, 1991) or symmetry between the hands (e.g., Corballis, 2002). Studies on reaction time in left-handers are very limited. Barthélémy and Boulinguez (2001) reported that both left- and right- handers exhibited left hand advantages in reaction time for making judgements about the trajectories of a moving visual stimulus. They concluded that these advantages resulted from right-hemisphere specializations which were independent of handedness. In contrast, Velay and Benoit-Dubrocard (1999) reported no reaction time differences between left- and right-handers in reaching behaviors. Kilshaw and Annett (1983) reported shorter reaction times for left-handers than right-handers performing a pegboard task. Our data was consistent with this, indicating significantly shorter reaction times for left-handers, but only for the dominant hand. Unfortunately, it is impossible for us to resolve these apparent discrepancies with the current data.
Conclusion
When increased task difficulty associated with visual-perceptual characteristics of target and its surrounding symbols was exerted, left- and right- handed participants were comparable and exhibited consistently midline crossing. These findings reinforce our previous hypothesis that the choice not-to-cross-midline recruits substantial cognitive resources. However, under the most cognitively demanding conditions, left-handers showed greater use of their dominant hand to cross midline and make more costly movement, even to the extremes of the workspace. These results support the proposition that left-handed individuals are not always mirror images of right-handers in terms of hand selection, nor are they identical to right-handers in terms of reaction time in dominant hand reaches. Instead, our current results suggest that hand selection in left-handers tend to be more affected by cognitive loading. It is possible that this difference in the effect of cognitive-perceptual load between left-handers and right-handers might result from an interaction with other lateralized brain mechanisms, such as left hemisphere lateralization of strategic visuospatial attentional processes. However, further research is necessary to test this hypothesis.
Acknowledgements
This work was supported by the National Institutes of Health [R01HD059783], and a Penn State SSRI Level 1 Award. The second author is co-funded by the Penn State SSRI. The authors thank Christine Regiec, Emily Neumann, and Tara O’Neill for their assistance throughout the development of this research.
Footnotes
Conflicts of interest
The authors have no conflicts of interest to declare.
References
- Barthélémy S, & Boulinguez P (2001). Manual reaction time asymmetries in human subjects: the role of movement planning and attention. Neuroscience Letters, 315(1), 41–44. 10.1016/S0304-3940(01)02313-8 [DOI] [PubMed] [Google Scholar]
- Barthélémy S, & Boulinguez P (2002). Manual asymmetries in the directional coding of reaching: further evidence for hemispatial effects and right hemisphere dominance for movement planning. Exp Brain Res, 147(3), 305–312. 10.1007/s00221-002-1247-x [DOI] [PubMed] [Google Scholar]
- Bishop DVM, Ross VA, Daniels MS, & Bright P (1996). The measurement of hand preference: a validation study comparing three groups of right-handers. Brit J Psychol (London, England : 1953), 87 ( Pt 2), 269–285. [DOI] [PubMed] [Google Scholar]
- Borod JC, Caron HS, & Koff E (1984). Left-handers and right-handers compared on performance and preference measures of lateral dominance. Brit J Psychol, 75(2), 177–186. 10.1111/j.2044-8295.1984.tb01889.x [DOI] [PubMed] [Google Scholar]
- Bryden MP (1977). Measuring handedness with questionnaires. Neuropsychologia, 15(4–5), 617–624. [DOI] [PubMed] [Google Scholar]
- Carson RG, Chua R, Goodman D, Byblow WD, & Elliott D (1995). The preparation of aiming movements. Brain Cognition, 28(2), 133–154. 10.1006/brcg.1995.1161 [DOI] [PubMed] [Google Scholar]
- Coelho CJ, Przybyla A, Yadav V, & Sainburg RL (2013). Hemispheric differences in the control of limb dynamics: a link between arm performance asymmetries and arm selection patterns. J Neurophysiol, 109(3), 825–838. 10.1152/jn.00885.2012 [DOI] [PMC free article] [PubMed] [Google Scholar]
- Doyen AL, Duquenne V, Nuques S, & Carlier M (2001). What can be learned from a lattice analysis of a laterality questionnaire? Behav Genet, 31(2), 193–207. [DOI] [PubMed] [Google Scholar]
- Fagard J (2013). The nature and nurture of human infant hand preference. Ann Ny Acad Sci, 1288(1), 114–123. 10.1111/nyas.12051 [DOI] [PubMed] [Google Scholar]
- Faul F, Erdfelder E, Lang A-G, Buchner A (2007) G*Power 3: a flexible statistical power analysis program for the social, behavioral, and biomedical sciences. Behav Res Methods 39 (2):175–191. [DOI] [PubMed] [Google Scholar]
- Gabbard C (1998). ATTENTIONAL STIMULI AND PROGRAMMING HAND SELECTION: A DEVELOPMENTAL PERSPECTIVE. Int J Neurosci, 96(3/4), 205. [DOI] [PubMed] [Google Scholar]
- Gabbard C, Helbig CR, & Gentry V (2001). Lateralized effects on reaching by children. Dev Neuropsychol, 19(1), 41–51. 10.1207/S15326942DN1901_4 [DOI] [PubMed] [Google Scholar]
- Gabbard C, & Rabb C (2000). What determines choice of limb for unimanual reaching movements? J Gen Psychol, 127(2), 178–184. 10.1080/00221300009598577 [DOI] [PubMed] [Google Scholar]
- Gonzalez CLR, Flindall JW, & Stone KD (2015). Hand preference across the lifespan: effects of end-goal, task nature, and object location. Frontiers in Psychology, 5, 1579 10.3389/fpsyg.2014.01579 [DOI] [PMC free article] [PubMed] [Google Scholar]
- Gurd JM, Schulz J, Cherkas L, & Ebers GC (2006). Hand Preference and Performance in 20 Pairs of Monozygotic Twins with Discordant Handedness. Cortex, 42(6), 934–945. 10.1016/S0010-9452(08)70438-6 [DOI] [PubMed] [Google Scholar]
- Johnstone LT, & Carey DP (2016). Do left hand reaction time advantages depend on localizing unpredictable targets? Experimental Brain Research, 234(12), 3625–3632. 10.1007/s00221-016-4758-6 [DOI] [PubMed] [Google Scholar]
- Kingstone A, Enns JT, Mangun GR, & Gazzaniga MS (1995). Guided Visual Search Is a Left-Hemisphere Process in Split-Brain Patients. Psychol Sci, 6(2), 118–121. 10.1111/j.1467-9280.1995.tb00317.x [DOI] [Google Scholar]
- Kim SG, Ashe J, Hendrich K, Ellermann JM, Merkle H, Ugurbil K, & Georgopoulos AP (1993). Functional magnetic resonance imaging of motor cortex: hemispheric asymmetry and handedness. Science (New York, N.Y.), 261(5121), 615–617. [DOI] [PubMed] [Google Scholar]
- Klöppel S, van Eimeren T, Glauche V, Vongerichten A, Münchau A, Frackowiak RSJ, … Siebner HR (2007). The effect of handedness on cortical motor activation during simple bilateral movements. NeuroImage, 34(1), 274–280. 10.1016/j.neuroimage.2006.08.038 [DOI] [PubMed] [Google Scholar]
- Leconte P, & Fagard J (2006). Which factors affect hand selection in children’s grasping in hemispace? Combined effects of task demand and motor dominance. Brain Cognition, 60(1), 88–93. 10.1016/j.bandc.2005.09.009 [DOI] [PubMed] [Google Scholar]
- Liang J, Wilkinson K, & Sainburg RL (2018). Is Hand Selection Modulated by Cognitive-perceptual Load? Neuroscience, 369, 363–373. 10.1016/j.neuroscience.2017.11.005 [DOI] [PMC free article] [PubMed] [Google Scholar]
- Mamolo CM, Roy EA, Bryden PJ, & Rohr LE (2004). The effects of skill demands and object position on the distribution of preferred hand reaches. Brain Cognition, 55(2), 349–351. 10.1016/j.bandc.2004.02.041 [DOI] [PubMed] [Google Scholar]
- Marzi CA, Bisiacchi P, & Nicoletti R (1991). Is interhemispheric transfer of visuomotor information asymmetric? Evidence from a meta-analysis. Neuropsychologia, 29(12), 1163–1177. 10.1016/0028-3932(91)90031-3 [DOI] [PubMed] [Google Scholar]
- Mayer-Johnson R (1992). The Picture Communication Symbols Solana Beach, CA: Mayer-Johnson. [Google Scholar]
- Mieschke PE, Elliott D, Helsen WF, Carson RG, & Coull JA (2001). Manual Asymmetries in the Preparation and Control of Goal-Directed Movements. Brain Cognition, 45(1), 129–140. 10.1006/brcg.2000.1262 [DOI] [PubMed] [Google Scholar]
- Oldfield RC (1971). The assessment and analysis of handedness: The Edinburgh inventory. Neuropsychologia, 9(1), 97–113. 10.1016/0028-3932(71)90067-4 [DOI] [PubMed] [Google Scholar]
- Pinheiro J, Bates D, DebRoy S, Sarkar D and R Core Team (2018). nlme: Linear and Nonlinear Mixed Effects Models R package version 3.1–137, https://CRAN.R-project.org/package=nlme.
- Pool E-M, Rehme AK, Fink GR, Eickhoff SB, & Grefkes C (2014). Handedness and effective connectivity of the motor system. NeuroImage, 99, 451–460. 10.1016/j.neuroimage.2014.05.048 [DOI] [PMC free article] [PubMed] [Google Scholar]
- Przybyla A, Coelho CJ, Akpinar S, Kirazci S, & Sainburg RL (2013). Sensorimotor performance asymmetries predict hand selection. Neuroscience, 228, 349–360. 10.1016/j.neuroscience.2012.10.046 [DOI] [PMC free article] [PubMed] [Google Scholar]
- Przybyla A, Good DC, & Sainburg RL (2012). Dynamic dominance varies with handedness: reduced interlimb asymmetries in left-handers. Exp Brain Res 216(3), 419–431. 10.1007/s00221-011-2946-y [DOI] [PMC free article] [PubMed] [Google Scholar]
- R Core Team (2014). R: A language and environment for statistical computing R Foundation for Statistical Computing, Vienna, Austria: URL http://www.R-project.org/. [Google Scholar]
- Rosenbaum DA (1980). Human movement initiation: specification of arm, direction, and extent. J Exp Psychol Gen, 109(4), 444–474. [DOI] [PubMed] [Google Scholar]
- Scharoun SM, & Bryden PJ (2014). Hand preference, performance abilities, and hand selection in children. Front Psychol, 5(82), 1–15. 10.3389/fpsyg.2014.00082 [DOI] [PMC free article] [PubMed] [Google Scholar]
- Stoloff RH, Taylor JA, Xu J, Ridderikhoff A, & Ivry RB (2011). Effect of Reinforcement History on Hand Choice in an Unconstrained Reaching Task. Front Neurosci-Switz, 5, 41 10.3389/fnins.2011.00041 [DOI] [PMC free article] [PubMed] [Google Scholar]
- van den Berg FE, Swinnen SP, & Wenderoth N (2011). Involvement of the primary motor cortex in controlling movements executed with the ipsilateral hand differs between left- and right-handers. Journal of Cognitive Neuroscience, 23(11), 3456–3469. 10.1162/jocn_a_00018 [DOI] [PubMed] [Google Scholar]
- Verstynen T, Diedrichsen J, Albert N, Aparicio P, & Ivry RB (2005). Ipsilateral motor cortex activity during unimanual hand movements relates to task complexity. Journal of Neurophysiology, 93(3), 1209–1222. 10.1152/jn.00720.2004 [DOI] [PubMed] [Google Scholar]
- Wilkinson KM, & McIlvane WJ (2013). Perceptual Factors Influence Visual Search for Meaningful Symbols In Individuals with Intellectual Disabilities and Down Syndrome or Autism Spectrum Disorders. Ajidd-Am J Intellect, 118(5), 353–364. 10.1352/1944-7558-118.5.353 [DOI] [PMC free article] [PubMed] [Google Scholar]
- Wilkinson KM, O’Neill T, & McIlvane WJ (2014). Eye-Tracking Measures Reveal How Changes in the Design of Aided AAC Displays Influence the Efficiency of Locating Symbols by School-Age Children Without Disabilities. J Speech Lang Hear R, 57(2), 455–466. 10.1044/2013_JSLHR-L-12-0159 [DOI] [PubMed] [Google Scholar]