

Abstract
Importance:
Birth in areas with high infant mortality rates (IMRs) has been linked to worse long-term health outcomes, yet it is completely unknown if it impacts dementia risk.
Methods:
6,268 healthcare members were followed for dementia diagnosis from 1996–2015. Birth state IMRs from 1928 were ranked into quartile (worst IMRs quartile range: Whites: 69–129 deaths/1,000 live births, Non-Whites: 129–277 deaths/1,000 live births). Cox proportional hazard models estimated the dementia risk associated with birth state IMR quartile adjusting for demographics and lifecourse health indicators.
Results:
Compared with Whites born outside of states in the worst IMR quartile, African Americans born in states in the worst IMR quartile had 92% increased dementia risk (HR=1.92; 95% CI: 1.42, 2.59), and African Americans born outside those states had 36% increased risk (HR=1.36; 95% CI: 1.20, 1.53). There was no association between birth state IMR and dementia risk among Whites.
Conclusions:
Birth in states with the highest rates of infant mortality was associated with elevated dementia risk among African Americans but not Whites. The large absolute difference in IMRs likely reflects harsher early-childhood conditions experienced by African Americans. These findings suggest that childhood conditions may play a role in racial disparities in dementia rates.
Keywords: dementia, lifecourse, longitudinal, disparities, early life, infant mortality
BACKGROUND
African Americans have 50–100% greater risk of dementia compared to Whites1 and reducing such disparities was identified as a national priority by the National Alzheimer’s Project Act2. However, the drivers of these differences are unclear, impeding the development of effective interventions. Identifying the primary drivers is a critical next step in identifying targets for interventions to diminishing these inequalities.
Infant mortality rates (i.e. the number of deaths among children under 1 year of age per 1,000 live births in the same year; IMR) are a powerful indicator of general population health and reflect the social and physical conditions of the environment in which the births occurred. Studies have linked infant mortality rates to area-level measures of income3,4, unemployment rate4,5, and educational attainment4,6. The effects of adverse early childhood conditions on health can persist into adult years through possible pathways such as health behaviors (e.g. smoking, alcohol consumption), educational opportunities, and later socioeconomic status.7,8 Individuals born in areas with high IMRs have been shown to experience elevated mortality due to heart disease9,10, stroke11,12, stomach cancer11, and tuberculosis11, as well as increased all cause adult mortality10,13. Yet it remains unclear if IMRs are associated with worse brain health in late life and if this association may partially explain racial inequalities in rates of dementia. In this study, we examined whether birth in states with high IMRs is associated with elevated dementia risk in a large, diverse cohort of health plan members who all resided in Northern California by midlife.
METHODS
Study Participants.
Kaiser Permanente Northern California (KPNC) is a large integrated health care delivery system. KPNC has over 3 million members in Northern California and provides care to approximately 30% of the population in the catchment area. Its member population is generally representative of the overall population of the region, except with respect to the extremes of the income distribution14–16. Starting in 1964, all KPNC members in the San Francisco Bay Area were offered optional check-ups called Multiphasic Health Checkups (MHCs) that collected information on demographics, lifestyle, and health.17 In these analyses, we included members who participated in the Multiphasic Health Checkups (MHC) during the 1960s-1970s. This study was approved by the KPNC Institutional Review Board.
Study Design.
A total of 10,862 members of KPNC met the following eligibility criteria: 1) participated in at least one MHC visit between 1964 and 1973, 2) were between 40–45 at the time of MHC participation, 3) and were KPNC members in 1996, when electronic medical records were implemented in the KPNC system. We excluded 1,624 individuals without information on birth place, 1,815 individuals born outside of the US, 696 individuals born in states that were not part of the US birth registry as of 1928 (Nevada, New Mexico, South Dakota, Texas, Hawaii, District of Columbia, and Alaska), and 459 individuals who did not identify as African American or White. Our final sample included 6,268 people.
Birth state IMR.
State-level IMRs were obtained from a historical report issued by the US Census Bureau, which included IMRs from 1926–1931 for Whites and “Colored” (Non-White) groups separately.18 IMRs from 1928 were used to best balance data completeness and proximity to the median sample birth year (1924). Race-specific infant mortality rates were linked to individual’s place of birth, which was captured by an open-ended MHC questionnaire item asking “Where were you born?” IMRs for Non-Whites were used as a proxy for African American IMRs; African Americans comprised 96% of the Non-White population of the US in 1920.19 In 1928 state-level IMRs ranged from 45 to 129 deaths per 1,000 live births (mean=65 deaths per 1,000 live births) for Whites and from 65 to 277 deaths per 1,000 live births (mean=126 deaths per 1,000 live births) for Non-Whites. In order to not impose a linear association between state-level IMRs and dementia, IMRs for were divided into quartiles for Whites and Non-Whites separately.
States with IMRs in the top quartile were classified as high IMR states (see Supplemental Table 1 for list of high IMR states by race). IMRs in those states ranged from 69 to 129 deaths per 1000 live births for Whites (mean=79 deaths per 1,000 live births) and 129 to 277 deaths per 1,000 live births for Non-White (mean=183 deaths per 1,000 live births). Of the eleven states in the top quartile of Non-White state-level IMRs, African Americans in our sample were only born in the following four: Oklahoma (88 people), Arizona (9 people), Montana (1 person), and Utah (1 person). Our sample included at least one White individual born in each of the ten states in the top quartile of White state-level IMRs.
Dementia Diagnosis.
Dementia diagnoses were ascertained from KPNC electronic records between January 1, 1996 and October 1, 2015 using the following International Classification of Diseases, Ninth Revision (ICD-9) diagnosis codes: Alzheimer’s disease (331.0), vascular dementia (290.4x), and other/nonspecific dementia (290.0, 290.1x, 290.2x, 290.3, 294.2x, and 294.8). This method of identifying dementia cases is consistent with previous publications in this population.20–23 A similar set of ICD-9 codes was found to have a sensitivity of 77% and a specificity of 95% compared with a consensus diagnosis of dementia utilizing medical records review, physical examination, neuropsychiatric battery, and structured interviews.24
Mortality.
Death between January 1, 1996 and October 1, 2015 was captured through electronic medical records, the California State Mortality File, and Social Security Death records.
Survey Health Data and Midlife and Late-life Risk Factors.
The 1964–1973 MHC questionnaire included questions about age, sex, race, and level of educational attainment. Educational attainment was operationalized as high school education or less versus greater than high school education. The 1964–1973 MHC visit also included several clinical measures of midlife vascular risk factors, including height and weight used to calculate body mass index (BMI), systolic blood pressure, and diastolic blood pressure. Midlife high blood pressure was defined as systolic blood pressure ≥140 mm Hg and diastolic pressure ≥90 mm Hg.
Late-life diabetes and stroke were collected from electronic medical record diagnoses between January 1st, 1996 and October 1th, 2015. Diabetes status was collected from the KPNC Diabetes Registry which incorporates information from ICD-9 diagnoses, diabetes medication, and clinical measurements of hemoglobin A1c. Strokes were identified using ICD-9 codes for hemorrhagic stroke (430, 431), ischemic stroke (433.01–435.9), acute ill-defined cerebrovascular disease (436), and iatrogenic cerebrovascular infarction or hemorrhage (997.02). Missing indicators were used for 358 people without information on weight or height. There were no other missing data.
Statistical analysis.
We examined the distribution of demographic variables, and lifecourse vascular risk factors by birth in high IMR states and race. Next, we estimated age-adjusted dementia incidence rates (by standardizing to the 2000 US Census population) for African Americans and Whites by birth in high IMR state.
For African Americans and Whites separately, we estimated the risk of dementia associated with IMRs through two series of Cox proportional hazards models with age as the timescale. The first series of models examined quartiles of IMRs to allow for a non-linear association between IMRs and dementia adjusting for covariates in groups. Since mid- and late-life risk factors may be partial mediators of the association between IMR and dementia risk, we first adjusted for demographic variables, followed by further adjustment for midlife vascular risk factors, and lastly, further adjustment for late-life vascular risk factors.
Next, a series of models examined the association between dementia and birth in high IMR states (i.e. the top quartile of state-level IMRs) also sequentially adjusting for demographics, midlife vascular risk factors, and then late-life vascular risk factors. Individuals were censored at the first diagnosis of dementia, lapse in health plan membership 90 days or more, death, or at the end of study follow-up on October 1, 2015.
Next we concurrently examined the effects of birth state IMRs and race by grouping people into four categories: 1) Whites born outside high IMR states, 2) African Americans born outside high IMR states, 3) Whites born in high IMR states, and 4) African Americans born in high IMR states. We implemented Cox proportional hazards models examining the association between these four groups and dementia risk with Whites born outside high IMR states as the reference category. These models were adjusted for demographics, followed by additional adjustment for midlife vascular risk factors and then late-life vascular risk factors.
Lastly, we estimated the cumulative risk of dementia (in 5-year increments from 10 to 25 years) conditional on survival free of dementia to age 65 for each group using the Practical Incidence Estimator macro.25 This macro incorporates death rates and assumes that individuals who die without a dementia diagnosis never develop dementia.
RESULTS
The sample eligible for the current study included 1,058 African Americans and 5,210 Whites, of which 29% and 38% respectively developed dementia during follow-up (Table 1). A slightly larger percent of African Americans were born in high IMR states than Whites (9.4% vs 7.7%; p= 0.08). By the end of follow up, 30% of the sample developed dementia, 33% died without a dementia diagnosis, and 18% were censored due to lapse in membership. The mean follow-up time was 11.6 years (range: 0.07 to 19.7 years).
Table 1.
Sample characteristics by category of race and birth in high infant mortality rate (IMR) states
| Whites | African Americans | |||
|---|---|---|---|---|
| Born outside high IMR state n (%) or mean (SD) |
Born in high IMR state n (%) or mean (SD) |
Born outside high IMR state n (%) or mean (SD) |
Born in high IMR state n (%) or mean (SD) |
|
| n | 4807 | 403 | 959 | 99 |
| Dementia cases |
1373 |
116 |
362 |
45 |
| Age in 1996 (yrs) | 71.2 (2.7) | 71.5 (2.8) | 70.9 (2.8) | 71.4 (2.8) |
| Female | 2581 (54%) | 197 (49%) | 560 (58%) | 61 (62%) |
| ≤ High school education | 2023 (42%) | 168 (42%) | 664 (69%) | 69 (70%) |
| Midlife BMI | 24.7 (3.7) | 24.6 (3.7) | 26.7 (4.5) | 26.9 (4.2) |
| Midlife high blood pressure | 447 (10%) | 45 (11%) | 217 (23%) | 26 (26%) |
| Late-life stroke | 1330 (28%) | 110 (27%) | 282 (29%) | 33 (33%) |
| Late-life diabetes | 1151 (24%) | 109 (27%) | 379 (40%) | 44 (44%) |
Notes: High IMR state defined as states with the highest quartile of state-level infant mortality rate in 1928. BMI=body mass index
The age-adjusted dementia incidence rate for African Americans born in high IMR states was 26 cases per 1,000 person-years compared to 23 cases per 1,000 person-years among African Americans born outside those states (Supplemental Table 2). The age-adjusted dementia incidence rate for Whites born in high IMR states was 17 cases per 1,000 person-years compared to 15 cases per 1,000 person-years among Whites born outside those states.
Compared to those born in the lowest quartile of state-level IMR, Whites born in the highest quartile were not at elevated risk of dementia in models adjusting for demographics and vascular lifecourse risk factors (HR=1.07; 95% CI: 0.86, 1.34; Table 2). African Americans born in the worst quartile of IMRs had 44% greater risk of dementia compared to African Americans born in the best quartile of IMRs (HR=1.44; 95% CI: 1.03, 2.01). The effect estimates remained similar in fully adjusted models for both racial groups.
Table 2.
Cox proportional hazard models of quartiles of birth state infant mortality rates (IMR) and risk of dementia stratified by race
| IMR quartile | Model 1 HR (95% CI) |
Model 2 HR (95% CI) |
Model 3 HR (95% CI) |
|---|---|---|---|
| Whites | |||
| Q1 (best quartile) | ref | ref | ref |
| Q2 | 1.03 (0.89, 1.19) | 1.02 (0.88, 1.18) | 1.03 (0.89, 1.18) |
| Q3 | 1.20 (1.00, 1.45) | 1.20 (0.99, 1.45) | 1.20 (1.00, 1.45) |
| Q4 (worst quartile) | 1.06 (0.85, 1.32) | 1.06 (0.85, 1.33) | 1.07 (0.86, 1.34) |
| African Americans | |||
| Q1 (best quartile) | ref | ref | ref |
| Q2 | 1.03 (0.83, 1.28) | 1.05 (0.85, 1.31) | 1.08 (0.87, 1.35) |
| Q3 | 0.92 (0.64, 1.33) | 0.95 (0.66, 1.37) | 0.96 (0.67, 1.40) |
| Q4 (worst quartile) | 1.35 (0.97, 1.88) | 1.40 (1.00, 1.95) | 1.44 (1.03, 2.01) |
Notes: Model 1 adjusts for age, sex, and education. Model 2 further adjust for midlife vascular risk factors (body mass index and high blood pressure). Model 3 further adjust for late-life vascular risk factors (stroke and diabetes).
Compared to all African Americans born outside of states in the top quartile of IMRs, African Americans born in high IMR states had a 40% increased risk of dementia after adjusting for demographics and lifecourse vascular risk factors (HR=1.40; 95% CI: 1.02, 1.91; Table 3). There was no evidence of an association between birth in high IMR states and dementia risk among Whites in minimally or fully adjusted models (minimally adjusted HR=1.01; 95% CI: 0.84, 1.22; fully adjusted HR=1.03; 95% CI: 0.85, 1.25).
Table 3.
Cox proportional hazard models of birth in a high infant mortality rate (IMR) state and risk of dementia stratified by race
| Adjusting for: | Whites | African Americans | ||
|---|---|---|---|---|
| Born outside high IMR state HR (95% CI) |
Born in high IMR state HR (95% CI) |
Born outside high IMR state HR (95% CI) |
Born in high IMR state HR (95% CI) |
|
| Age, sex, education | ref | 1.01 (0.84, 1.22) | ref | 1.35 (0.99, 1.84) |
| Age, sex, education, midlife vascular risk factors | ref | 1.02 (0.85, 1.24) | ref | 1.37 (1.01, 1.87) |
| Age, sex, education, midlife and late-life vascular risk factors | ref | 1.03 (0.85, 1.24) | ref | 1.40 (1.02, 1.91) |
Notes: High IMR state defined as states with the highest quartile of state-level infant mortality rate in 1928. Midlife vascular risk factors are body mass index and high blood pressure. Late-life vascular risk factors are stroke and diabetes.
Compared with Whites born outside high IMR states, African Americans born in high IMR states had 92% increased risk of dementia (HR=1.92; 95% CI: 1.42, 2.59), and African Americans born outside high IMR states had 36% higher risk of dementia (HR=1.36; 95% CI: 1.20, 1.53) adjusting for demographics and lifecourse vascular risk factors (Table 4). There was no evidence that Whites born in high IMR states were at elevated risk of dementia (HR=1.03; 95% CI: 0.85, 1.25).
Table 4.
Cox proportional hazard models of birth in a high infant mortality rate (IMR) state by race and dementia risk
| Adjusting for: | Whites | African Americans | ||
|---|---|---|---|---|
| Born outside high IMR state HR (95% CI) |
Born in high IMR state HR (95% CI) |
Born outside high IMR state HR (95% CI) |
Born in high IMR state HR (95% CI) |
|
| Age, sex, education | ref | 1.01 (0.84, 1.22) | 1.43 (1.27, 1.61) | 1.93 (1.44, 2.61) |
| Age, sex, education, midlife vascular risk factors | ref | 1.02 (0.85, 1.24) | 1.34 (1.19, 1.51) | 1.84 (1.37, 2.49) |
| Age, sex, education, midlife and late-life vascular risk factors | ref | 1.03 (0.85, 1.25) | 1.36 (1.20, 1.53) | 1.92 (1.42, 2.59) |
Notes: High IMR state defined as defined as states with the highest quartile of state-level infant mortality rate in 1928. Midlife vascular risk factors are body mass index and high blood pressure. Late-life vascular risk factors are stroke and diabetes.
The same pattern was found when estimating cumulative risk of dementia across the four categories of race and birth state IMRs (Figure 1, Supplemental Table 3): African Americans born in high IMRs states consistently had the highest risk followed by African Americans born outside high IMR states and Whites born in high IMRs states did not differ from those born in outside those states. The estimated 25-year cumulative risk of dementia for African Americans born in high IMR states was 47% (95% CI: 34%, 58%) compared to 41% (95% CI: 37%, 45%) for African Americans born outside those states. For Whites the estimated 25-year cumulative risk of dementia was 31% or 32% depending on birth state IMR (born in high IMR states: 95% CI: 25%, 37%; born outside high IMR states: 95% CI: 30%, 33%).
Figure 1. Cumulative risk of dementia conditional on survival free of dementia until age 65 by race and birth in a high infant mortality rate (IMR) state.
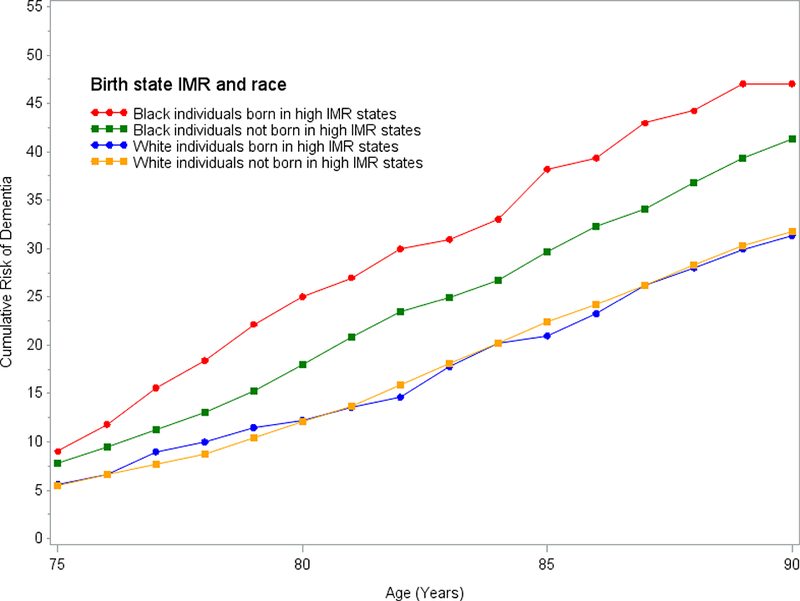
High IMR state defined as defined as states with the highest quartile of state-level infant mortality rate in 1928.
DISCUSSION
This is the first paper examining birth state IMRs and dementia risk. In this large cohort of men and women born across the US, birth in states with high levels of IMRs was associated with elevated dementia risk among African Americans. IMRs are a sensitive marker of early-life living conditions. The leading causes of infant mortality in the 1920s were premature birth, respiratory infections, and diarrheal diseases18,26, all of which have been associated with poverty, access to health care, prenatal care, nutrition, and sanitation. In 1928, the national IMR in Non-White populations was 66% greater than among Whites (106 vs 64 death per 1,000 live births)18, indicating that African Americans likely faced much harsher environments in early life than Whites. Among African-Americans, those born in states in the top quartile of IMRs had 40% increased risk of dementia compared to those born outside these states after taking into account demographics and vascular comorbidities. Consistent with multiple studies, our study also shows that race is also a risk factor for dementia20,27. Among individuals born outside of high IMR states, African Americans had 36% greater dementia risk than Whites. However, African Americans born in high IMR states had the largest relative and absolute risk of dementia. Compared with Whites born outside high IMR states, African Americans born in high IMR states had 92% increased risk of dementia and 47.9% greater estimated 25-year cumulative risk of dementia. These results suggest that childhood conditions may partially explain racial disparities in dementia risk.
One limitation of our study is that we were unable to find IMRs for African American’s in the 1920s (mean/median birth year=1924), requiring us to use the IMR for Non-Whites as a proxy. However, African Americans comprised 96% of the Non-White population of the US in 1920.19 In our sample, 89% of African Americans born in high IMR states were born in Oklahoma, which had a minority population predominantly comprised by African Americans (73% of the state’s minority population in 1920)28. On the other hand, 9% of African Americans born in high IMR states in our sample were born in Arizona, where African Americans were only 19% of the minority population28. The use of IMRs estimated mostly on Native Americans is appropriate to the extent that African Americans and Native Americans both experienced harsh early-life living conditions.
In our sample, 98% of African Americans born in high IMR states were born in Oklahoma or Arizona, both of which enforced Jim Crow laws.29 In 21 states, Jim Crow laws legalized racial discrimination in education, medical access, transportation, employment, and other domains of life.29 The effects of structural racism are evident in the extreme absolute difference in the IMRs between Whites and Non-Whites. The range of IMRs in the top quartile for Non-Whites and Whites barely overlap: the lowest IMR in the top quartile for Non-Whites was 129 deaths per 1,000 live births which was the highest IMR among Whites. Thus it is unknown if Whites born in states with IMRs above 131 deaths per 1,000 live births would also have increased dementia risk. IMRs at this level may indicate a threshold of profound disadvantage which could increase dementia risk in Whites as well.
Our work is consistent with prior literature demonstrating a strong association between high IMRs and worse adult health. Initial studies in the 1970s and 1980s demonstrated associations between IMRs and mortality due to ischemic heart disease in Norway, England, and Wales.9,10,30 A study in the US showed an association between infant mortality due to diarrheal diseases in the 1917–1921 birth cohorts and ischemic heart disease mortality even after adjusting for contemporaneous IMRs in later life as a proxy for adult living conditions.31 High IMRs have also been associated with increased risk of deaths due to stroke11,12, tuberculosis11, and stomach cancer9,11. These studies conceptualize high levels of infant mortality as markers of a range of poor early-life living conditions and are part of a larger body of research demonstrating a link between childhood exposures and late-life health.32
It is increasingly accepted that health and conditions in early-life can have lasting effects on brain health and dementia risk23,33–35. Exposure to adverse conditions in early life may have physiological consequences on the developing brain. For example, malnutrition during the first two years of life may lead to reduced synaptogenesis and stunted dendrite growth36. Other early-life exposures that may impact brain health include lead, infection, and chronic stress34,37,38. Separately or in conjunction, adverse childhood environments could also elevate dementia risk by impacting educational opportunities, income, health behaviors, and risk of other health conditions later in life.
Strengths of this study include a well-characterized, diverse sample from members of an integrated healthcare delivery system with equal access to health care beginning in the 1960s enabling us to follow them across many decades. We are able to link birth state IMRs to medical records, providing information on dementia incidence as well as other medical conditions. Our cohort only includes individuals who migrated to California by their early 40s and the majority of African Americans born in high IMR states in our sample were born in Oklahoma or Arizona. This limits our understanding of the impact of birth in a state with high IMRs other than Oklahoma or Arizona and among people who continue to reside in those states past midlife. Since people who migrated to California may be healthier or more advantaged than those who stayed in states with high IMRs, we likely underestimated the effect of high IMRs on dementia risk for those who did not migrate to California. We do not have information on when members migrated, so we are unable to examine the effects of duration or the possibility of a sensitive period. We were unable to adjust for education quality which may vary by race/ethnicity and partially explain differences in cognitive outcomes in Whites compared to African Americans.39 Since we do not have cognitive or neuroimaging data we cannot determine if birth in a high IMR was associated with a different trajectory of cognitive change and/or differences in imaging markers of brain function.
Higher levels of IMRs among African Americans likely reflect higher levels of early childhood adversity which was associated with a higher risk of dementia. Even among people who subsequently moved to California, birth in states with the highest IMR was associated with elevated dementia risk for African Americans. Although IMRs have drastically decreased since the 1920s, the national IMR for African American is still twice as high as for Whites (11.0 versus 4.9 deaths per 1,000 live births)40. Further research is needed to identify the role of early childhood conditions on racial disparities in dementia risk. Identifying modifiable pathways through which early childhood exposures may underlie racial disparities is a critical step in redressing inequities in dementia risk.
Supplementary Material
Acknowledgments
Funding:
This work was supported by grants number RF1 AG052132 (PI: Dr. Whitmer), R01 AG050782 (PI: Dr. Whitmer), P30 AG010129 (PI: Dr. DeCarli), and R00 AG053410 (PI: Dr. Mayeda) from the National Institute on Aging, National Institutes of Health. Dr. Gilsanz was supported by the UCSF Training for Research on Aging and Chronic Disease (T32 AG049663).
References
- 1.Demirovic J, Prineas R, Loewenstein D, et al. Prevalence of dementia in three ethnic groups: the South Florida program on aging and health. Annals of epidemiology. 2003;13(6):472–478. [DOI] [PubMed] [Google Scholar]
- 2.US Department of Health and Human Services. National plan to address Alzheimer’s disease: 2014 update. Available at http://aspe.hhs.gov/daltcp/napa/NatlPlan2014.shtml Accessed January 17, 2017.
- 3.Olson ME, Diekema D, Elliott BA, et al. Impact of income and income inequality on infant health outcomes in the United States. Pediatrics. 2010;126(6):1165–1173. [DOI] [PubMed] [Google Scholar]
- 4.Wallace M, Crear-Perry J, Richardson L, et al. Separate and unequal: Structural racism and infant mortality in the US. Health & place. 2017;45:140–144. [DOI] [PubMed] [Google Scholar]
- 5.Dallolio L, Di Gregori V, Lenzi J, et al. Socio-economic factors associated with infant mortality in Italy: an ecological study. Int J Equity Health. 2012;11:45. [DOI] [PMC free article] [PubMed] [Google Scholar]
- 6.Bird ST. Separate black and white infant mortality models: differences in the importance of structural variables. Soc Sci Med. 1995;41(11):1507–1512. [DOI] [PubMed] [Google Scholar]
- 7.Wise PH. Child Poverty and the Promise of Human Capacity: Childhood as a Foundation for Healthy Aging. Acad Pediatr. 2016;16(3 Suppl):S37–45. [DOI] [PubMed] [Google Scholar]
- 8.Galobardes B, Lynch JW, Davey Smith G. Childhood socioeconomic circumstances and cause-specific mortality in adulthood: systematic review and interpretation. Epidemiol Rev. 2004;26(1):7–21. [DOI] [PubMed] [Google Scholar]
- 9.Barker DJ, Osmond C. Infant mortality, childhood nutrition, and ischaemic heart disease in England and Wales. Lancet. 1986;1(8489):1077–1081. [DOI] [PubMed] [Google Scholar]
- 10.Forsdahl A Are poor living conditions in childhood and adolescence an important risk factor for arteriosclerotic heart disease? Br J Prev Soc Med. 1977;31(2):91–95. [DOI] [PMC free article] [PubMed] [Google Scholar]
- 11.Leon DA, Davey Smith G. Infant mortality, stomach cancer, stroke, and coronary heart disease: ecological analysis. BMJ. 2000;320(7251):1705–1706. [DOI] [PMC free article] [PubMed] [Google Scholar]
- 12.Amiri M, Kunst AE, Janssen F, et al. Cohort-specific trends in stroke mortality in seven European countries were related to infant mortality rates. J Clin Epidemiol. 2006;59(12):1295–1302. [DOI] [PubMed] [Google Scholar]
- 13.Bengtsson T, Brostrom G. Do conditions in early life affect old-age mortality directly and indirectly? Evidence from 19th-century rural Sweden. Soc Sci Med. 2009;68(9):1583–1590. [DOI] [PubMed] [Google Scholar]
- 14.Gordon NP, Kaplan GA. Some evidence refuting the HMO “favorable selection” hypothesis: the case of Kaiser Permanente. Advances in health economics and health services research. 1991;12:19–39. [PubMed] [Google Scholar]
- 15.Krieger N Overcoming the absence of socioeconomic data in medical records: validation and application of a census-based methodology. American journal of public health. 1992;82(5):703–710. [DOI] [PMC free article] [PubMed] [Google Scholar]
- 16.Gordon NP. Similarity of the Kaiser Permanente senior member population in northern California to the non-Kaiser Permanente covered and general population of seniors in northern California: Statistics from the 2009 California Health Interview Survey. Oakland, CA: Kaiser Permanente Northern California Division of Research; 2012. [Google Scholar]
- 17.Collen MF. Multiphasic Health Testing Services. New York: John Wiley; 1978. [Google Scholar]
- 18.Bureau of the Census, Commerce Do. Birth, stillbirth, and infant mortality statistics for the birth registration area of the United States 1931. Washington: United States: Government Printing Office; 1934. [Google Scholar]
- 19.Gibson C, Jung K. Historical Census Statistics on Population Totals By Race, 1790 to 1990, and By Hispanic Origin, 1970 to 1990, For The United States, Regions, Divisions, and States. In: Bureau USC, ed. Washington, DC: 2002. [Google Scholar]
- 20.Mayeda ER, Glymour MM, Quesenberry CP, et al. Inequalities in dementia incidence between six racial and ethnic groups over 14 years. Alzheimer’s & dementia : the journal of the Alzheimer’s Association. 2016;12(3):216–224. [DOI] [PMC free article] [PubMed] [Google Scholar]
- 21.Whitmer RA, Karter AJ, Yaffe K, et al. Hypoglycemic episodes and risk of dementia in older patients with type 2 diabetes mellitus. Jama. 2009;301(15):1565–1572. [DOI] [PMC free article] [PubMed] [Google Scholar]
- 22.Whitmer RA, Gustafson DR, Barrett-Connor E, et al. Central obesity and increased risk of dementia more than three decades later. Neurology. 2008;71(14):1057–1064. [DOI] [PubMed] [Google Scholar]
- 23.Gilsanz P, Mayeda ER, Glymour MM, et al. Association Between Birth in a High Stroke Mortality State, Race, and Risk of Dementia. JAMA Neurol. 2017;74(9):1056–1062. [DOI] [PMC free article] [PubMed] [Google Scholar]
- 24.Katon WJ, Lin EHB, Williams LH, et al. Comorbid Depression Is Associated with an Increased Risk of Dementia Diagnosis in Patients with Diabetes: A Prospective Cohort Study. Journal of General Internal Medicine. 2010;25(5):423–429. [DOI] [PMC free article] [PubMed] [Google Scholar]
- 25.Beiser A, D’Agostino RB Sr., Seshadri S, et al. Computing estimates of incidence, including lifetime risk: Alzheimer’s disease in the Framingham Study. The Practical Incidence Estimators (PIE) macro. Stat Med. 2000;19(11–12):1495–1522. [DOI] [PubMed] [Google Scholar]
- 26.Statistics NOoV. Natality and mortality statistics United States, 1945. Vol 271947. [PubMed] [Google Scholar]
- 27.Mehta KM, Yeo GW. Systematic review of dementia prevalence and incidence in United States race/ethnic populations. Alzheimer’s & dementia : the journal of the Alzheimer’s Association. 2017;13(1):72–83. [DOI] [PubMed] [Google Scholar]
- 28.Bot Census. 1920 Census: Volume 3. Population, Composition and Characteristics of the Population by States. 1922.
- 29.Murray P States’ Laws on Race and Color; and Appendices Containing International Documents, Federal Laws and Regulations, Local Ordinances and Charts. Athens, GA: Women’s Division of Christian Services; 1951. [Google Scholar]
- 30.Williams DR, Roberts SJ, Davies TW. Deaths from ischaemic heart disease and infant mortality in England and Wales. Journal of epidemiology and community health. 1979;33(3):199–202. [DOI] [PMC free article] [PubMed] [Google Scholar]
- 31.Buck C, Simpson H. Infant diarrhoea and subsequent mortality from heart disease and cancer. Journal of epidemiology and community health. 1982;36(1):27–30. [DOI] [PMC free article] [PubMed] [Google Scholar]
- 32.Power C, Hertzman C. Social and biological pathways linking early life and adult disease. Br Med Bull. 1997;53(1):210–221. [DOI] [PubMed] [Google Scholar]
- 33.Momtaz YA, Haron SA, Hamid TA, et al. Does food insufficiency in childhood contribute to dementia in later life? Clinical interventions in aging. 2015;10:49–53. [DOI] [PMC free article] [PubMed] [Google Scholar]
- 34.Hackman DA, Farah MJ. Socioeconomic status and the developing brain. Trends Cogn Sci. 2009;13(2):65–73. [DOI] [PMC free article] [PubMed] [Google Scholar]
- 35.Seifan A, Schelke M, Obeng-Aduasare Y, et al. Early Life Epidemiology of Alzheimer’s Disease--A Critical Review. Neuroepidemiology. 2015;45(4):237–254. [DOI] [PMC free article] [PubMed] [Google Scholar]
- 36.Borenstein AR, Copenhaver CI, Mortimer JA. Early-life risk factors for Alzheimer disease. Alzheimer disease and associated disorders. 2006;20(1):63–72. [DOI] [PubMed] [Google Scholar]
- 37.Manivannan Y, Manivannan B, Beach TG, et al. Role of Environmental Contaminants in the Etiology of Alzheimer’s Disease: A Review. Current Alzheimer Research. 2015;12(2):116–146. [DOI] [PMC free article] [PubMed] [Google Scholar]
- 38.Lim SL, Rodriguez-Ortiz CJ, Kitazawa M. Infection, systemic inflammation, and Alzheimer’s disease. Microbes Infect. 2015;17(8):549–556. [DOI] [PubMed] [Google Scholar]
- 39.Glymour MM, Manly JJ. Lifecourse Social Conditions and Racial and Ethnic Patterns of Cognitive Aging. Neuropsychology Review. 2008;18(3):223–254. [DOI] [PubMed] [Google Scholar]
- 40.Kochanek KD, Murphy SL, Xu JQ, et al. Deaths: Final data for 2014. Vol 65 Hyattsville, MD: National Center for Health Statistics; 2016. [PubMed] [Google Scholar]
Associated Data
This section collects any data citations, data availability statements, or supplementary materials included in this article.