Abstract
Familial LCAT deficiency (FLD) is due to mutations in lecithin:cholesterol acyltransferase (LCAT), a plasma enzyme that esterifies cholesterol on lipoproteins. FLD is associated with markedly reduced levels of plasma high-density lipoprotein and cholesteryl ester and the formation of a nephrotoxic lipoprotein called LpX. We used a mouse model in which the LCAT gene is deleted and a truncated version of the SREBP1a gene is expressed in the liver under the control of a protein-rich/carbohydrate-low (PRCL) diet-regulated PEPCK promoter. This mouse was found to form abundant amounts of LpX in the plasma and was used to determine whether treatment with recombinant human LCAT (rhLCAT) could prevent LpX formation and renal injury. After 9 days on the PRCL diet, plasma total and free cholesterol, as well as phospholipids, increased 6.1 ± 0.6-, 9.6 ± 0.9-, and 6.7 ± 0.7-fold, respectively, and liver cholesterol and triglyceride concentrations increased 1.7 ± 0.4- and 2.8 ±0.9-fold, respectively, compared with chow-fed animals. Transmission electron microscopy revealed robust accumulation of lipid droplets in hepatocytes and the appearance of multilamellar LpX particles in liver sinusoids and bile canaliculi. In the kidney, LpX was found in glomerular endothelial cells, podocytes, the glomerular basement membrane, and the mesangium. The urine albumin/creatinine ratio increased 30-fold on the PRCL diet compared with chow-fed controls. Treatment of these mice with intravenous rhLCAT restored the normal lipoprotein profile, eliminated LpX in plasma and kidneys, and markedly decreased proteinuria. The combined results suggest that rhLCAT infusion could be an effective therapy for the prevention of renal disease in patients with FLD.
Introduction
Lecithin:cholesterol acyltransferase (LCAT) (EC2.3.1.43) is the only plasma enzyme capable of catalyzing cholesteryl ester (CE) formation from free cholesterol (FC) and phosphatidylcholine (lecithin). Plasma CE formation is a critical step in high-density lipoproteins (HDL) maturation and reverse cholesterol transport, the process by which excess cellular cholesterol from peripheral tissues is transported to the liver for excretion (Glomset, 1968; Ahsan et al., 2014). FC resides in the outer shell of HDL and exchanges freely and rapidly between lipoproteins and membranes. Because of its increased hydrophobicity, CE, once formed, partitions into the hydrophobic core of HDL, where it is no longer able to exchange, causing small, discoidal-shaped HDL particles to mature into larger, spherical HDL particles enriched in CE. CE is eventually delivered by HDL to the liver either directly, via the liver scavenger receptor SR-BI, or indirectly, after cholesterol ester transfer protein-catalyzed transfer of CE from HDL to low-density lipoproteins (LDL), followed by LDL-CE delivery to the liver via the LDLR pathway (Karathanasis et al., 2017).
Familial LCAT deficiency (FLD) is associated with low levels of plasma HDL cholesterol and cholesteryl ester, corneal opacities, anemia, and the development of proteinuria in early adulthood that gradually progresses to nephrotic syndrome and end-stage renal failure, often by 40–50 years of age. A number of experimental and clinical studies have shown that LpX, an abnormal lipoprotein in patients with FLD, contributes to glomerulopathy (Gjone, 1974; Imbasciati et al., 1986). Consistent with these findings, LCAT-deficient mice kept on normal chow diet do not form substantial amounts of LpX or develop kidney dysfunction, but injection of synthetic LpX into these mice induces proteinuria (Ossoli et al., 2016). There is no specific therapy for FLD, but recombinant human LCAT (rhLCAT) has been shown to be safe in a Phase I trial (Shamburek et al., 2016b) and to rapidly normalize the lipoprotein profile and the percent of plasma cholesterol esterified in a single FLD patient treated with rhLCAT (Shamburek et al., 2016a).
Unlike normal lipoproteins, LpX forms vesicular-like particles rich in phospholipids and FC and is poor in neutral lipids (cholesteryl esters and triglycerides), because it lacks a hydrophobic core. It is also relatively depleted of proteins, which mostly consist of albumin located in its aqueous core and a small amount of C apolipoproteins on its surface (Seidel et al., 1969, 1970). The origin of LpX particles is not well understood, but may form as a consequence of the partial lipolysis of neutral lipids in VLDL, which in the absence of sufficient levels of CE, spontaneously reorganize into phospholipid-rich vesicles (Narayanan, 1979; Zhu et al., 2004). LpX-like particles also form in plasma of patients with cholestasis, likely due to reflux of phospholipid and FC-rich bile into plasma (Kostner et al., 1976; Sörös et al., 1998; Heimerl et al., 2016). In addition to LpX and low HDL, other lipoprotein abnormalities have also been noted in FLD that are mostly related to the enrichment of FC in apoB-containing lipoproteins (Kostner et al., 1976).
To investigate the relationship between LpX and kidney dysfunction, we used a previously described LCAT-deficient mouse model expressing a truncated “dominant positive” version of the lipogenic transcription factor SREBP1a under control of the liver-specific rat PEPCK promoter [LCAT-knockout (KO) × SREBP1a mice] (Short et al., 1992; Shimano et al., 1996; Zhu et al., 2004). This SREBP1a transgene is not downregulated by sterols and remains in the nucleus where it constitutively activates lipid biosynthetic genes, leading to the accumulation of cholesterol and triglycerides in liver of SREBP1a transgenic mice, particularly when fed a protein rich/carbohydrate low (PRCL) diet (Shimano et al., 1996) that induces the PEPCK promoter. On a normal standard mouse chow diet, LCAT-KO × SREBP1a mice gradually accumulate LpX in plasma and after at least 6 to 7 months of age develop moderate proteinuria.
We developed a more acute model of kidney injury related to LpX by feeding LCAT-KO × SREBP1a mice with a PRCL diet to stimulate SREBP1a transgene expression and liver lipogenesis (Short et al., 1992). After less than 2 weeks on the PRCL diet, the mice showed a marked increase in total plasma lipids, liver weight, and cholesterol and triglycerides content and had large accumulations of LpX in plasma, liver, and renal glomeruli. These lipid changes were associated with the development of severe proteinuria. Treatment of these mice with rhLCAT prevented LpX formation and proteinuria and therefore demonstrate the feasibility of using rhLCAT as a potential therapy for the prevention of renal disease in FLD.
Methods
Animal Studies.
LCAT-KO × SREBP1a mice were created by crossing LCAT-KO mice (Sakai et al., 1997) on a C57Bl/6N background (MMRRC Stock No. 11840-MU), with transgenic mice containing the human SREBP1a cDNA under control of the rat PEPCK promoter on a C57Bl/6J × SJL F1 genetic background (Shimano et al., 1996) (Stock 002840; Jackson Laboratory, Bar Harbor, ME), as previously described (Zhu et al., 2004). Routine genotyping of LCAT-KO × SREBP1a mice was done by Transnetyx (Cordova, TN) using real-time PCR. No sex-specific differences were observed in any of the studied parameters, so results from male and female mice were pooled. Mice were housed under controlled conditions, with a 12:12-hour light/dark cycle and were fed ad libitum either a standard rodent autoclaved chow diet containing 4.0% fat (NIH31 chow diet; Zeigler Brothers Inc., Gardners, PA) or a protein-rich/carbohydrate low (PRCL) diet (Cat. No. TD.140565; Envigo, Huntingdon, UK), containing by weight 70% casein, 10% carbohydrates, and 10% fat (Short et al., 1992). All animal experiments were approved by the Animal Care and Use Committee of the National Heart, Lung, and Blood Institute (NIH Protocol #H-0050).
Analyses of Plasma Lipids and Renal Function.
Plasma was prepared from blood collected from the periorbital sinus of the contralateral eye as described earlier, and lipids were measured enzymatically, as previously described (Rousset et al., 2010). Plasma lipoproteins were fractionated by fast protein liquid chromatography (FPLC, Akta FPLC; GE Healthcare, Chicago, IL) on two Superose 6 columns in series (Vaisman et al., 2012). LpX was detected in plasma by electrophoresis in Sebia Hydragel Lipoprotein (E) 15/30 gels and in tissue by transmission electron microscopy (TEM), as previously described (Ossoli et al., 2016). To determine the FC content of plasma LpX, the fluorescent intensity of the LpX region of each sample on filipin-stained gels, as well as total fluorescent intensity throughout the gel lane for each sample, was quantitated after subtracting background fluorescence using ImageQuant Version 5.2 (Molecular Dynamics, Sunnyvale, CA) software. The relative amount of LpX in each plasma sample was calculated as [(LpX fluorescent intensity)/(total fluorescent intensity)] and the concentration of FC in LpX was then determined by multiplying this ratio by the plasma concentration of FC in the sample.
Urine albumin was measured by ELISA (Albuwell M ELISA kit) and creatinine by a colorimetric assay (The Creatinine Companion, Exocell, PA). Proteinuria was calculated as the ratio of albumin (micrograms)/creatinine (milligrams).
Analysis of Tissue Lipids and Total Protein.
To determine the cholesterol concentration in liver, lipids were extracted by the Folch method (Folch et al., 1957) as follows: approximately 50 mg of tissue was homogenized in Precellys24 (Bertin Technologies, Rockville, MD) in tubes (CK28) with 1.2 ml of freshly prepared chloroform-methanol mixture (2:1). Samples were homogenized at 6500 RPM for 20 seconds, cooled on ice for 3–5 minutes, and homogenized a second time at 6500 RPM for 20 seconds. The tubes were then vortexed for 15 minutes and centrifuged at 14,000 g for 10 minutes at 4°C. The supernatant was transferred to new tubes. To the precipitate, 0.3 ml of chloroform-methanol mixture (2:1) was added, the tubes were vortexed for 20–30 seconds and then centrifuged as before. The supernatant was combined with the previously collected supernatant. Lipid extracts were washed with 0.2 volume of saline and the tubes were then briefly vortexed and centrifuged as before. The upper phase was discarded, and the lower phase was evaporated under a stream of nitrogen. To eliminate the last traces of residual solvent, the tubes were placed in a Speed-Vac for 30 minutes. The cholesterol content in these lipid extracts was then measured enzymatically, using the Cell Biolabs total cholesterol assay kit (cat. No. STA-384).
Liver triglycerides were measured as previously described (Norris et al., 2003; Jouihan, 2012) with minor modifications. The TRIGL reagent for the Cobas chemistry analyzer (Cat. No. 20767107322; Roche Diagnostics, Indianapolis, IN) was used for the Triglyceride (GPO Trinder) reagent A. Three microliters of the final extract and 250 µl of the TRIGL reagent were used. The samples were placed into a 96-well plate and incubated 10 minutes at room temperature. Absorbance was measured at 505 nm in a SpectraMax 384Plus plate reader.
Liver protein concentration was determined using a total protein assay kit from QuickZyme BioSciences (Product Code QZBTOTPROT1; supplier, Cedarlane, Westbury, NY) following manufacturer instructions.
Analysis of Gene Expression in Kidney and Liver.
The effect of the PRCL diet on expression of several cholesterol metabolism-related genes was studied by real-time PCR with TaqMan assays (Vaisman et al., 2012). All reagents used in real-time PCR experiments were obtained from Applied Biosystems (Foster City, CA). mRNA levels of the following genes in kidney were measured: Dhcr24 (Assay ID Mm00519071_m1), Hmgcr (Mm01282499_m1), and Ldlr (Mm01151337_m1). In liver, mRNA levels of Abca1 (Assay ID Mm00442636_m1), Abcg1 (Mm00437390_m1), Apoa1 (Mm00437569_m1), Hmgcr (Mm01282499_m1), Ldlr (Mm01177349_m1), Pcsk9 (Mm01263610_m1), and Scarb1 (known also as Sr-b1) (Mm00450234_m1) in rhLCAT- versus vehicle-treated mice kept on PRCL diet were determined. Gene expression was normalized against expression of two reference genes: mouse beta-actin (Mm02619580_g1) and Gapdh (Mm99999915_g1). For gene expression analysis, ABI SDS 2.4 and Qiagen REST 2009 v.2.013 software were used.
Analysis of Tissue by Electron Microscopy.
Mouse kidney cortex and liver samples were cut into 1-mm3 pieces in 2.5% glutaraldehyde, 1% paraformaldehyde, 0.12 M sodium cacodylate buffer, pH 7.4, at room temperature and then placed in fresh fixative overnight at 4°C. Fixed samples were washed in cacodylate buffer, postfixed in 1% OsO4 in cacodylate buffer, washed, stained en bloc with uranyl acetate, ethanol dehydrated, and EMbed-812 embedded (Electron Microscopy Sciences, Hatfield, PA). Thin sections were stained with uranyl acetate and lead citrate prior to imaging with a JEM1400 electron microscope (JEOL USA, Peabody, MA) equipped with an AMT XR-111 digital camera (Advanced Microscopy Techniques Corp., Woburn, MA). A minimum of three mice per control and experimental groups were processed and imaged.
rhLCAT Treatment of Mice.
rhLCAT (MEDI6012) was produced as previously described (Manthei et al., 2017). Human and mouse LCAT enzymes possess a high degree of homology (Peelman et al., 1999), and indeed we found 87% identity between human and mouse LCAT reference protein sequences by BLAST analysis. Recombinant human LCAT was previously shown to be active and to have a half-life of 1.23 hours in LCAT-KO mice, with elevated CE and increased HDL persisting for over 24 hours (Rousset et al., 2010). In the current study, rhLCAT was injected intravenously through the retro-orbital sinus with a 28.5-gauge needle at a dose of 10 mg/kg. rhLCAT injections were started on day 2 of the PRCL diet, and the last injection was performed 1 day before the animals were euthanized. The complete dosing schedule for each experiment is described in the figure legends.
Statistical Analysis.
All data were analyzed by Student’s t-test with GraphPad PRISM version 7.02 software. Statistically significant differences were defined as a two-tailed probability of less than 0.05. Unless otherwise indicated, all results are presented as mean ± S.E.M.
Results
The PRCL Diet Rapidly Increases Plasma Lipids and Induces LpX Formation.
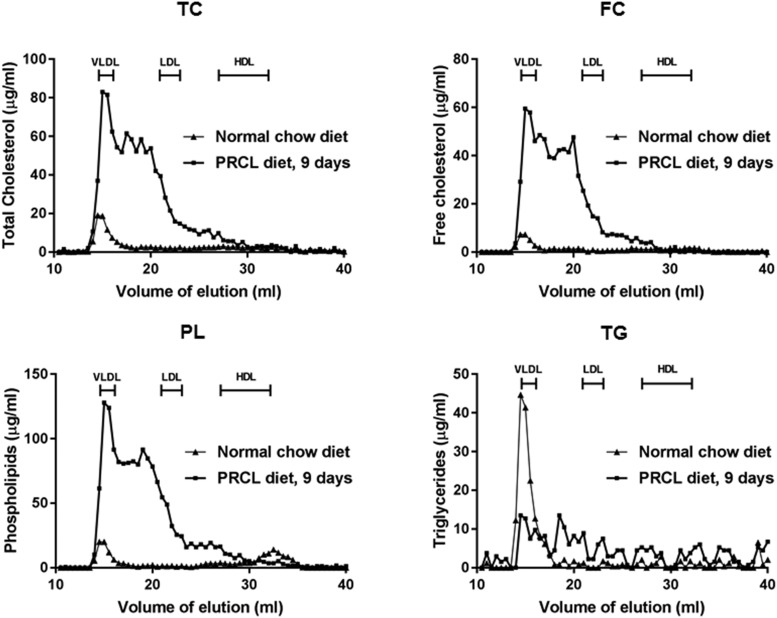
Using LCAT-KO × SREBP1a mice (Zhu et al., 2004) fed a PRCL diet, we developed an acute LpX kidney injury model. Consistent with previous reports (Zhu et al., 2004), on a normal chow diet, these mice have nearly normal total plasma cholesterol (Table 1) but, as expected, have very low levels of HDL cholesterol (Fig. 1). Most of the plasma cholesterol in these mice on a chow diet is in the VLDL fraction. Once on a PRCL diet, total plasma cholesterol increased over sixfold (Table 1), with the majority of it remaining unesterified as FC. As was previously observed for LCAT-KO mice on a high-fat diet, plasma CE levels also increased, likely formed intracellularly in the liver or intestine by ACAT and later appearing in the plasma as a consequence of the secretion of lipoproteins (Thacker et al., 2015). By FPLC analysis (Fig. 1), most of the total plasma lipid changes on the PRCL diet (Table 1) were due to increases in lipids on VLDL/LDL-sized lipoproteins (Fig. 1, fractions with elution volume between 14 and 23 ml), which were enriched in FC and phospholipids, both hallmarks of LpX formation (Narayanan, 1984; Ahsan et al., 2014). Total plasma lipids returned to near normal levels 2 weeks after returning the mice to a normal chow diet (Table 1).
TABLE 1.
Effect of 9 days on PRCL diet on plasma lipids of 2- to 3-mo-old LCAT-KO × SREBP1a mice
| Diet | Plasma Lipids | ||||
|---|---|---|---|---|---|
| TC | TG | PL | FC | CE | |
| mg/dl | |||||
| Chow diet (n = 35–41) | 45.1 ± 4.0 | 36.3 ± 3.0 | 78.8 ± 4.7 | 16.0 ± 1.5 | 29.0 ± 2.8 |
| After 9 days on PRCL diet (n = 32–37) | 274.2 ± 13.7 | 127.6 ± 10.8 | 525.8 ± 42 | 153.1 ± 3.2 | 121.0 ± 12.1 |
| 14 d after returning to chow diet, n = 21 | 53.1 ± 4.1 | 58.7 ± 6.1 | 97.8 ± 7.5 | 19.4 ± 1.7 | 33.7 ± 2.8 |
| Fold-increase after 9 days on PRCL diet | |||||
| 6.1 ± 0.6 | 3.5 ± 0.4 | 6.7 ± 0.7 | 9.6 ± 0.9 | 4.2 ± 0.6 | |
| P value | <0.0001 | <0.0001 | <0.0001 | <0.0001 | <0.0001 |
Fig. 1.
FPLC analysis of lipoproteins of mice on chow vs. PRCL diet. LCAT-KO × SREBP1a mice (2.6 months old) were placed on indicated diet for 9 days. Plasma (200 µl) from a pool of four mice was fractionated by FPLC and analyzed for the following lipids: FC, free cholesterol; PL, phospholipids; TC, total cholesterol; TG, triglycerides. Locations of known migration position of lipoproteins are indicated.
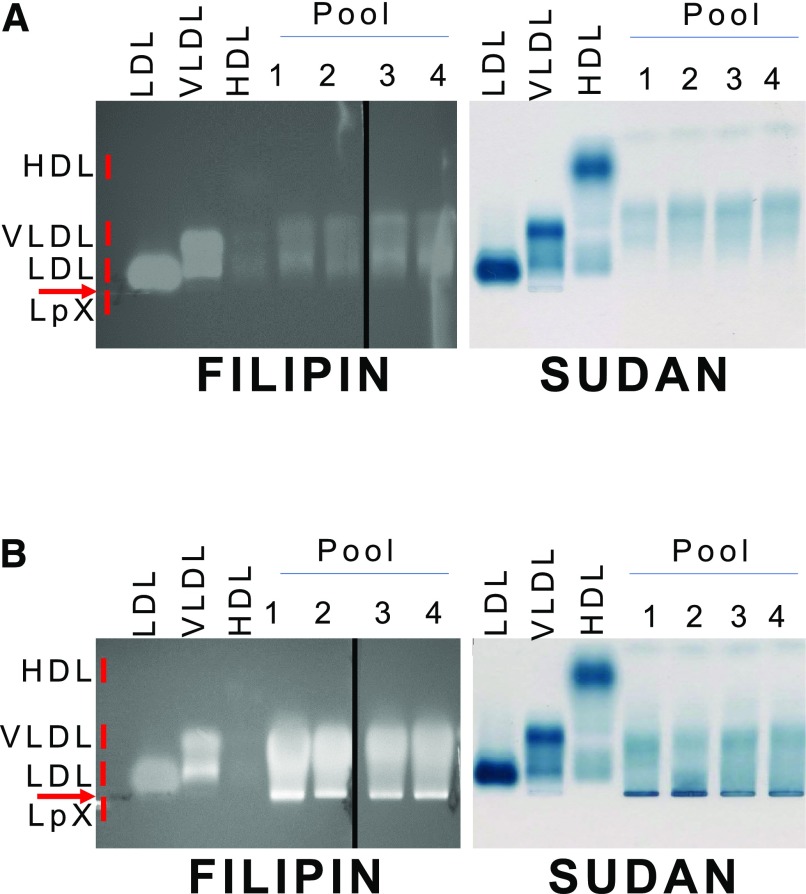
Depending on the agarose gel system, LpX in plasma from human FLD and cholestatic patients is known either to be trapped in the origin of the gel or to migrate slightly toward the cathode during electrophoresis (Torsvik et al., 1972; O and Frohlich, 1995; Freeman et al., 2017). It can sometimes be detected by Sudan Black staining for neutral lipids but often can be more readily observed by staining for FC with filipin (Ossoli et al., 2016; Freeman et al., 2017). By Sudan Black staining (Fig. 2), we observed mostly VLDL-like particles and the lack of HDL from mice on the chow diet. After 9 days on the PRCL diet, we observed a distinct band after Sudan Black staining just below the origin, corresponding to the known migration position of LpX. By filipin staining (Fig. 2), this LpX band appeared to contain FC. Quantitative analysis indicated that the concentration of FC in this LpX band was 22.2 ± 1.6 mg/dl or 14.6% ± 1.1% of all FC in plasma. Compared with chow-fed mice, we also observed a marked enrichment of FC in FPLC fractions corresponding to VLDL and LDL (Fig. 1).
Fig. 2.
Electrophoretic analysis of plasma lipoproteins of mice on chow vs. PRCL diet. Agarose gel electrophoresis of plasma from mice before (A) or 9 days after (B) placement on the PRCL diet. Gels were stained with filipin to detect free cholesterol (left panels) or Sudan Black to detect neutral lipids (right panels). Plasma from a total of 21 mice before and after the diet was divided into four pools, containing plasma from 6, 5, 5, and 5 mice. Ten microliters from each pool were loaded onto the agarose gels. LDL, VLDL, and HDL used as markers of lipoproteins were isolated from human plasma.
The PRCL Diet Induces Lipid and LpX Accumulation in the Liver.
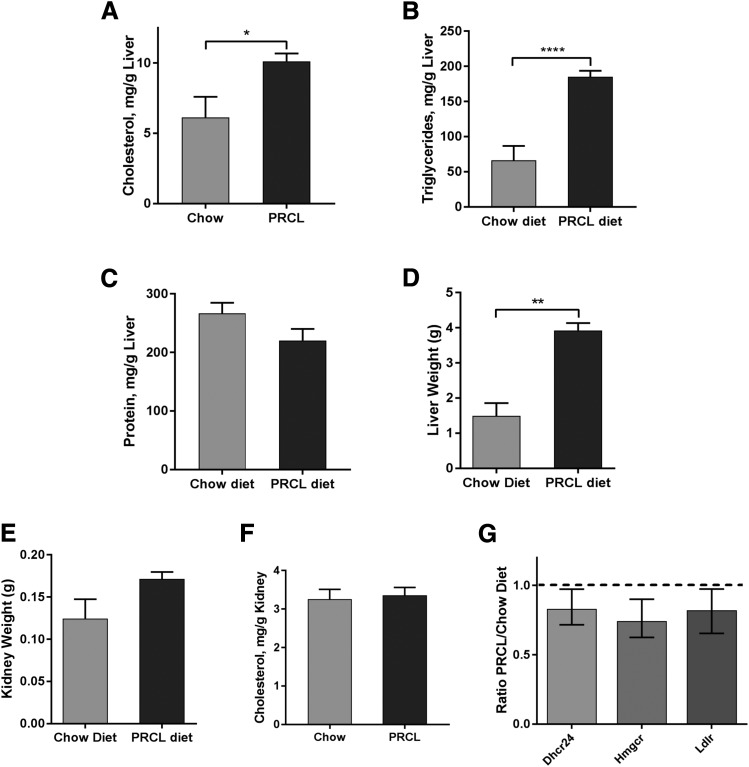
Previous work showed that mice with a normal LCAT gene, but transgenic for truncated SREBP1a under the control of the PEPCK promoter, shows dramatically increased hepatic biosynthesis of cholesterol and other lipids and develop hepatomegaly when fed a PRCL diet for 2 weeks (Shimano et al., 1996). In our study, we found that the absence of the LCAT gene (LCAT-KO) in the same SREBP1a transgenic mice background led to a very similar lipid phenotype even on a normal chow diet. On the normal chow diet, liver cholesterol levels in the LCAT-KO × SREBP1a mice was 6.1 ± 1.5 mg/g (Fig. 3A) compared with 2.1 ± 0.1 mg/g for control mice in a similar background (C57BL/6:129/SvJae) (Repa et al., 2004). On a PRCL diet for 9 days, the concentration of cholesterol in liver of LCAT-KO × SREBP1a mice was even higher (Fig. 3A, P < 0.02), reaching 10.1 ± 0.6 mg/g. Simultaneously, the liver triglyceride concentration was elevated 2.8 ± 0.9-fold (from 66 to 185 mg/g, Fig. 3B, P < 0.0001).
Fig. 3.
Effect of PRCL diet on liver and kidney. Tissues were isolated from 2.9-month-old LCAT-KO × SREBP1a mice fed a regular chow (n = 3 for livers and 4 for kidney) or PRCL diet (n = 6 for liver and 5 for kidney) for 9 days. The PRCL diet markedly increased liver concentration of cholesterol (A) and triglycerides (B) (1.65 ± 0.4-fold and 2.8 ± 0.9-fold, respectively). Changes in protein concentration in liver (C) were statistically nonsignificant. Liver weight (D) was increased 2.6 ± 0.7-fold on the PRCL diet. Kidney weight (E) did not significantly increase after 9 days on the PRCL diet. (F) Cholesterol concentration in kidney did not significantly increase on the PRCL diet. (G) Expression of cholesterol metabolism genes Dhcr24, Hmgcr, and Ldlr in the kidney did not change on PRCL diet. The ratio of mRNA levels on the PRCL diet (n = 6) to levels on the chow diet (n = 4) are shown. *P < 0.05; **P < 0.01; ****P < 0.00001.
The protein concentration in liver did not change significantly (Fig. 3C). However, liver weight increased by 2.6 ± 0.7-fold during the relatively short time on the PRCL diet (9 days) (Fig. 3D, P < 0.001). The effect of the PRCL diet on liver metabolism was similar to what was previously observed in SREBP1a transgenic mice, which, in contrast to our mouse model, had the endogenous mouse Lcat gene (Shimano et al., 1996). Triglyceride levels were lower in liver of our mice compared with Shimano et al., likely because they were younger, maintained on PRCL diet for a shorter time (9 vs. 14 days) and were LCAT-deficient.
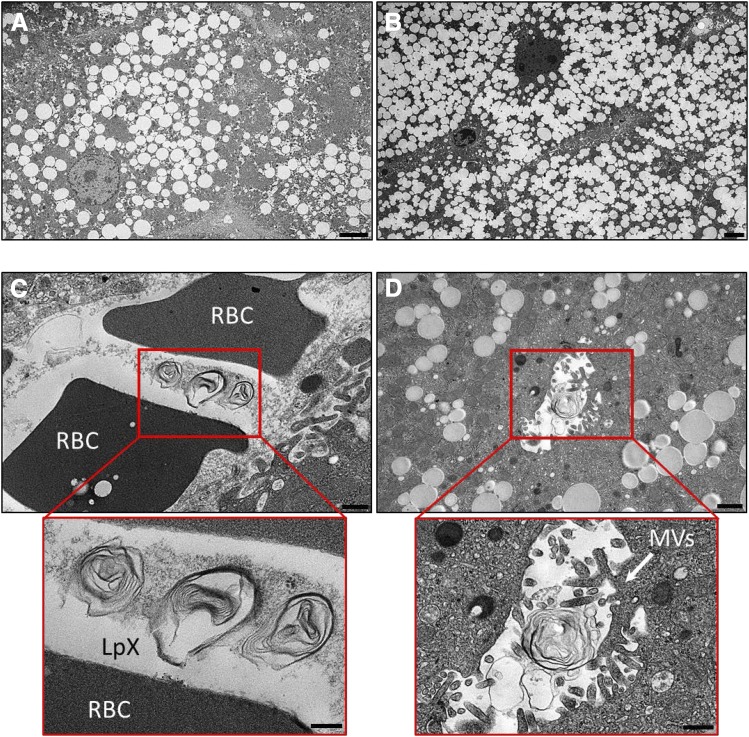
Transmission electron microscopy (TEM) of liver tissue from chow-fed LCAT-KO × SREBP1a mice revealed large numbers of intracellular lipid droplets in hepatocytes (Fig. 4A). After 9 days on the PRCL diet, the number of lipid droplets in the hepatocytes was further increased (Fig. 4B), consistent with increased liver cholesterol and triglyceride content and liver weight (Fig. 3, A, B, and D). Importantly, TEM also demonstrated the appearance of multilamellar LpX particles in liver sinusoids and in bile canaliculi when on the PRCL diet (Fig. 4, C and D). A similar location of LpX particles was previously described in the cholestatic rat liver (Felker et al., 1978).
Fig. 4.
PRCL diet increases lipid accumulation and promotes the appearance of LpX in the liver of LCAT-KO × SREBP1a mice. (A) Liver from mice maintained on a normal chow diet. Note the accumulation of numerous lipid droplets in hepatocytes. (B–D) Livers from mice after 9 days on the PRCL diet. (B) Note the massive increase in hepatocyte lipid droplet accumulation. LpX particles were observed in liver sinusoids (C) containing RBCs and in bile canaliculi (D) with characteristic microvilli. LpX particles are clearly seen to be multilamellar in the insets (enlarged red boxes) in (C and D). RBC, red blood cell; MVs, microvilli. Scale bars (A and B) 4 µm; (C) 500 nm; (D) 1 µm; inset (C); 200 nm; inset (D); 500 nm.
The PRCL Diet Induces LpX Renal Accumulation and Proteinuria.
In contrast to the liver, kidney weight did not appear to increase significantly on the PRCL diet (Fig. 3E). Similarly, kidney cholesterol content did not differ between the PRCL and chow-diet fed mice (Fig. 3F). Consistent with this, expression of several cholesterol metabolism-related genes in the kidney, such as Dhcr24, Hmgcr, and Ldlr, also did not change significantly on the PRCL diet (Fig. 3G). These data suggest that PRCL diet feeding has no apparent effects on kidney lipid metabolism.
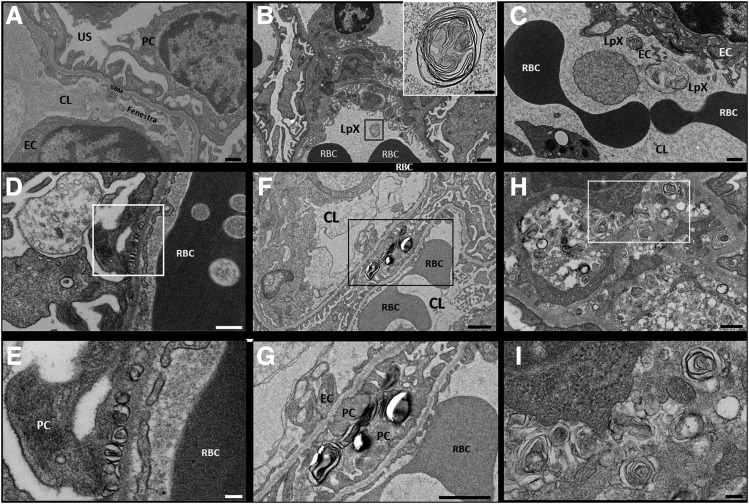
TEM analysis of kidney tissue from LCAT-KO × SREBP1a mice fed the PRCL diet for 9 or 15 days showed similar results. TEM revealed multilamellar LpX particles (Fig. 5, B–I), which were not observed in renal glomeruli from mice on the normal chow diet (Fig. 5A). Abundant LpX particles were found in the renal glomerular capillary loops and were also seen bound to glomerular endothelial cells (Fig. 5, B and C) and to podocytes in the urinary space (Fig. 5, F and G). Moreover, LpX was also observed to be entrapped in both the glomerular basement membrane (GBM) (Fig. 5, D and E) and, at a much higher level, the mesangium (Fig. 5, H and I).
Fig. 5.
The PRCL diet induces accumulation of LpX particles in renal glomeruli of LCAT-KO × SREBP1a mice. (A) LpX particles were not seen in the renal glomeruli of mice on a normal chow diet. (B–I) In mice maintained for 9 or 15 days on a PRCL diet, LpX was observed in all renal glomerular compartments. (B) LpX was observed in the renal capillary lumen (enlarged in the inset) and was also found to be bound to capillary endothelial cells (C) and to podocytes in the urinary space as well (F and G) [enlargement of area in black box in (F)]. LpX was observed to be entrapped in the glomerular basement membrane (D), (E) enlargement of area in white box in (D), and in the mesangium (H and I) [enlargement of area in white box in (H)]. CL, capillary lumen; EC, endothelial cell; GBM, glomerular basement membrane; PC, podocyte; RBC, red blood cell. Scale bars, (A and C) 500 nm; (B, F, and G) 1 µm, (B inset) 200 nm; (D) 400 nm; (E and I) 100 nm; (F) 300 nm.
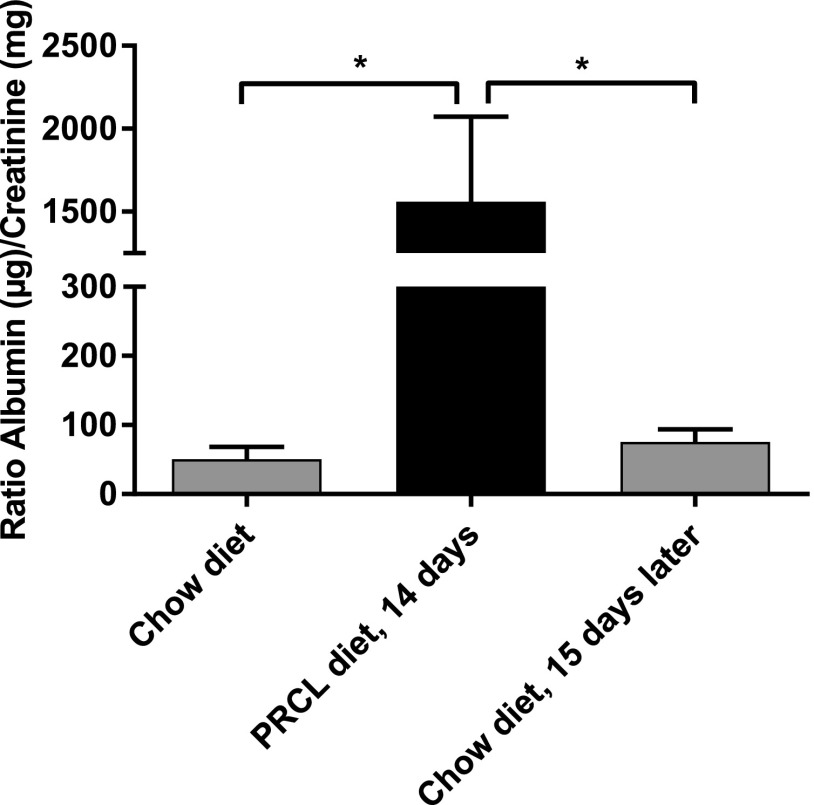
The presence of LpX particles in the kidney was accompanied by the development of significant proteinuria. After 14 days on the PRCL diet, the albumin/creatinine ratio increased 31 ± 4-fold (Fig. 6, P < 0.05) compared with baseline. Similar results were obtained for mice kept 7–9 days on the PRCL diet (see Fig. 11).
Fig. 6.
PRCL diet induces proteinuria. LCAT-KO × SREBP1a mice (n = 5) were maintained either on a normal chow or on the PRCL diet for 14 days, and urine was analyzed for albumin and creatinine. Proteinuria returned to near baseline 15 days after returning the mice to a normal chow diet. *P < 0.04.
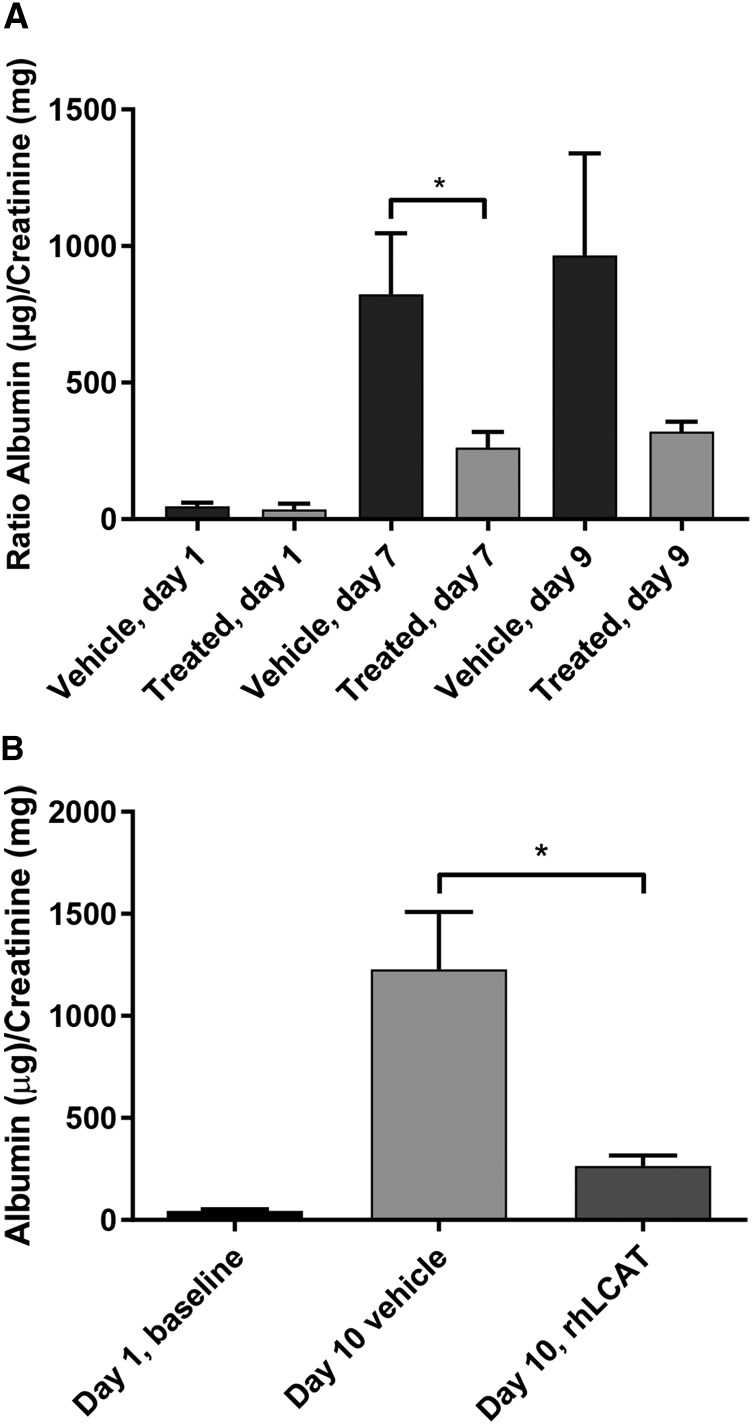
Fig. 11.
rhLCAT injection decreases proteinuria. Effect of intravenous injections of rhLCAT on kidney function in LCAT-KO × SREBP1a mice kept on a PRCL diet. (A) LCAT-KO × SREBP1a mice were placed on PRCL diet for 9 days and treated as described in the legend for Fig. 10. In control group (saline injections) n = 3; in the rhLCAT treated group n = 4. *P < 0.04. (B) LCAT-KO × SREBP1a mice were kept on PRCL diet for 10 days and received four injections of rhLCAT in dose 21.4 mg/kg on days 2, 4, 7, and 9 (n = 8) or vehicle (n = 6). Day 1 baseline, n = 14; *P < 0.02.
Interestingly, all changes induced by the PRCL diet were reversible. Similar to what was observed for plasma lipids (Table 1), 2 weeks after the mice were returned to the normal chow diet, proteinuria returned to near baseline (Fig. 6).
rhLCAT Treatment Prevents Plasma Lipid Abnormalities and LpX Formation.
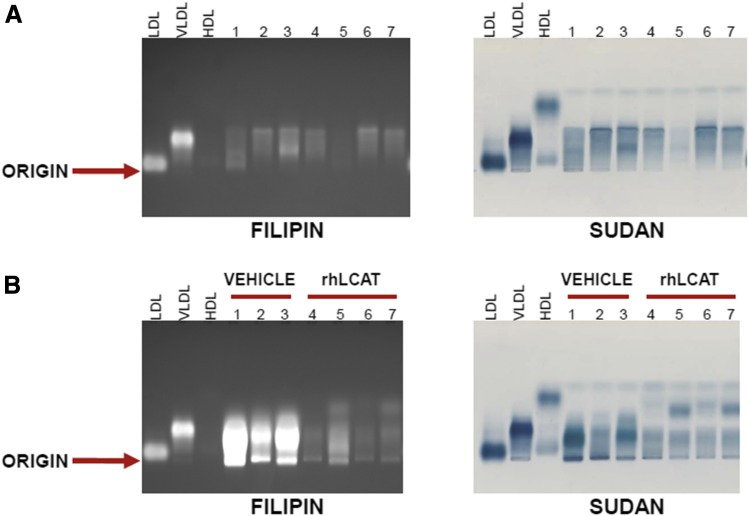
We next investigated whether treatment with rhLCAT prevents the PRCL diet-induced lipid abnormalities in the LCAT-KO × SREBP1a mice. As we observed before (see Fig. 2A), LCAT-KO × SREBP-1a mice on regular chow diet had very little FC, as assessed by filipin staining (Fig. 7A), and moderate amounts of neutral lipids, mostly migrating in the vicinity of VLDL (broad beta) (Fig. 7A, Sudan Black staining). In contrast, LCAT-KO × SREBP1a mice on the PRCL diet for 9 days had lipoproteins highly enriched in FC, as seen by filipin staining (Fig. 7B, lanes 1–3). These same bands were also moderately increased by Sudan Black staining (Fig. 7B). As before, bands corresponding to LpX were observed near the origin. Quantitative analysis demonstrated that after 9 days on the PRCL diet, the concentration of FC in LpX of LCAT-KO × SREBP1a mice (Fig. 7B, Filipin staining, lanes 1–3) was 31.5 ± 5.1 mg/dl or 20.8% ± 3.9% of all FC in plasma.
Fig. 7.
Electrophoretic analysis of plasma from LCAT-KO × SREBP1a mice fed a PRCL diet and treated with rhLCAT. (A) 2.5-month old LCAT-KO × SREBP1a mice (mice #1–7) were kept on normal chow diet. 10 μl plasma from each mouse was loaded onto agarose gels. (B) The same mice were then maintained for 9 days on a PRCL diet and treated with three I/V injections of either saline (vehicle; n = 3) (mice #1–3) or rhLCAT (n = 4) (mice #4–7) at a dose of 10 mg/kg on days 2, 5 and 8. After the final injection, plasma was drawn and 10 μl from each mouse was loaded onto agarose gels. After electrophoresis, gels were stained for free cholesterol with Filipin (left panels) or for neutral lipids with Sudan Black (right panels) as in Figure 2.
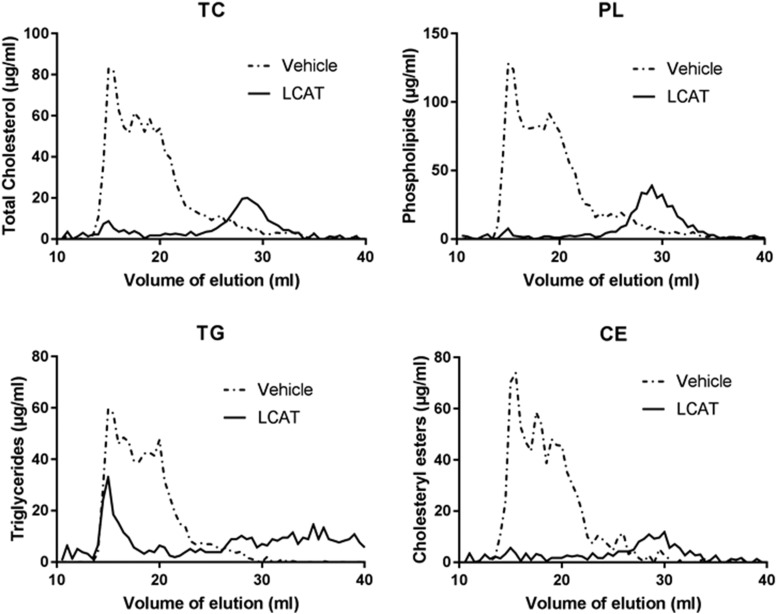
Four mice (lanes 4–7 in Fig. 7B) were placed on the same PRCL diet for 9 days but were injected with rhLCAT (three intravenous injections of rhLCAT, dose 10 mg/kg, on days 2, 5, and 8). Compared with vehicle-treated control mice (Fig. 7B, lanes 1–3), rhLCAT treatment markedly reduced LpX and the FC content of VLDL/LDL lipoproteins (Fig. 7B, lanes 4–7, Filipin staining). The FC content of plasma LpX decreased to only 4.2 ± 1.4 mg/dl in these rhLCAT-treated mice, a 7.5 ± 1-fold drop (P < 0.03) in LpX-FC compared with vehicle-treated control mice (Fig. 7B, lanes 1–3). Similar changes could also be seen with Sudan Black staining (Fig. 7B). rhLCAT treatment also resulted in the appearance of a new band that migrated just below the human HDL standard, where mouse HDL typically migrates (Fig. 7B, Sudan Black). These lipid changes and the appearance of HDL in the rhLCAT-treated animals were confirmed by FPLC analysis (Fig. 8). The FPLC profile for total cholesterol and phospholipids in rhLCAT-treated mice were similar to normal mice with most plasma lipids, including CE, in HDL fractions.
Fig. 8.
FPLC analysis of the plasma from rhLCAT-treated mice. LCAT-KO × SREBP1a mice maintained for 9 days on a PRCL diet with three intravenous injections of saline (vehicle, 200 µl of the plasma was pooled from three mice) or rhLCAT at a dose of 10 mg/kg on days 2, 5, and 8 (200 µl of the plasma was pooled from four mice). CE, cholesteryl esters; PL, phospholipids; TC, total cholesterol; TG, triglycerides.
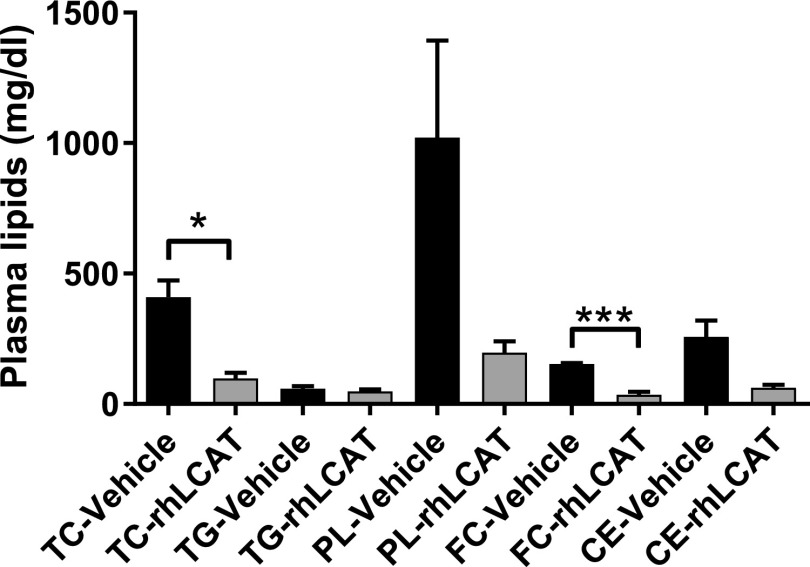
Changes observed in total plasma lipids after rhLCAT treatment are consistent with results by gel electrophoresis and FPLC analysis and are indicative of the ability of rhLCAT to normalize the lipoprotein profile of the LCAT-KO × SREBP-1a mice on the PRCL diet (Fig. 9). Total cholesterol, phospholipid, and FC showed the greatest changes with rhLCAT treatment and decreased 4.2 ± 1.1-, 5.2 ± 2.2-, and 4.3 ± 1.3-fold, respectively. Because phospholipids and FC are enriched in LpX, this is consistent with the drop in LpX observed by gel electrophoresis but is also likely due to decreases in the level of VLDL and LDL that were enriched in FC. Plasma CE also decreased but based on FPLC analysis this was mostly on VLDL/LDL, which was likely formed by ACAT. In contrast, CE on HDL, the preferred lipoprotein substrate for LCAT, markedly increased after the treatment (Fig. 8).
Fig. 9.
Total plasma lipids from rhLCAT-treated mice. LCAT-KO × SREBP1a mice maintained on a PRCL diet for 9 days. While on the diet, the mice received three injections of rhLCAT (10 mg/kg, n = 4) or saline (“Vehicle,” n = 3) on days 2, 5, and 8. CE, cholesteryl esters; FC, free cholesterol; PL, phospholipids; TC, total cholesterol; TG, triglycerides. *P < 0.03; ***P < 0.001.
rhLCAT injections significantly altered hepatic mRNA levels of the murine Abca1 and Apoa1 genes, but the effects were small (1.12- and 1.14-fold, respectively) (P < 0.05, both). mRNA levels of Abcg1, Hmgcr, Ldlr, Pcsk9, and Scarb1 were unchanged after rhLCAT treatment. Hence, rhLCAT restoration of a near-normal murine plasma lipoprotein profile, with HDL as the major lipoprotein (Fig. 8) are most consistent with previously demonstrated effects of rhLCAT on conversion of nascent HDL to mature, spherical HDL, increased HDL half-life, increased apoA-I and HDL-C levels in plasma, and remodeling of other plasma lipoproteins, including LpX (Rousset et al., 2010; Ossoli et al., 2016; Shamburek et al., 2016a).
Consistent with our TEM findings, rhLCAT treatment did not significantly alter the concentration of triglycerides (185 ± 9 mg/g on PRCL diet vs. 178 ± 11 mg/g on PRCL diet plus rhLCAT, P = 0.6) and protein (220 ± 20 mg/g on PRCL diet vs. 218 ± 8 mg/g on PRCL diet plus rhLCAT, P = 0.9) in the liver.
rhLCAT Treatment Prevents Renal LpX Accumulation and Decreases Proteinuria.
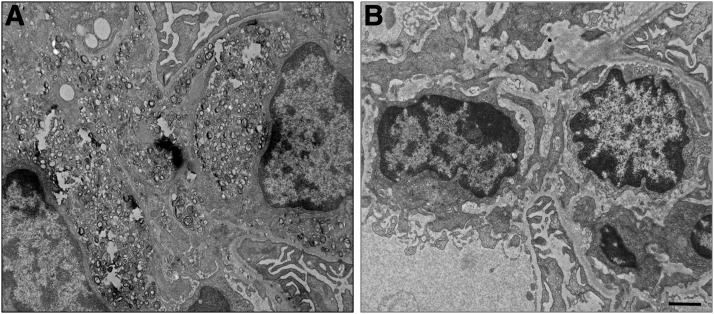
We next examined whether the normalization of plasma lipids observed with rhLCAT treatment of the LCAT-KO × SREBP1a mice on a PRCL diet alters kidney LpX deposition and function. As we observed before, vehicle-injected LCAT-KO × SREBP1a mice on the PRCL diet for 9 days show substantial accumulation of lipid droplets and LpX in the kidney (Fig. 10A). However, treatment of mice with rhLCAT (10 mg/kg on days 2, 5, and 8), during the 9-day course of the PRCL diet, prevented the appearance of lipid droplets and LpX in the kidneys (Fig. 10B). The same was true for LpX in the liver, but the presence of hepatic intracellular lipid droplets was unchanged with the rhLCAT treatment (data not shown).
Fig. 10.
rhLCAT injection prevents deposition of LpX particles in renal glomeruli. LCAT-KO × SREBP1a mice were fed the PRCL diet for 9 days. (A) In the absence of rhLCAT treatment, massive deposition of LpX particles is seen in the renal glomerular mesangial matrix. (B) LCAT-KO × SREBP1a mice fed the PRCL diet for 9 days and injected with 10 mg/kg rhLCAT on days 2, 5, and 8. Note the absence of LpX deposition in renal glomerular compartments with concomitant rhLCAT treatment. Scale bar, 1 µm.
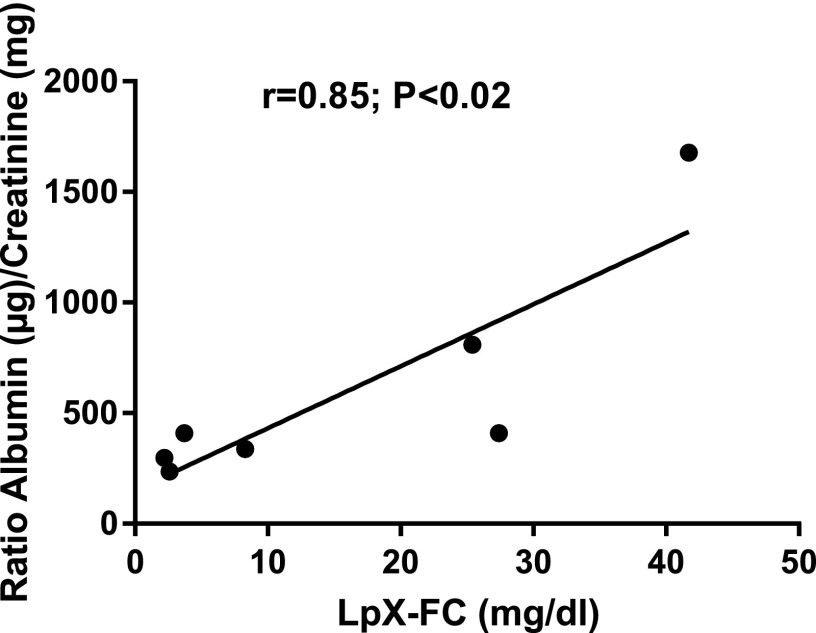
Treatment of mice on the PRCL diet with rhLCAT significantly improved proteinuria (Fig. 11). On day 1, the albumin/creatinine ratio was very low in both vehicle and rhLCAT treated animals (Fig. 11). After days 7 and 9 on the PRCL diet, the vehicle-treated animals had markedly increased albumin/creatinine ratio in the range of 800–1000 µg/mg, a 20- to 24-fold increase over baseline. Notably, the LpX concentration in the plasma of mice #1–7, maintained for 9 days on PRCL diet and treated by saline (mice #1–3) or by injections of rhLCAT (mice #4–7) (Fig. 7B), strongly correlated with proteinuria (urine albumin/creatinine ratios, Fig. 11A), with a coefficient of correlation of 0.85, P < 0.02 (Fig. 12). Moreover, the rhLCAT-treated animals in Figure 7B had a 7.5 ± 1-fold decrease in plasma LpX concentration and an approximate 3.0-fold decrease in the albumin/creatinine ratio compared with vehicle-treated mice (Fig. 11A). In an independent experiment with a slightly larger dose and a total of four injections of rhLCAT during 10 days on PRCL diet, we found an even better protective effect of the rhLCAT treatment on kidney function, reaching close to a five-fold decrease in the albumin/creatinine ratio compared with the vehicle control (Fig. 11B).
Fig. 12.
Correlation between LpX levels in plasma of LCAT-KO × SREBP1a mice and their urine albumin/creatinine ratios. The mice were kept on PRCL diet for 9 days and treated by saline (control) or rhLCAT (see Figs. 7B and 11A).
Discussion
Our primary goal in this study was to develop an acute renal injury model for LpX nephrotoxicity to test the possible efficacy of rhLCAT for reducing LpX and proteinuria in a mouse model of FLD. LCAT-deficient mice do not spontaneously accumulate LpX or develop kidney dysfunction on a normal chow diet, and develop only relatively small amounts of plasma LpX and mild glomerular lesions after 16 weeks on a high-fat/high-cholesterol diet (Lambert et al., 2001). We, therefore, used a previously described model, LCAT-KO × SREBP1a mice, in which LCAT-deficient mice express a truncated, dominant-positive SREBP1a transgene under control of the PEPCK promoter (Shimano et al., 1996; Zhu et al., 2004). We found that feeding these mice the PRCL diet, which induces the PEPCK promoter, further increased cholesterol and triglyceride concentrations in liver and FC-enriched VLDL and LDL in plasma and led to LpX formation in plasma and deposition in kidney. LpX particles, which were present in plasma with an FC concentration of approximately 20 mg/dl, induced strong proteinuria. Most importantly, rhLCAT administered over the course of the PRCL diet restored a normal lipid profile, prevented LpX accumulation, and dramatically reduced proteinuria in these mice.
Typically, patients with FLD have several decades of increasing proteinuria with relatively normal levels of serum creatinine and blood urea nitrogen. Creatinine and blood urea nitrogen usually only become abnormal very late in the disease process when patients ultimately develop end-stage renal disease, which is the main cause of morbidity and mortality for FLD (Ahsan et al., 2014). Currently, there is no specific therapy for FLD; hence, the relatively slow rate of disease progression in FLD provides an opportunity to use enzyme replacement therapy to restore LCAT levels and prevent renal disease.
Several lines of evidence demonstrate that generation of LpX in LCAT-KO × SREBP1a mice is increased when fed the PRCL diet. First, TEM analysis revealed the appearance of multilamellar particles that are characteristic for LpX (Laggner et al., 1977; Narayanan, 1979) in the liver and kidney of the mice. Second, FPLC analysis revealed phospholipid/FC enriched particles in the VLDL/LDL region that compositionally are similar to LpX isolated by FPLC (O and Frohlich, 1995; Zhu et al., 2004). Third, electrophoresis revealed bands with the characteristic migration pattern for LpX that only appeared after the PRCL diet. These bands also intensely stained with filipin, indicating that they are enriched in FC, like what has been previously reported for LpX (O and Frohlich, 1995; Ahsan et al., 2014; Ossoli et al., 2016). Finally, the intensity of these bands strongly correlated with development of proteinuria in animals maintained on the PRCL for 9 days.
Overexpression of the SREBP1a transgene appeared to be essential for LpX formation and the other lipid-related changes observed in the LCAT-deficient mice. At least by agarose gel electrophoresis, virtually no LpX could be detected in 2- to 3-month-old LCAT-KO × SREBP1a mice on a chow diet (Zhu et al., 2004 and our data). In contrast, there was a rapid and dramatic accumulation of LpX in plasma of these mice when expression of the SREBP1a gene was induced by the PRCL diet. Upregulation of SREBP1a by the PRCL diet markedly increased cholesterol synthesis in hepatocytes, leading to dramatic increases in plasma VLDL and LDL, which, after the partial lipolysis of triglycerides, has been proposed to lead to the formation of LpX (Zhu et al., 2004). These findings suggest that LCAT deficiency, in combination with excessive liver lipid biosynthesis, potentiates LpX formation and its deposition in tissues. As observed by agarose gel electrophoresis, the apoB lipoproteins of mice fed the PRCL diet also became enriched in FC, which has been previously described in FLD patients (Gjone, 1974).
A key question is how LpX induced proteinuria in our mouse model. We showed previously that injection of LpX into LCAT-KO mice induces kidney dysfunction (Ossoli et al., 2016). Injected LpX was found to accumulate in the glomerulus where it caused several gene expression changes associated with nephrotoxicity. It also caused podocyte effacement, which is well known to be causally linked with proteinuria. In both our present and previous studies (Ossoli et al., 2016), we observed LpX deposition in GBM with concomitant damage to the GBM as well as robust intracellular LpX deposition in the mesangium. The relative importance of the deposition of LpX into various extracellular or intracellular compartments in the kidney for the initiation and progression of LpX-induced proteinuria remains to be determined. There are, however, several other lipoprotein abnormalities in FLD that could also potentially contribute to renal disease. In particular, the enrichment of FC on apoB-containing lipoproteins, which was also observed in this study, has also been proposed to be nephrotoxic (Kuroda et al., 2014), but this has not been experimentally tested. We did observe, however, that this lipid abnormality was also improved after rhLCAT treatment.
The normalization of the lipoprotein profile of LCAT-KO × SREBP1a mice by rhLCAT injections that we observed is similar to previously reported lipoprotein remodeling due to cholesterol esterification by LCAT in vitro (O and Frohlich, 1995; Ossoli et al., 2016; Freeman et al., 2017). In particular, formation of mature, spherical HDL particles after rhLCAT injection in our study can clearly be seen by agarose gel electrophoresis (Sudan stain) as well as by FPLC. The observed effects of rhLCAT on plasma lipoproteins in this study were also similar to previous mouse (Rousset et al., 2010) and human rhLCAT infusion studies (Shamburek et al., 2016a,b). In fact, the near restoration of normal HDL levels after rhLCAT infusion was seen in the one FLD patient treated to date with rhLCAT (Shamburek et al., 2016a).
A likely major underlying mechanism for increased plasma HDL-C after rhLCAT injection is the well-defined process of maturation from small, discoidal, FC-enriched particles to mature spherical CE-enriched particles (Ahsan et al., 2014). Large, mature, spherical HDL particles have a longer half-life than small, discoidal nascent HDL particles, which are disproportionally excreted by the kidney due to their smaller size (Ahsan et al., 2014). Conversion of small particles to larger particles thereby increases the half-life and thus concentration of HDL particles in plasma. ApoA-I, the main protein component of HDL that is also secondarily decreased in FLD, may contribute to lowering LpX by promoting its solubilization, a process that would also lead to increased HDL-C in plasma (Ossoli et al., 2016). Finally, rhLCAT has also been shown to promote cholesterol efflux in LCAT-KO × hApoa1-Tg mice (Collins et al., 2016), and the small increase in hepatic Abca1 and Apoa1 mRNA levels might promote this process.
Complete normalization of plasma lipids by rhLCAT involves not just increased HDL-C and decreased LpX but also decreased FC in apoB-containing lipoproteins, as seen in Fig. 7B. The mechanisms for this are not as well understood as for HDL. In experiments on human LCAT transgenic rabbits, it was shown that LCAT overexpression significantly increased the rate of clearance of non-HDL lipoproteins, including LDL, and it was suggested that LCAT is able to influence the function of LDL receptors (Brousseau et al., 1997). LCAT can esterify FC on apoB-Lps, possibly using apoE as an LCAT activator (Zhao et al., 2005), but this process is much less efficient than FC esterification in HDL and it is not clear that conversion of FC to CE on apoB-Lps would necessarily promote their clearance. Perhaps the most likely scenario might involve transfer of FC on apoB-Lps to HDL (FC is known to exchange freely between lipoproteins), esterification of this FC on HDL particles by rhLCAT (Huang et al., 1993), and clearance of these apoB-derived cholesteryl esters from plasma through the SR-BI pathway. Mice lack CETP, so transfer of the newly formed HDL-CE back to LDL and clearance through the LDLR is probably not a major clearance mechanism. Although this scenario is clearly hypothetical and increased direct clearance of apoB-Lps after rhLCAT treatment may very well also occur, equilibration of excess FC from apoB-Lps to HDL, where it is esterified by rhLCAT and cleared by the liver through SR-BI, may be a feasible mechanism for decreasing FC in apoB-Lps after rhLCAT treatment.
A question that will become critical once rhLCAT is tested in future clinical trials is whether it may reverse existing LpX-induced renal damage. Although we have not addressed this question directly by treating animals with established kidney disease, it is encouraging that returning the LCAT-KO × SREBP1a mice to a normal chow diet after 9 days on the PRCL diet eliminated LpX and completely normalized kidney function. These data suggest a cause-and-effect relationship between LpX and renal damage and raise the possibility that rhLCAT treatment may not only prevent the development of kidney dysfunction, but it may also reverse at least early kidney injury in FLD patients. Because podocytes are post-mitotic cells (Miyazaki et al., 2014), it may be necessary, however, to start the treatment early before the development of advanced renal disease, which may not be reversible. A single infusion of rhLCAT was found to normalize cholesteryl ester levels in a FLD patient for at least a week (Shamburek et al., 2016a), so the periodic intravenous infusion of rhLCAT in FLD patients could be a practical treatment approach as has been shown in several other enzyme replacement type therapies (Brady, 2006). The effectiveness of enzyme replacement therapies, particularly for lysosomal storage diseases, is limited by the requirement for the enzyme to enter the lysosome. In addition, there often are no convenient plasma biomarkers to monitor these therapies. As shown in our mouse model, both of these problems should not be a major issue for using rhLCAT as an enzyme replacement therapy agent for FLD.
It is known that circulating plasma LpX is present not only in FLD patients but can also be a marker of cholestatic liver disease (Narayanan, 1984; Ha et al., 2017; Heinl et al., 2017; Suzuki et al., 2017). It has been proposed that in cholestasis, bile, which is rich in bile salts, phospholipids, and FC, enters the plasma where it is remodeled to LpX after the rapid hepatic uptake of bile salts (Narayanan, 1979). This process could also have contributed to the formation of LpX in our model due to possible cholestasis driven by the accumulation of fat in the liver. Another potential mechanism for LpX formation in cholestasis is that LCAT activity levels are typically suppressed, most likely because the main source of LCAT is the liver and liver synthetic function can be impaired (Patsch et al., 1977). The ability of rhLCAT infusion to eliminate LpX in plasma and peripheral tissues suggests that rhLCAT could also lower LpX for cholestasis as well as FLD, but the pathophysiologic consequences of LpX formation from liver disease is uncertain except for a recent report that LpX in patients with drug-induced cholestasis can cause xanthoma formation (Suzuki et al., 2017).
In summary, LCAT-KO × SREBP1a mice on a PRCL diet can be used as an acute model for rapidly inducing renal injury by LpX. Consistent with prior studies (Rousset et al., 2010; Ossoli et al., 2016; Freeman et al., 2017), LpX appears to contribute to the renal damage seen in FLD but can be largely mitigated by treatment with rhLCAT. Thus, these results demonstrate the feasibility of potentially using rhLCAT treatment to prevent renal disease in patients with FLD.
Acknowledgments
We thank Erin Stempinski, Camron Keshavarz, Pat Connelly, and Dr. Christopher Bleck in the Electron Microscopy Core Facility, National Heart, Lung, and Blood Institute, National Institutes of Health, for help in the preparation of samples for EM imaging.
Abbreviations
- CE
cholesteryl ester
- FC
free cholesterol
- FLD
familial lecithin:cholesterol acyltransferase deficiency
- FPLC
fast protein liquid chromatography
- GBM
glomerular basement membrane
- HDL
high-density lipoprotein
- KO
knockout
- LCAT
lecithin:cholesterol acyltransferase
- LDL
low-density lipoprotein
- LDLR
low-density lipoprotein receptor
- PCR
polymerase chain reaction
- PRCL
protein-rich/carbohydrate-low
- rhLCAT
recombinant human lecithin:cholesterol acyltransferase
- VLDL
very-low-density lipoprotein
Authorship Contributions
Participated in research design: Vaisman, Karathanasis, Remaley.
Conducted experiments: Vaisman, Neufeld, Freeman, Gordon, Sampson, Pryor, Hillman.
Contributed new reagents or analytic tools: Axley.
Performed data analysis: Vaisman, Neufeld, Freeman, Gordon, Remaley.
Wrote or contributed to the writing of the manuscript: Vaisman, Neufeld, Freeman, Karathanasis, Remaley.
Footnotes
This research was supported by the Intramural Research Program of the National Institutes of Health funds from the National Heart, Lung, and Blood Institute and by a Medimmune, Cardiovascular and Renal Diseases, CRADA grant (grant no. HL002058 to A.T.R.).
References
- Ahsan L, Ossoli AF, Freeman LA, Vaisman B, Amar MJ, Shamburek RD, Remaley AT. (2014) Role of lecithin: cholesterol acyltransferase in HDL metabolism and atherosclerosis, in The HDL Handbook: Biological Functions and Clinical Implications (Komoda T. ed) pp 159–194, Academic Press, London. [Google Scholar]
- Brady RO. (2006) Enzyme replacement for lysosomal diseases. Annu Rev Med 57:283–296. [DOI] [PubMed] [Google Scholar]
- Brousseau ME, Santamarina-Fojo S, Vaisman BL, Applebaum-Bowden D, Bérard AM, Talley GD, Brewer HB, Jr, Hoeg JM. (1997) Overexpression of human lecithin:cholesterol acyltransferase in cholesterol-fed rabbits: LDL metabolism and HDL metabolism are affected in a gene dose-dependent manner. J Lipid Res 38:2537–2547. [PubMed] [Google Scholar]
- Collins HL, Vaisman BL, Adelman SJ, Remaley AT, Karathanasis S. (2016) Acute Lecithin: Cholesterol Acyltransferase Infusion Increases Whole Body Macrophage-specific Cholesterol Efflux in Lecithin:cholesterol Acyltransferase Deficient Human ApoA-I Transgenic Mice. American Heart Association Scientific Sessions #565, New Orleans, LA, November 12-16, 2016.
- Felker TE, Hamilton RL, Havel RJ. (1978) Secretion of lipoprotein-X by perfused livers of rats with cholestasis. Proc Natl Acad Sci USA 75:3459–3463. [DOI] [PMC free article] [PubMed] [Google Scholar]
- Folch J, Lees M, Sloane Stanley GH. (1957) A simple method for the isolation and purification of total lipides from animal tissues. J Biol Chem 226:497–509. [PubMed] [Google Scholar]
- Freeman LA, Sampson ML, Shamburek RD, Vaisman BL, LeLay J, Shalaurova I, Otvos JD, Karathanasis SK, Remaley AT. (2017) The effects of MEDI6012 on lipoproteins in familial LCAT deficiency patients and a new NMR method for quantifying lipoprotein-X. Circulation 136 (Suppl 1):A16097. [Google Scholar]
- Gjone E. (1974) Familial lecithin:cholesterol acyltransferase deficiency--a clinical survey. Scand J Clin Lab Invest Suppl 137:73–82. [PubMed] [Google Scholar]
- Glomset JA. (1968) The plasma lecithins:cholesterol acyltransferase reaction. J Lipid Res 9:155–167. [PubMed] [Google Scholar]
- Ha J, Lee SG, Kim JH. (2017) Lipoprotein X detected in a case of hypercholesterolemia associated with chronic cholangiohepatitis. Ann Lab Med 37:550–552. [DOI] [PMC free article] [PubMed] [Google Scholar]
- Heimerl S, Boettcher A, Kaul H, Liebisch G. (2016) Lipid profiling of lipoprotein X: implications for dyslipidemia in cholestasis. Biochim Biophys Acta 1861 (8 Pt A):681–687. [DOI] [PubMed] [Google Scholar]
- Heinl RE, Tennant HM, Ricketts JC, Rice CR, Robinson CB, Sandesara PB, Moriarty PM, Sperling L. (2017) Lipoprotein-X disease in the setting of severe cholestatic hepatobiliary autoimmune disease. J Clin Lipidol 11:282–286. [DOI] [PubMed] [Google Scholar]
- Huang Y, von Eckardstein A, Assmann G. (1993) Cell-derived unesterified cholesterol cycles between different HDLs and LDL for its effective esterification in plasma. Arterioscler Thromb 13:445–458. [DOI] [PubMed] [Google Scholar]
- Imbasciati E, Paties C, Scarpioni L, Mihatsch MJ. (1986) Renal lesions in familial lecithin-cholesterol acyltransferase deficiency. Ultrastructural heterogeneity of glomerular changes. Am J Nephrol 6:66–70. [DOI] [PubMed] [Google Scholar]
- Jouihan H. (2012) Measurement of Liver Triglyceride Content. Bio-protocol 2(13): e223. [Google Scholar]
- Karathanasis SK, Freeman LA, Gordon SM, Remaley AT. (2017) The changing face of HDL and the best way to measure it. Clin Chem 63:196–210. [DOI] [PubMed] [Google Scholar]
- Kostner GM, Laggner P, Prexl HJ, Holasek A. (1976) Investigation of the abnormal low-density lipoproteins occurring in patients with obstructive jaundice. Biochem J 157:401–407. [DOI] [PMC free article] [PubMed] [Google Scholar]
- Kuroda M, Holleboom AG, Stroes ESG, Asada S, Aoyagi Y, Kamata K, Yamashita S, Ishibashi S, Saito Y, Bujo H. (2014) Lipoprotein subfractions highly associated with renal damage in familial lecithin:cholesterol acyltransferase deficiency. Arterioscler Thromb Vasc Biol 34:1756–1762. [DOI] [PubMed] [Google Scholar]
- Laggner P, Glatter O, Müller K, Kratky O, Kostner G, Holasek A. (1977) The lipid bilayer structure of the abnormal human plasma lipoprotein X. An X-ray small-angle-scattering study. Eur J Biochem 77:165–171. [DOI] [PubMed] [Google Scholar]
- Lambert G, Sakai N, Vaisman BL, Neufeld EB, Marteyn B, Chan CC, Paigen B, Lupia E, Thomas A, Striker LJ, et al. (2001) Analysis of glomerulosclerosis and atherosclerosis in lecithin cholesterol acyltransferase-deficient mice. J Biol Chem 276:15090–15098. [DOI] [PubMed] [Google Scholar]
- Manthei KA, Ahn J, Glukhova A, Yuan W, Larkin C, Manett TD, Chang L, Shayman JA, Axley MJ, Schwendeman A, et al. (2017) A retractable lid in lecithin:cholesterol acyltransferase provides a structural mechanism for activation by apolipoprotein A-I. J Biol Chem 292:20313–20327. [DOI] [PMC free article] [PubMed] [Google Scholar]
- Miyazaki Y, Shimizu A, Ichikawa I, Hosoya T, Pastan I, Matsusaka T. (2014) Mice are unable to endogenously regenerate podocytes during the repair of immunotoxin-induced glomerular injury. Nephrol Dial Transplant 29:1005–1012. [DOI] [PubMed] [Google Scholar]
- Narayanan S. (1979) Lipoprotein-X. CRC Crit Rev Clin Lab Sci 11:31–51. [DOI] [PubMed] [Google Scholar]
- Narayanan S. (1984) Biochemistry and clinical relevance of lipoprotein X. Ann Clin Lab Sci 14:371–374. [PubMed] [Google Scholar]
- Norris AW, Chen L, Fisher SJ, Szanto I, Ristow M, Jozsi AC, Hirshman MF, Rosen ED, Goodyear LJ, Gonzalez FJ, et al. (2003) Muscle-specific PPARgamma-deficient mice develop increased adiposity and insulin resistance but respond to thiazolidinediones. J Clin Invest 112:608–618. [DOI] [PMC free article] [PubMed] [Google Scholar]
- O K, Frohlich J. (1995) Role of lecithin:cholesterol acyltransferase and apolipoprotein A-I in cholesterol esterification in lipoprotein-X in vitro. J Lipid Res 36:2344–2354. [PubMed] [Google Scholar]
- Ossoli A, Neufeld EB, Thacker SG, Vaisman B, Pryor M, Freeman LA, Brantner CA, Baranova I, Francone NO, Demosky SJ, Jr, et al. (2016) Lipoprotein X causes renal disease in LCAT deficiency. PLoS One 11:e0150083. [DOI] [PMC free article] [PubMed] [Google Scholar]
- Patsch JR, Soutar AK, Morrisett JD, Gotto AM, Jr, Smith LC. (1977) Lipoprotein-X: a substrate for lecithin: cholesterol acyltransferase. Eur J Clin Invest 7:213–217. [DOI] [PubMed] [Google Scholar]
- Peelman F, Verschelde JL, Vanloo B, Ampe C, Labeur C, Tavernier J, Vandekerckhove J, Rosseneu M. (1999) Effects of natural mutations in lecithin:cholesterol acyltransferase on the enzyme structure and activity. J Lipid Res 40:59–69. [PubMed] [Google Scholar]
- Repa JJ, Buhman KK, Farese RV, Jr, Dietschy JM, Turley SD. (2004) ACAT2 deficiency limits cholesterol absorption in the cholesterol-fed mouse: impact on hepatic cholesterol homeostasis. Hepatology 40:1088–1097. [DOI] [PubMed] [Google Scholar]
- Rousset X, Vaisman B, Auerbach B, Krause BR, Homan R, Stonik J, Csako G, Shamburek R, Remaley AT. (2010) Effect of recombinant human lecithin cholesterol acyltransferase infusion on lipoprotein metabolism in mice. J Pharmacol Exp Ther 335:140–148. [DOI] [PMC free article] [PubMed] [Google Scholar]
- Sakai N, Vaisman BL, Koch CA, Hoyt RF, Jr, Meyn SM, Talley GD, Paiz JA, Brewer HB, Jr, Santamarina-Fojo S. (1997) Targeted disruption of the mouse lecithin:cholesterol acyltransferase (LCAT) gene. Generation of a new animal model for human LCAT deficiency. J Biol Chem 272:7506–7510. [DOI] [PubMed] [Google Scholar]
- Seidel D, Alaupovic P, Furman RH. (1969) A lipoprotein characterizing obstructive jaundice. I. Method for quantitative separation and identification of lipoproteins in jaundiced subjects. J Clin Invest 48:1211–1223. [DOI] [PMC free article] [PubMed] [Google Scholar]
- Seidel D, Alaupovic P, Furman RH, McConathy WJ. (1970) A lipoprotein characterizing obstructive jaundice. II. Isolation and partial characterization of the protein moieties of low density lipoproteins. J Clin Invest 49:2396–2407. [DOI] [PMC free article] [PubMed] [Google Scholar]
- Shamburek RD, Bakker-Arkema R, Auerbach BJ, Krause BR, Homan R, Amar MJ, Freeman LA, Remaley AT. (2016a) Familial lecithin:cholesterol acyltransferase deficiency: first-in-human treatment with enzyme replacement. J Clin Lipidol 10:356–367. [DOI] [PMC free article] [PubMed] [Google Scholar]
- Shamburek RD, Bakker-Arkema R, Shamburek AM, Freeman LA, Amar MJ, Auerbach B, Krause BR, Homan R, Adelman SJ, Collins HL, et al. (2016b) Safety and tolerability of ACP-501, a recombinant human lecithin:cholesterol acyltransferase, in a phase 1 single-dose escalation study. Circ Res 118:73–82. [DOI] [PMC free article] [PubMed] [Google Scholar]
- Shimano H, Horton JD, Hammer RE, Shimomura I, Brown MS, Goldstein JL. (1996) Overproduction of cholesterol and fatty acids causes massive liver enlargement in transgenic mice expressing truncated SREBP-1a. J Clin Invest 98:1575–1584. [DOI] [PMC free article] [PubMed] [Google Scholar]
- Short MK, Clouthier DE, Schaefer IM, Hammer RE, Magnuson MA, Beale EG. (1992) Tissue-specific, developmental, hormonal, and dietary regulation of rat phosphoenolpyruvate carboxykinase-human growth hormone fusion genes in transgenic mice. Mol Cell Biol 12:1007–1020. [DOI] [PMC free article] [PubMed] [Google Scholar]
- Sörös P, Böttcher J, Maschek H, Selberg O, Müller MJ. (1998) Lipoprotein-X in patients with cirrhosis: its relationship to cholestasis and hypercholesterolemia. Hepatology 28:1199–1205. [DOI] [PubMed] [Google Scholar]
- Suzuki L, Hirayama S, Fukui M, Sasaki M, Hiroi S, Ayaori M, Terai S, Tozuka M, Watada H, Miida T. (2017) Lipoprotein-X in cholestatic patients causes xanthomas and promotes foam cell formation in human macrophages. J Clin Lipidol 11:110–118. [DOI] [PubMed] [Google Scholar]
- Thacker SG, Rousset X, Esmail S, Zarzour A, Jin X, Collins HL, Sampson M, Stonik J, Demosky S, Malide DA, et al. (2015) Increased plasma cholesterol esterification by LCAT reduces diet-induced atherosclerosis in SR-BI knockout mice. J Lipid Res 56:1282–1295. [DOI] [PMC free article] [PubMed] [Google Scholar]
- Torsvik H, Berg K, Magnani HN, McConathy WJ, Alaupovic P, Gjone E. (1972) Identification of the abnormal cholestatic lipoprotein (LP-X) in familial lecithin:Cholesterol acyltransferase deficiency. FEBS Lett 24:165–168. [DOI] [PubMed] [Google Scholar]
- Vaisman BL, Demosky SJ, Stonik JA, Ghias M, Knapper CL, Sampson ML, Dai C, Levine SJ, Remaley AT. (2012) Endothelial expression of human ABCA1 in mice increases plasma HDL cholesterol and reduces diet-induced atherosclerosis. J Lipid Res 53:158–167. [DOI] [PMC free article] [PubMed] [Google Scholar]
- Zhao Y, Thorngate FE, Weisgraber KH, Williams DL, Parks JS. (2005) Apolipoprotein E is the major physiological activator of lecithin-cholesterol acyltransferase (LCAT) on apolipoprotein B lipoproteins. Biochemistry 44:1013–1025. [DOI] [PubMed] [Google Scholar]
- Zhu X, Herzenberg AM, Eskandarian M, Maguire GF, Scholey JW, Connelly PW, Ng DS. (2004) A novel in vivo lecithin-cholesterol acyltransferase (LCAT)-deficient mouse expressing predominantly LpX is associated with spontaneous glomerulopathy. Am J Pathol 165:1269–1278. [DOI] [PMC free article] [PubMed] [Google Scholar]


