Abstract
Objective:
To comprehensively describe the temporal patterns of global outcome after traumatic brain injury (TBI) in the Traumatic Brain Injury Model Systems National Database (TBIMS NDB).
Design:
Longitudinal prospective cohort study.
Setting:
TBI Model Systems centers.
Participants:
Patients (N=3870) ≥16 years of age with moderate or severe TBI enrolled in the TBIMS NDB.
Interventions:
None.
Main Outcome Measure:
Glasgow Outcome Scale-Extended (GOS-E).
Results:
The trajectory of the GOS-E scores is best described with a model of quadratic change, in which scores initially increase and peak approximately 10 years after the first GOS-E assessment, and then decrease. Change occurs most rapidly in the initial and final years of the timeline. There was significant variability in each growth parameter (P<.05). A reduced multilevel model was built, including all covariates (age at first GOS-E assessment, FIM, race, sex, rehabilitation length of stay) that related significantly to the growth parameters. An interactive tool was created to generate individual level trajectories based on various combinations of covariate values. Results provide an individual level account of the chronological progression of TBI outcomes, as measured by the GOS-E.
Conclusions:
Individual growth curve analysis is a statistically rigorous approach to describe temporal change with respect to the GOS-E at the individual level for participants within the TBIMS NDB. Results indicated that, for individuals in the TBIMS NDB as a group, functional status as measured by the GOS-E initially improves, plateaus, and then begins to decline. Factors such as age at first GOS-E assessment, race, FIM score at rehabilitation admission, and rehabilitation length of stay were found to influence baseline GOS-E scores, as well as the rate and extent of both improvement and decline over time. Additional research may be required to determine the generalizability of these findings and the usefulness of this tool for clinical applications. Archives of Physical Medicine and Rehabilitation 2013;94:2486–93
Keywords: Brain injuries, Longitudinal studies, Outcome assessment (health care), Rehabilitation
Traumatic brain injury (TBI) is a large and growing public health problem that results in functional impairment and reduced productivity for over 5.3 million people in the United States.1 The consequences of TBI vary across individuals and can include changes in cognitive, behavioral, emotional, and physical abilities.2–5 Some of the most common questions and concerns raised by individuals with TBI and their families surround expectations for recovery: when and to what extent a person will be able to return to preinjury levels of functioning. A large body of empirical research has endeavored to address these questions, including a number of studies conducted using the Traumatic Brain Injury Model Systems National Database (TBIMS NDB).6–8 Most TBI outcome research involves cross-sectional investigation of associations between injury characteristics and outcome at a particular time point (eg, 1y postinjury), rather than evaluating change over time. The few studies that contain several assessment points often use regression analyses, which make assumptions that are typically violated in longitudinal studies.9 Moreover, regression analyses (including repeated-measures analysis of variance) are incapable of providing a detailed understanding of the sample at the individual level.
Individual growth curve (IGC) analysis has important advantages over traditional approaches,9 including the ability to capture individual level change, making it well suited to address research questions of greatest interest to TBI survivors and their families. IGC analysis models estimate trajectories based on participant characteristics10 and are robust in the presence of missing data and unequal spacing between assessments. This method also accounts for dependency between observations within an individual and accommodates unequal variances, thereby providing more precise results than common regression approaches.11 An IGC analysis primer with examples of application in a rehabilitation setting is given by Kozlowski et al.9
The TBIMS NDB provides an excellent opportunity to use advanced statistical techniques to more precisely investigate TBI outcomes. The present article is an extension of a parent study by Pretz et al,12 in which outcome measures within the TBIMS NDB were investigated in order to determine the mathematical function that best described the longitudinal trajectory for each measure. Instead of simply describing how an outcome changes over time at the group level, as done in the parent study, the current study uses covariates to explain variability in change trajectories. In particular, we introduce random effects, which model variability in the growth parameters and allows for investigation at the individual level by capitalizing on relations between the growth parameters and a set of covariates. The goals of this study are to (1) identify relations between a priori selected covariates and the growth parameters responsible for describing change over time with respect to the Glasgow Outcome Scale-Extended (GOS-E); (2) capitalize on the relations between the covariates and growth parameters; therefore, individual level trajectories can be estimated; and (3) develop an interactive tool that visually depicts the temporal patterns as measured by the GOS-E (ie, the individual level trajectories).
Methods
Data source and participants
The TBIMS NDB is a multicenter, longitudinal study of TBI outcomes funded by the U.S. Department of Education National Institute on Disability and Rehabilitation Research. Detailed information about the database, such as enrollment, variables, participating centers, and data collection techniques, can be found at the TBIMS website (www.tbindsc.org). Participants have sustained either penetrating or nonpenetrating TBI with at least 1 of the following characteristics: Glasgow Coma Scale score <13 on emergency admission (not because of intubation, sedation, or intoxication), loss of consciousness >30 minutes (not because of sedation or intoxication), posttraumatic amnesia >24 hours, or trauma-related intracranial abnormality on neuroimaging.
All TBIMS NDB enrollees are age ≥16 at the time of injury, receive medical care in a TBIMS-affiliated trauma center within 72 hours of injury, are transferred to an affiliated inpatient TBI rehabilitation program, and provide informed consent or consent by legal proxy to participate. A standard assessment protocol is conducted during acute care and inpatient rehabilitation and during a series of follow-up assessments (1, 2, and 5y postinjury and every 5y thereafter). However, because the analytic approach requires that at least 3 measures be recorded on an individual and because participants were removed because of missing covariate values, 3870 out of a possible 4187 individuals with recorded GOS-E scores were included in the analysis. Of these participants, 72% were men and 72% were white. The average age SD at the first GOS-E measure was 38.7±16.5 years, the average motor and cognitive FIM scores ± SD were 37±19.5 and 16±7.9, respectively, and the average rehabilitation length of stay (RLOS) SD was 28±25.8 days. The descriptive statistics reported differed only negligibly from the sample containing the full number of eligible participants (ie, n=4187).
Variables
Outcome measure
The GOS-E is a measure of overall disability and the most widely used TBI outcome measure.13 The original Glasgow Outcome Scale was developed in 1975,14 but this 5-point scale suffered from ceiling effects and insensitivity to the measurement of more nuanced deficits in mood, behavior, and cognition.15 A revised scale, the GOS-E, was created to overcome these limitations.16 The GOS-E uses an 8-point scale to further stratify the lower and upper levels of functioning measured by the Glasgow Outcome Scale,16 resulting in the following levels: dead, vegetative state, lower severe disability, upper severe disability, lower moderate disability, upper moderate disability, lower good recovery, and upper good recovery. Given the current project’s longitudinal focus, individuals categorized as dead were removed from the modeling process. The full range of temporal measures (ie, 1e20y postinjury) was considered.
The TBIMS NDB first began collecting the GOS-E in July 2000. Accordingly, the first GOS-E assessment was collected at 1 year postinjury for individuals who were enrolled in the TBIMS NDB after 2000. However, for individuals who were enrolled prior to 2000, the first GOS-E assessment may have been collected as many as 10 years postinjury. To account for a possible cohort effect, namely that individuals whose GOS-E data were collected at later time periods would tend to be older, the analysis controls for age at first GOS-E assessment. Data collection for this study began in July 2000 and ended in September 2012.
Covariate selection
With the exception of age at the first GOS-E measure, covariates included in the analysis were selected a priori based on previous literature suggesting associations between covariates and outcome. Indicators of recovery include age,6,17,18 sex,18,19 education,6,20 and race.21 Additionally, RLOS22 and FIM performance during inpatient rehabilitation6,7 are also associated with recovery. Accordingly, FIM scores at admission, race, sex, RLOS, and years of education at admission were all considered as candidate covariates for inclusion. Each covariate was further scrutinized for missing data using a guideline of 10% missing data as grounds for exclusion. Given that the current project aims to comprehensively describe individual level trajectories of functioning after TBI, we felt that it would be unwarranted to include a covariate that resulted in the exclusion of >10% of the sample. Years of education at injury was the only covariate removed because it reduced the sample by 24%. As a result, the covariates included here are age at first GOS-E, FIM, race, sex, and RLOS.
The FIM is an 18-item measure of functional independence.23 The current study uses data collected at rehabilitation admission on both the 13-item FIM motor and 5-item FIM cognitive subscales. Each item in these subscales is scored using a rating scale that ranges from 1 (total assistance) to 7 (complete independence), yielding a score range of 13 to 91 for the motor FIM and 5 to 35 for the cognitive FIM. Race is collected based on self-report and is coded as white or other. Additionally, sex is coded as man or woman, whereas RLOS is the total number of days between inpatient rehabilitation admission and discharge.
All analyses were conducted using SAS version 9.3.a The parent study indicated that a cubic model best described the trajectory of the GOS-E for the same time range currently being investigated. The present study confirmed a cubic model best described the GOS-E; however, when introducing random effects, it was discovered that the cubic model was overspecified, that is, the growth parameter variance-covariance matrix was ill behaved. To address this issue, we employed the same model selection process described in the parent study.12 The outcome of this process indicated that, when including random effects, the quadratic model was most suitable for representing change in the GOS-E over time. The growth parameter estimates and their respective confidence intervals and P values are presented in table 1.
Table 1.
Growth parameter estimates for the quadratic model
| Growth Parameter | Estimate | SE | P | Lower 95% CI | Upper 95% CI |
|---|---|---|---|---|---|
| Intercept | 5.900 | 0.027 | <.0001 | 5.850 | 5.960 |
| Linear change | 0.080 | 0.0069 | <.0001 | 0.063 | 0.091 |
| Quadratic change | −0.0043 | 0.00055 | <.0001 | −0.0053 | −0.0032 |
Abbreviation: CL, confidence limit.
Results
The value of the intercept suggests the average 1 year postinjury GOS-E score is 5.96 (approximately the lower moderate disability category). The small confidence intervals reflect the accuracy of the estimates, whereas the negative value for the quadratic change indicates that the GOS-E initially increases, reaches a maximum, then decreases. The shape of the GOS-E trajectory is displayed in figure 1; this trajectory is often referred to as the group trajectory because it estimates the trend of all participants.
Fig 1.
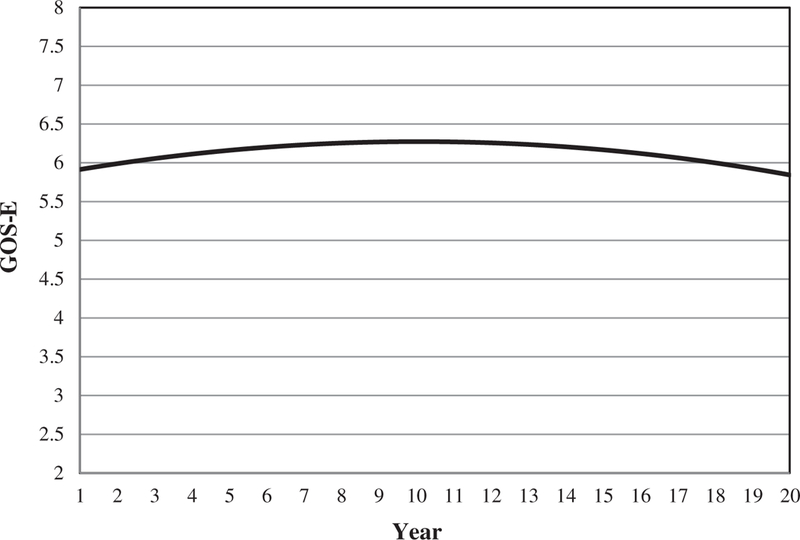
Group level GOS-E trajectory.
The instantaneous rate of change (IRC) plot for the trajectory in figure 1 is presented in figure 2. The IRC plot indicates that the trajectory peaks near year 10 and the change in the GOS-E occurs most rapidly in the initial and final years of the timeline. In addition to helping describe the trajectory, the IRC plots are informative when making comparisons between trajectories, as discussed subsequently (for more on the utility of IRC plots see Pretz et al12).
Fig 2.
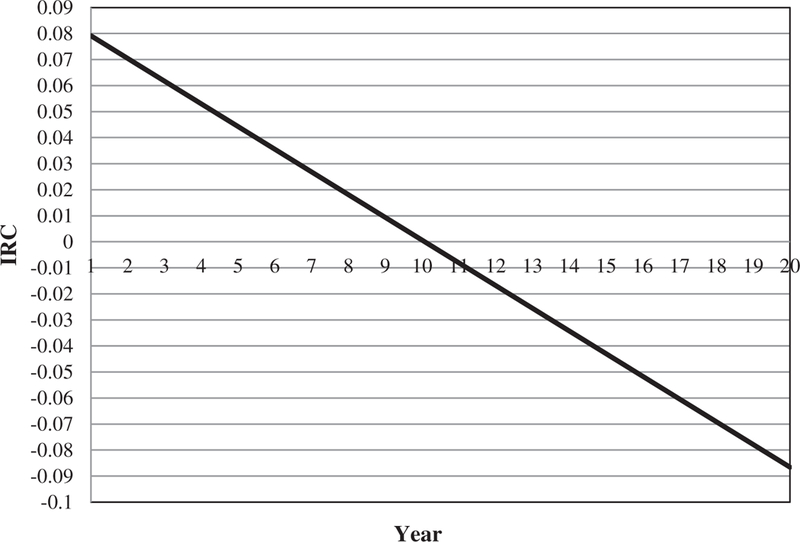
Corresponding IRC for figure 1.
A preliminary step in conducting an IGC analysis is to ascertain whether variability exists in the growth parameters because this indicates that covariates may explain some of this variability. As seen in table 2, the variability in each growth parameter is significantly different from zero, indicating that ample variability in the growth parameters is unexplained.
Table 2.
Variance estimates of the growth parameters
| Growth Parameter | Estimate | P |
|---|---|---|
| Intercept | 2.2722 | <.0001 |
| Linear change | 0.04194 | <.0001 |
| Quadratic change | 0.000101 | <.0001 |
Although figure 1 promotes understanding of change in the GOS-E at the group level, the main objective of this study is to describe change at the individual level, where the term individual level is defined as an individual or group of individuals that share common values on the given covariates. Because table 2 indicates ample variability in the growth parameters, we use the covariates previously discussed to explain this variability. The covariates are also used to acquire individual level trajectories, that is, individual level estimated projections of longitudinal change. An initial step in estimating individual level trajectories is to determine the covariates that relate significantly to the growth parameters. To this end, a multilevel model including all covariates was constructed, that is, the full model. Using type III sum of squares analysis, all nonsignificant growth parameter/covariate pairs (P>.05) were removed, resulting in a reduced model. For example, sex is not associated with any growth parameter; therefore, it was removed. The estimates relating the covariates to the growth parameters for the reduced model and additional information about estimates are displayed in Table 3.
Table 3.
Estimates for the relation between covariates and growth parameters in the reduced model
| Covariate (Growth Parameter) | Estimate | SE | P | Lower 95% CI | Upper 95% CI |
|---|---|---|---|---|---|
| Age at first measure (intercept) | −0.01317 | 0.001463 | <.0001 | −0.01604 | −0.01029 |
| Age at first measure (linear change) | −0.00296 | 0.000458 | <.0001 | −0.00385 | −0.00206 |
| Age at first measure (quadratic change) | 0.000121 | 0.000044 | .0056 | 0.000035 | 0.000207 |
| Cognitive FIM at admission (intercept) | 0.02742 | 0.003564 | <.0001 | 0.02043 | 0.03441 |
| Motor FIM at admission (intercept) | 0.01658 | 0.001648 | <.0001 | 0.01335 | 0.01981 |
| Motor FIM at admission (linear change) | −0.00148 | 0.000347 | <.0001 | −0.00217 | −0.00080 |
| Motor FIM at admission (quadratic change) | 0.000075 | 0.000026 | .0046 | 0.000023 | 0.000127 |
| Race (intercept) | −0.6417 | 0.04752 | <.0001 | −0.7349 | −0.5485 |
| RLOS (intercept) | −0.01289 | 0.001044 | <.0001 | −0.01494 | −0.01084 |
Abbreviation: CL, confidence limit.
Estimates given in table 3 are important because they establish the associations between the covariates and growth parameters, which in turn are responsible for generating the individual level trajectories. The small range for each confidence interval indicates accurate projections.
Along with identifying the association between covariates and growth parameters, we assessed the variability in the growth parameters explained by the covariates. The variability explained by the covariates is calculated by measuring the degree to which variability in the growth parameters decreases on inclusion of covariates.
The percent of variability explained by the covariates is provided in table 4. The amount of variability in the growth parameters explained by the covariates is 28% for the intercept, 15% for linear change, and 17% for quadratic change. Future studies may use additional covariates to explain additional variability in growth parameters.
Table 4.
Variance estimates of growth parameters after inclusion of covariates
| Growth Parameter | Estimate of the Variance Postcovariate Inclusion | P | % of Variability Explained by Covariates |
|---|---|---|---|
| Intercept | 1.6327 | <.0001 | 28 |
| Linear change | 0.03556 | <.0001 | 15 |
| Quadratic change | 0.000084 | <.0001 | 17 |
Interactive tool to generate GOS-E trajectories conditioned on a set of covariate values
The relation between growth parameters and covariates is complicated and cannot be fully appreciated based on verbal description alone. Therefore, to facilitate a greater understanding of these relations, an interactive Excel spreadsheet was created to generate individual level trajectories based on various combinations of covariate values. The ability to generate different trajectories provides clinicians and researchers with a detailed understanding of how change occurs on the GOS-E for numerous patients or patient subgroups. The interactive tool and information discussing its utility can be found in the supplement (available online only at http://www.archives-pmr.org/). A copy of the interactive tool can also be found on the TBIMS National Data and Statistical Center’s website (http://www.tbindsc.org/researchers.aspx). The following cases illustrate the capacity of the interactive tool to demonstrate differences in GOS-E trajectories based on select values of age at first GOS-E assessment, admission motor and cognitive FIM scores, race, and RLOS. Because of the vast number of possible combinations, the cases presented are far from an exhaustive account of all cases.
Case 1
The first case displays the trajectory (fig 3) for the following clinical profile: an individual or group of individuals who are 60 years of age at the time of their first GOS-E assessment, have rehabilitation admission cognitive and motor FIM scores of 10 and 20, respectively, are nonwhite, and have an RLOS of 80 days.
Fig 3.
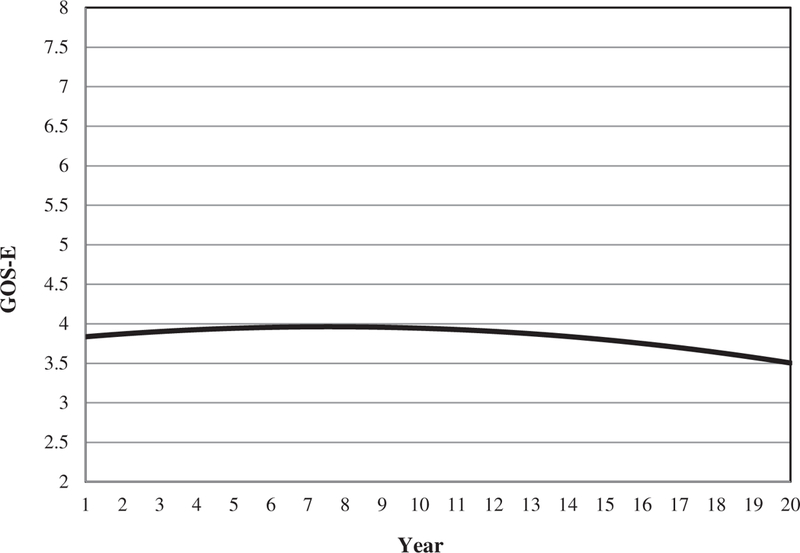
Individual level GOS-E trajectory for a clinical profile (age at first measure, 60y; FIM cognitive scores at admission=10; FIM motor scores at admission=20; race nonwhite; RLOS, 80d).
In comparison with the group (see fig 1), the individual level trajectory for the given clinical profile begins 2 points lower on the GOS-E (a score of 4=upper severe disability), and the 2-point difference noted initially is maintained and continues over the 20-year time span. Cases with this particular clinical profile experience a long-term trajectory of functioning that differs considerably from the group trajectory. In particular, they start out with poorer functional outcomes; although they do improve until the zenith is reached, their functional status remains considerably lower than the larger group. The corresponding IRC plot (fig 4) indicates that the GOS-E scores peak at 7.5 years, and a year-by-year comparison of the rates of change indicates that trajectory curvatures for this clinical profile and entire group are similar.
Fig 4.
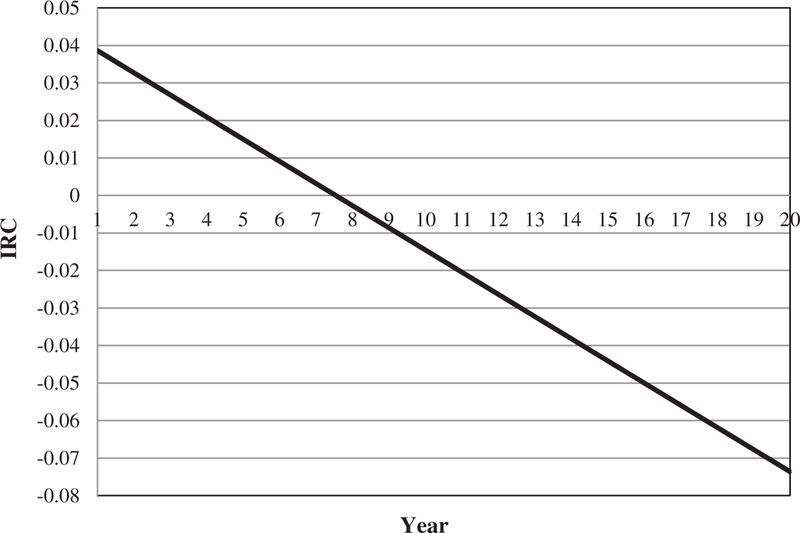
Corresponding IRC for figure 3.
Case 2
The second clinical profile represents an individual (or group of individuals) who is 45 years old at first GOS-E assessment, has cognitive and motor FIM scores at rehabilitation admission of 30 and 85, respectively, is white, and has an RLOS of 15 days.
The patients with the clinical profile reflected in figure 5 have a notably different trajectory than the patients in figures 1 and 3. Specifically, as measured by the GOS-E, both the immediate and long-term functional trajectories for this individual(s) appear favorable (score of 7=lower good recovery) in comparison. The IRC plot in figure 6 indicates that the rate of change in the GOS-E scores decreases subtly over time (indicating that more rapid decline in functional outcome is seen in the first years after injury than is seen many years postinjury) and that the trajectory is void of a peak or trough (which means that this person’s functional status neither plateaued nor bottomed out but rather declined steadily).
Fig 5.
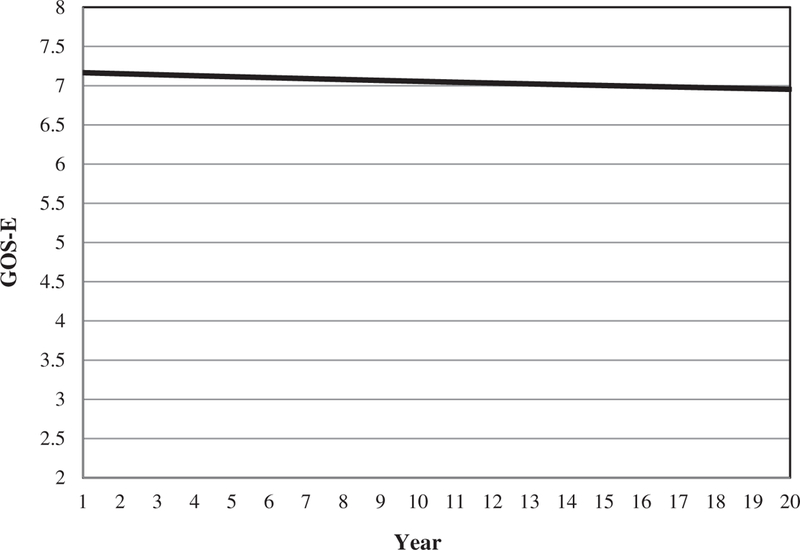
Individual level GOS-E trajectory for a clinical profile (age at first measure, 45y; FIM cognitive scores at admission=30; FIM motor scores at admission=85; race nonwhite; RLOS, 15d).
Fig 6.
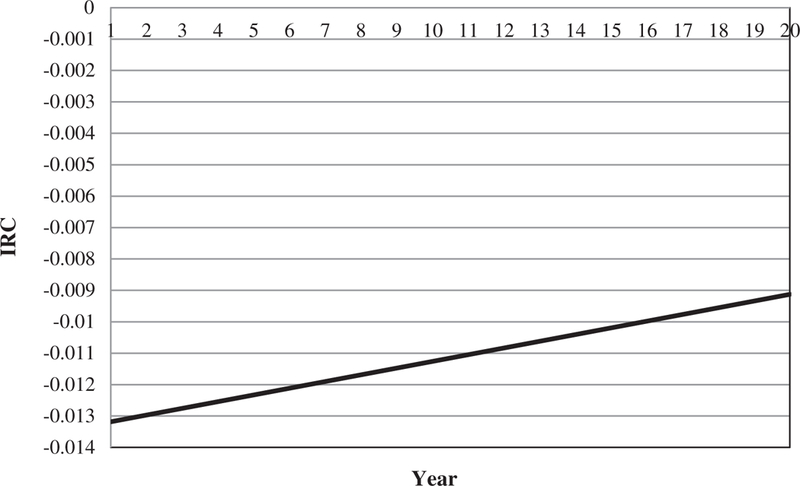
Corresponding IRC for figure 5.
Discussion
The current study identified the relations between preselected covariates and growth parameters, used the relations to generate individual level trajectories, and developed an interactive tool to provide a visual representation of individual level change. Although the interactive tool is useful for comprehending the complex relations between the growth parameters and covariates, the motivation behind its creation was to provide clinicians and researchers with a graphic depiction of how longitudinal change typically occurs with respect to the GOS-E for individuals in the TBIMS NDB with various clinical profiles. The practical applications of such a tool are extensive because any combination of covariates can be entered to see their influence on the trajectory estimated by the model. Understanding of longitudinal trajectories of functioning after TBI can allow clinicians to recognize patients (or subgroups of patients) who may be at risk for functional decline and deploy preventative interventions accordingly. TBI survivors and their family may use this information to assist in decisions about long-term care needs and financial plans. Researchers can use this descriptive tool to identify gaps in knowledge about TBI outcomes and prioritize areas for further research, such as exploring causal factors for functional gains and declines in subgroups of TBI survivors.
Although our goal of describing individual level trajectories based on the GOS-E over time for participants in the TBIMS NDB was achieved, the results of this study lay the groundwork for further studies aimed at attaining an even greater understanding of the factors related to change in the GOS-E over time. For instance, we identify change as it relates to baseline information; however, because of the flexibility of IGC analysis, a refined understanding of change may be possible through the inclusion of nonbaseline or time-varying covariates. Similarly, an acute understanding of change at particular points in time postrehabilitation may be achieved through timeline truncation, where IGC analysis is applied to data confined within a specific time interval instead of over the entire range of measures.
Study limitations
Several points should be considered when interpreting study results. It is important to reiterate that individual level trajectories generated by the interactive tool are direct products of the covariate/growth parameter associations. Hence, trajectories are projections based on established mathematical relations and do not necessarily represent predicted outcomes for a particular individual or group of individuals. Instead, each trajectory is a depiction of how we would expect individual level change to occur for those retaining specific values on the aforementioned covariates. Trajectories generated may not be authentic if nonsensical combinations of covariate values are chosen. For instance, a clinical profile with cognitive and motor FIM scores of 30 and 85, respectively, but with an RLOS of 200 days is an untenable scenario because it is unlikely that an individual who scores high on both cognitive and motor FIM scores would require 200 days of rehabilitation. Clinical expertise and judgment must be exercised; therefore, plausible trajectories are generated.
Trajectories produced by the interactive tool are based on current TBIMS NDB participants who meet previously established inclusion/exclusion criteria. Consequently, trajectories generated may not apply to individuals who are dissimilar to those included in TBIMS. Additionally, because of the longitudinal nature of the analysis, results may not fully represent more recent TBIMS NDB participants. The validity of results applied to non-TBIMS cases and new TBMIS NDB participants is unknown and should be interpreted cautiously. The current study is descriptive in that the focus is to describe, at a high level of detail, participants within the TBIMS NDB. Thus, using the results of this study or the interactive tool described herein to make statistical inferences about individual TBI survivors outside of the TBIMS NDB is not the intention of this study.
We recognize that although it is preferable for outcome measures used in IGC analysis to be continuous, we also recognize that many rehabilitation outcome measures are at best quasi-continuous. Although studies exist suggesting that quasi-continuous outcomes approximate their continuous counterparts well and consequently provide viable results,24 the results of this study should be interpreted bearing this potential limitation in mind.
Conclusions
In this study, an alternative yet statistically rigorous approach is used to describe temporal change with respect to the GOS-E at the individual level for participants within the TBIMS NDB. To enhance interpretation of results, an interactive tool was created that provides researchers and clinicians with a visual understanding of longitudinal change, as measured by the GOS-E, for those who share common values on a set of covariates. Readers are encouraged to download the interactive tool to fully appreciate the ways in which patient and injury characteristics interact to influence the longitudinal course of functioning in subsets of patients who are characterized in the NDB. Clinicians can use the interactive tool to visualize the functional trajectory over time that is shown by individuals in the NDB who share similar patient and injury characteristics as their own patients. Although the GOS-E is the most commonly used outcome measure in TBI research, most studies to date have demonstrated factors that predict group mean scores at a particular point in time (eg, 1y postinjury). As demonstrated in the current study, extensive additional knowledge is gained by modeling trajectories of change over time for subgroups of individuals characterized by a wide array of individual and injury baseline characteristics.
Acknowledgments
Supported by the Traumatic Brain Injury Model Systems National Data and Statistical Center, National Institute on Disability and Rehabilitation Research (grant no. H133A110006); and the National Institute on Disability and Rehabilitation Research-funded Traumatic Brain Injury Model System Center at the Mount Sinai Medical Center (grant no. H133A120084).
The contents of this article were developed under a grant from the National Institute on Disability and Rehabilitation Research, Department of Education. However, these contents do not necessarily represent the policy of the Department of Education, and do not assume endorsement by the Federal Government.
List of abbreviations:
- GOS-E
Glasgow Outcome Scale-Extended
- IGC
individual growth curve
- IRC
instantaneous rate of change
- RLOS
rehabilitation length of stay
- TBI
traumatic brain injury
- TBIMS
Traumatic Brain Injury Model Systems
- TBIMS NDB
Traumatic Brain Injury Model Systems National Database
Footnotes
No commercial party having a direct financial interest in the results of the research supporting this article has conferred or will confer a benefit on the authors or on any organization with which the authors are associated.
Supplier
SAS Inc, 100 SAS Campus Dr, Cary, NC 27513–2414.
References
- 1.Faul M, Xu L, Wald MW, Coronado VG. Traumatic brain injury in the United States: emergency department visits, hospitalizations, and deaths 2002–2006 Atlanta: Centers for Disease Control and Prevention, National Center for Injury Prevention and Control; 2010. [Google Scholar]
- 2.Dijkers MP, Brown M, Ashman T. “Services” may not be the answer to many needs after disability 2004. p E12–E13.15249261 [Google Scholar]
- 3.Silver JM, McAllister JW, Yudofsky SC. Textbook of traumatic brain injury 1st ed. Washington (DC: ): American Psychiatric Publishing; 2005. [Google Scholar]
- 4.Ashman TA, Gordon WA, Cantor JB, Hibbard MR. Neurobehavioral consequences of traumatic brain injury. Mt Sinai J Med 2006;73:999–1005. [PubMed] [Google Scholar]
- 5.Hibbard MR, Uysal S, Sliwinski M, Gordon WA. Undiagnosed health issues in individuals with traumatic brain injury living in the community. J Head Trauma Rehabil 1998;13:47–57. [DOI] [PubMed] [Google Scholar]
- 6.Bush BA, Novack TA, Malec JF, Stringer AY, Millis SR, Madan A. Validation of a model for evaluating outcome after traumatic brain injury. Arch Phys Med Rehabil 2003;84:1803–7. [DOI] [PubMed] [Google Scholar]
- 7.Hammond FM, Grattan KD, Sasser H, et al. Five years after traumatic brain injury: a study of individual outcomes and predictors of change in function. NeuroRehabilitation 2004;19:25–35. [PubMed] [Google Scholar]
- 8.Walker WC, Ketchm JM, Marwitz JH, et al. Multicentre study on the clinical utility of post-traumatic amnesia duration in predicting global outcome after moderate-severe traumatic brain injury. J Neurol Neurosurg Psychiatry 2010;81:87–9. [DOI] [PubMed] [Google Scholar]
- 9.Kozlowski AJ, Pretz CR, Dams-O’Connor K, Kreider S, Whiteneck G. An introduction to applying individual growth curve models to evaluate change in rehabilitation: a National Institute on Disability and Rehabilitation Research Traumatic Brain Injury Model Systems Report. Arch Phys Med Rehabil 2013;94:589–96. [DOI] [PubMed] [Google Scholar]
- 10.Kwok OM, Underhill AT, Berry JW, Luo W, Elliott TR, Yoon M. Analyzing longitudinal data with multilevel models: an example with individuals living with lower extremity intra-articular fractures. Rehabil Psychol 2008;53:370–86. [DOI] [PMC free article] [PubMed] [Google Scholar]
- 11.Hox J Multilevel analysis: techniques and applications Mahwah: Lawrence Erlbaum Associates; 2002. [Google Scholar]
- 12.Pretz CR, Kozlowski AJ, Dams-O’Connor K, et al. Descriptive modeling of longitudinal outcome measures in traumatic brain injury: a National Institute on Disability and Rehabilitation Research Traumatic Brain Injury Model Systems Study. Arch Phys Med Rehabil 2013;94:579–88. [DOI] [PubMed] [Google Scholar]
- 13.Teasdale GM, Pettigrew LE, Wilson JT, Murray G, Jennett B. Analyzing outcome of treatment of severe head injury: a review and update on advancing the use of the Glasgow Outcome Scale. J Neurotrauma 1998;15:587–97. [DOI] [PubMed] [Google Scholar]
- 14.Jennett B, Bond M. Assessment of outcome after severe brain damage. Lancet 1975;1:480–4. [DOI] [PubMed] [Google Scholar]
- 15.Shukla D, Devi BI, Agrawal A. Outcome measures for traumatic brain injury. Clin Neurol Neurosurg 2011;113:435–41. [DOI] [PubMed] [Google Scholar]
- 16.Wilson JT, Pettigrew LE, Teasdale GM. Structured interviews for the Glasgow Outcome Scale and the extended Glasgow Outcome Scale: guidelines for their use. J Neurotrauma 1998;15: 573–85. [DOI] [PubMed] [Google Scholar]
- 17.Brown AW, Malec JF, McClelland RL, Diehl NN, Englander J, Cifu DX. Clinical elements that predict outcome after traumatic brain injury: a prospective multicenter recursive partitioning (decision-tree) analysis. J Neurotrauma 2005;22:1040–51. [DOI] [PubMed] [Google Scholar]
- 18.Graham JE, Radice-Neumann DM, Reistetter TA, Hammond FM, Dijkers M, Granger CV. Influence of sex and age on inpatient rehabilitation outcomes among older adults with traumatic brain injury. Arch Phys Med Rehabil 2010;91:43–50. [DOI] [PMC free article] [PubMed] [Google Scholar]
- 19.Ratcliff JJ, Greenspan AI, Goldstein FC, et al. Gender and traumatic brain injury: do the sexes fare differently? Brain Inj 2007;21: 1023–30. [DOI] [PubMed] [Google Scholar]
- 20.Connelly J, Chell S, Tennant A, Rigby AS, Airey CM. Modelling 5-year functional outcome in a major traumatic injury survivor cohort. Disabil Rehabil 2006;28:629–36. [DOI] [PubMed] [Google Scholar]
- 21.Hammond FM, Grattan K, Sasser H, et al. Five years after TBI: a study of individual outcomes and predictors of change in function. Neurorehabilitation 2004;19:25–35. [PubMed] [Google Scholar]
- 22.Arango-Lasprilla J, Ketchum J, Cifu D, et al. Predictors of extended rehabilitation length of stay after traumatic brain injury. Arch Phys Med Rehabil 2010;91:1495–504. [DOI] [PubMed] [Google Scholar]
- 23.Granger CV, Deutsch A, Russell C, Black T, Ottenbacher KJ. Modifications of the FIM 449 instrument under the inpatient rehabilitation facility prospective payment system. Am J Phys Med Rehabil 2007; 86:883–92. [DOI] [PubMed] [Google Scholar]
- 24.Norman G Likert scales, levels of measurement and the “laws” of statistics. Adv Health Sci Educ Theory Pract 2010;15:625–32. [DOI] [PubMed] [Google Scholar]


