Abstract
Debate about an increasing trend in highly educated women dropping out of the labor force to care for children—an opt-out revolution—has been considerable. I use unique features of the of Survey of Income and Program Participation—a large nationally representative sample, longitudinal structure, monthly labor-force outcomes, and repeated panels—to study trends in women’s birth-related career interruptions over time and across the education spectrum. Methodologically, I use event studies to compare women’s monthly labor-force outcomes on the extensive and intensive margins from twenty-four months before to twenty-four months after births in the 1980s, 1990s, and 2000s. Rather than an abrupt change in opting out, I find that the pattern of birth-related interruptions has changed surprisingly little over the past thirty years—substantial and sustained interruptions remain common for mothers in all education categories. Rather than a revolution, I find an opt-out continuation.
Keywords: opting out, maternal labor supply, labor-force participation, gender gap
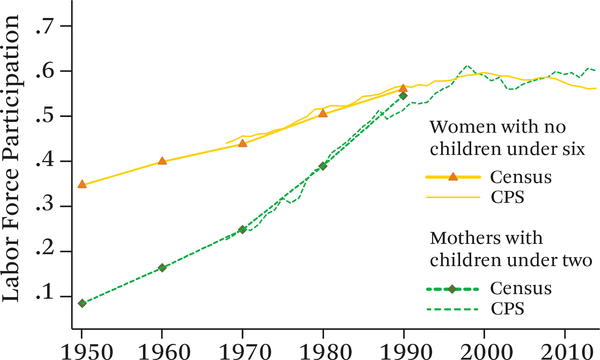
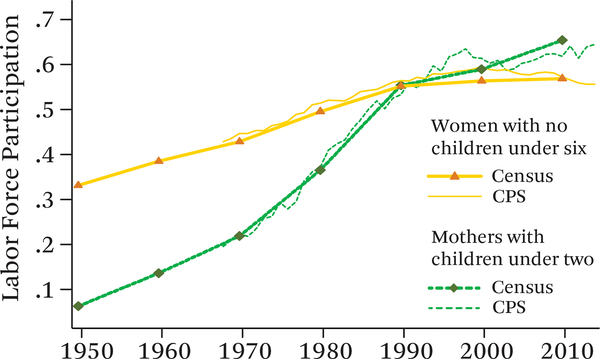
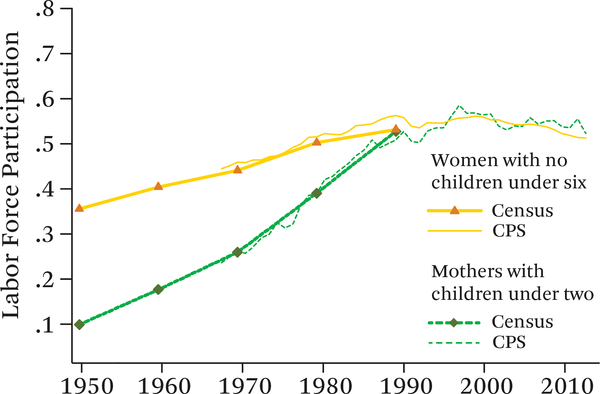
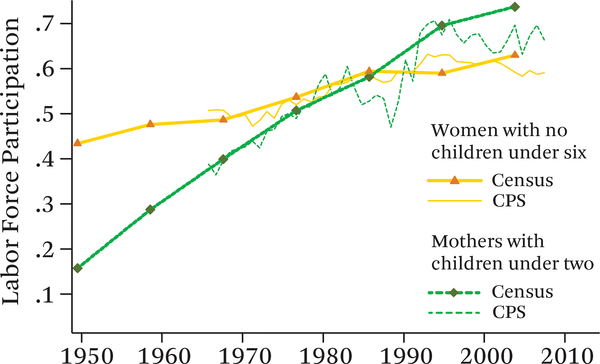
It is well known that women’s labor-force participation increased substantially over the last sixty years—nearly doubling from around 30 percent in 1950 to just under 60 percent in 1990 before leveling off. It is less well known, however, that the labor-force participation of mothers of young children rose even more sharply—increasing sixfold, from less than 10 percent in 1950 to over 60 percent by 2000 among women with children under the age of two (see figures 1 through 3). By returning to the labor force more quickly after births, women accumulated more years of work experience than previous generations and this increased experience was a key driver in the narrowing of the gender gap in earnings (Blau and Kahn 1997, 2004).
Figure 1. Labor-Force Participation of Women, All Education Groups.
Source: Author’s compilation based on U.S. Censuses 1950–1990 (Ruggles et al. 2010), Current Population Survey 1968–2014 (King et al. 2010).
Notes: Sample includes women over fifteen years old. “Women with no children under six” includes women with older children as well as women with no children.
Figure 3. Labor-Force Participation of Women, at Least Bachelor’s.
Source: Author’s compilation based on U.S. Censuses 1950–1990 (Ruggles et al. 2010), Current Population Survey 1968–2014 (King et al. 2010).
Notes: See notes to figure 1.
Yet at the beginning of the twenty-first century, a gender gap in both labor-force participation and earnings persists despite the elimination and reversal of the gender gap in career-focused educational investments (Goldin 2006; Goldin, Katz, and Kuziemko 2006). Lisa Belkin’s 2003 claim in the New York Times of a revolutionary exodus of professional women from the workplace to care for their children offered a potential explanation for this persistence. Her claim of an “opt-out revolution,” however, was based on selected interviews with highly educated women and sparked debate both in the popular media and academic literature.
In their early work on the intermittency of women’s work, Jacob Mincer and Solomon Polachek estimated that in the mid-1960 s women spent on average eight years out of the labor force during their childbearing years, and that many in fact never returned to work after having a child (1974). The trends shown in figures 1 through 3 make it clear this type of permanent exit is no longer the typical trajectory. However, women need not exit the labor force permanently when they become mothers for Belkin’s claims to lead to a persistent gender gap. Even brief absences from the labor force result in significant and persistent wage penalties (Hotchkiss and Pitts 2003). The opting out described by Belkin’s subjects amounted to career interruptions—extended periods out of the labor force. Currently, the literature has no measure of career interruptions around childbirth across the education spectrum or by race, and no measure of how trends in interruptions have changed over time.
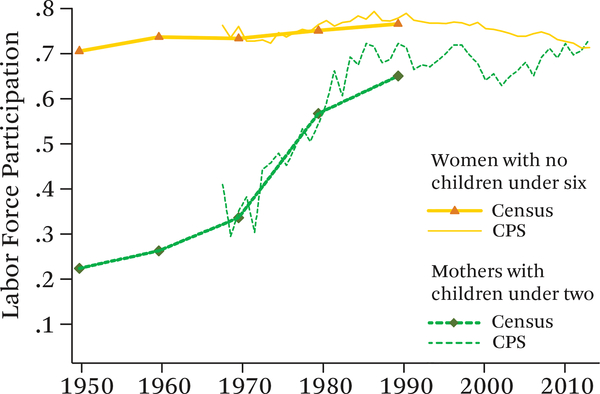
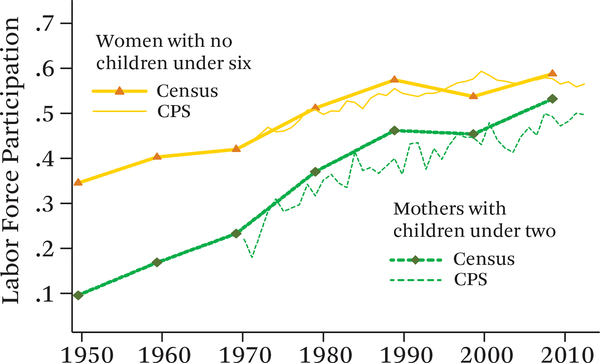
Quantifying career interruptions requires the ability to follow women over time to establish a baseline prior to birth from which a disruption occurs. The Survey of Income and Program Participation (SIPP) provides monthly outcomes for large nationally representative panels of women who gave birth in the 1980s, 1990s, and 2000s. Using an event study methodology in the SIPP, I study the pattern of women’s work in terms of labor-force participation and hours from the two years prior to two years following a birth. Because the SIPP’s sample size is large, I am able to show how career interruptions vary across the education spectrum and between first and subsequent births. Furthermore, figures 4 through 6 show that the levels and historical trends in labor-force participation among African American and Hispanic mothers differ substantially from each other and from white mothers—the SIPP’s large sample also allows me to investigate these differences.
Figure 4. Labor-Force Participation, with and Without Infant Children, Whites.
Source: Author’s compilation based on U.S. Censuses 1950–1990 (Ruggles et al. 2010), Current Population Survey 1968–2014 (King et al. 2010).
Notes: Sample includes women over fifteen years old. White women includes individuals who identify as white, but not Hispanic. Similarly, black women includes women who identify as black, but not Hispanic.
Figure 6. Labor-Force Participation, with and Without Infant Children, Hispanics.
Source: Author’s compilation based on U.S. Censuses 1950–1990 (Ruggles et al. 2010), Current Population Survey 1968–2014 (King et al. 2010).
Notes: See notes to figure 4.
I find that women who gave birth in the 2000s show a 26 percent drop in labor-force participation from a year before first births to two years after subsequent births. The patterns and timing of opting out vary substantially by education and race. Women with less than a bachelor’s degree start to exit the labor force as early as a year before birth, earlier than more-educated women whose participation rates do not fall until around three months before they have first births. Less-educated women also exhibit a steeper labor-force exit-and-return pattern in the months directly around birth that is not seen among more-educated mothers, indicating that many less-educated women exit the labor force briefly around giving birth. The overall levels of participation increase monotonically in education, but rates of opting out are highest among women with only a bachelor’s degree—a 30 percent drop in labor-force participation from 92 percent participation a year before first births to 64 percent two years after subsequent births. The comparable drop for women with less than a bachelor’s degree is 26 percent—from 82 percent to 61 percent. For women with at least a master’s, the drop is 19 percent from 95 percent participation before first births to 77 percent after subsequent births.
Because SIPP panels were fielded repeatedly over time, I am able to study how opting out has changed, or failed to change, over time. I find that despite notable differences from the 1980s to the 2000s, the patterns of career interruption in the two years after birth have changed surprisingly little over the past thirty years. When I compare these patterns of opting out across decades, I find that the abrupt exit-and-return pattern in the six months right around birth was more pronounced before the 2000s across the education spectrum, particularly in the 1980s. So although this short-term exit pattern has disappeared for women with at least a bachelor’s degree, it lingers for less-educated women. Tanya Byker (2016) hypothesizes that this is caused by increasing access to paid leave among more-educated women, which allows them to maintain attachment with their employer while taking leave to care for a newborn child.1 Looking beyond the six-month window around birth, however, the rates of opting out are not statistically distinguishable between the 2000s and the 1980s, except for most-educated mothers, who have at least a master’s degree and have become somewhat more attached to the labor force on average. Overall, I find substantial and sustained career interruptions for mothers in all education categories over the past three decades. Rather than a revolution, the data point to an opt-out continuation at all levels of education.
For those women who stay in the labor force after a birth, opting for fewer hours may allow them to balance work and motherhood. I find that, on average, women work fewer hours after giving birth in all three decades. However, the proportion of women, particularly the more educated, opting for part-time work (less than thirty-five hours a week) has fallen since the 1980s. Only around 22 percent of college-educated women and 33 percent of those with less than a bachelor’s degree are working part-time two years after a birth in the 2000s. This is surprising given recent opinion polls, which indicate that the majority of working mothers believe that it would be ideal for themselves and their children if they worked part time (Wang, Parker, and Taylor 2013). This, combined with the finding that 40 percent of non-working mothers also think working part time would be their ideal situation, suggests that a lack of good part-time options may be a driver of the opt-out continuation.
The patterns of opting out for black and Hispanic mothers show stark differences from the overall averages. Black women with less than a bachelor’s degree actually opt in on average—labor-force participation of less-educated black women increases from around 60 percent a year prior to first births to 72 percent two years after subsequent births, an 18 percent increase. Black women with at least a bachelor’s degree participate at rates similar to white women with bachelor’s degrees prior to first births—over 90 percent—but, in contrast to white women, they opt out substantially less—only an 11 percent drop in participation from before first births to after subsequent births. Hispanic mothers with less than a bachelor’s degree participate at much lower levels overall and opt out at rates close to the average for less-educated women—from 64 percent a year before first births to 46 percent two years after subsequent births, a 28 percent drop. College-educated Hispanic mothers participate around 90 percent before first births, but at only 63 percent two years after subsequent births, a 32 percent drop.
A DYNAMIC MEASURE ADDRESSES OPEN QUESTIONS ABOUT OPTING OUT
The literature on opting has proceeded along two lines—one using nationally representative cross-sectional data to test Belkin’s claims of an opt-out revolution and another using proprietary data sets to follow the career paths of graduates of elite institutions. For instance, Heather Antecol’s (2011) careful analysis using the census and Current Population Survey has the advantage of looking across decades and evaluating trends by education and occupation groups, but her measures of opting out are limited to static point-in-time averages of labor-force attachment for women with children under six compared with women without children. On the other hand, Marianne Bertrand, Claudia Goldin, and Lawrence Katz (2010)conduct a detailed analysis of the work histories of elite business school graduates, but examine only recent cohorts and cannot comment on opting out in the broader population (see also Wood, Corcoran, and Courant 1993; Herr and Wolfram 2012; Buchmann and McDaniel, this issue; Pal and Waldfogel, this issue).
Cross-sectional measures of opting out, called the child penalty or the child effect, proxy for mothers’ pre-birth levels of labor-force attachment with the work behavior of childless women. Antecol (2011), Heather Boushey (2005), and Christine Percheski (2008) use this type of measure to describe trends in opting out. These three papers define the populations of women they are studying differently and examine different margins of labor-force attachment, but all find that the penalty in labor-force participation fell substantially from the 1980s to the 1990s and remained essentially flat from the 1990s into the 2000s. Depending on the specification, they find that the penalty has been stable in a range of 19 to 22 percent since the 1990s.2
However, using childless women as the reference group is problematic. The group of all childless women combines those who may never have children and those who will eventually have them. This is unlikely to be a stable comparison group if marriage patterns or fertility change over time. The child-penalty comparison—all women with children under five or six versus all women without children—conflates important similarities and differences in trends over the last thirty years. For example, it could be that women in the 1980s stayed out of work longer or had more children (or both). But if they had similar opting-out behavior on a per-child basis in the child’s first and second years, then the existing measures of opting out would simply show a decrease over time. These measures would fail to distinguish differences in marriage or fertility behavior from differences in work behavior.
The detailed proprietary datasets that Jane Herr and Catherine Wolfram (2012), Bertrand and her colleagues (2010), and Robert Wood, Mary Corcoran, and Paul Courant (1993) use allow them to observe individuals at multiple points in their careers, often before and after they have children. Bertrand and her colleagues study University of Chicago MBAs, and Wood and his colleagues study University of Michigan JDs. Both studies find that most of the large gender gap in earnings between male and female graduates ten to fifteen years after graduation (despite nearly identical average earnings after graduation) can be explained by the deficit in women’s work experience due to time spent out of work to care for children. Herr and Wolfram examine the work trajectories of Harvard undergraduates, focusing on those who went on to graduate school, to estimate a causal impact of the family friendliness of jobs (as measured by the flexibility of work hours) on women’s rates of opting out. These studies provide detailed results for women with advanced degrees from elite institutions but do not comment on opting out for the rest of the education distribution or make comparisons over time.
If the goal is to understand why there are so few female CEOs or members of Congress, focusing on highly educated women is key to understanding what drives the gender gap in these realms. But if we think about education as a human capital investment in pursuing a career, then even in this context it is relevant to consider how the labor supply behavior of women who get advanced degrees differs from their counterparts. More broadly, I am concerned that the opting-out debate has been considered resolved or even debunked as something that relates only to elite women with high-earning husbands. Understanding how childbearing affects the work outcomes of women across the socioeconomic spectrum is important to understanding the gender gap in earnings that persists across skill levels.
EVENT STUDY METHODOLOGY TO MEASURE OPTING OUT IN LONGITUDINAL DATA, 1984–2012
The Survey of Income and Program Participation allows comparison of the monthly dynamic labor-force outcomes of a nationally representative sample of mothers across multiple decades. Sample sizes range from twenty thousand households for the 1984 panel to forty-five thousand households for the 1996 and 2004 panels. These large sample sizes contain high enough numbers of births for women born from the 1950s to the 1980s to document statistically significant trends over time by detailed education categories and by first births versus subsequent births within these categories.
I use the 2008, 2004, 1996, and pooled 1984 to 1986 SIPP panels.3 My sample consists of all women ages eighteen to forty-five who gave birth during one of the panels.4 Although the SIPP core waves do not provide direct information on when a woman gives birth, I construct this date by matching own children to mothers using family relationship variables and the month and date of birth of each member of the household. I determine that a birth occurs when a newborn child identified as the mother’s own appears in the household record. If no other own children are in the household when a woman gives birth, I code it as a first birth; otherwise, I code it as a subsequent birth.5 In some cases, a woman will give birth more than once during a SIPP panel. Given that the panels are up to four years long, especially for women who give birth early in the panel, this is not unusual. In the results that follow, I use the first recorded birth as the reference event for my analysis. That a woman has another child may naturally affect her outcomes, but the choice to have another child may be jointly determined with other labor-force outcomes.
I define three education categories: less than bachelor’s, bachelor’s, and master’s plus. When categorizing women by time-varying characteristics such as age or educational attainment, I use the month of birth as the reference period. Table 1 gives details of the time frame of each SIPP panel and summary statistics for my sample of women who give birth. More detailed information on the birth sample by education category is provided in table 2 and table 3, which provide information for the black and Hispanic portions of the sample.
Table 1.
Summary of SIPP Panels and Birth Sample
| 2004–2008 Panels | 1996 Panel | 1984–1986 Panels | ||||
|---|---|---|---|---|---|---|
| A: Summary information on 1984–1986, 1996, 2004–2008 SIPP panels | ||||||
| Waves | 12 | 12 | ||||
| Dates | February 2004–August 2012 | April 1996– March 2000 | October 1983– April 1988 | |||
| Householdsa | 43540 | 36730 | 45105 | |||
| Women (eighteen to forty-five) | 25317 | 24102 | 31316 | |||
| Births (eighteen to forty-five) | 6,284 | 3,395 | 3,670 | |||
| First | 2,621 | 42.8% | 1,486 | 43.9% | 1,987 | 53.9% |
| Subsequent | 3,663 | 57.2 | 1,909 | 56.1 | 1,683 | 46.1 |
| B: Summary characteristics of birth sample (mothers age eighteen to forty-five) (Unweighted numbers of observations, weighted percentages) | ||||||
| Race | ||||||
| White | 3,964 | 59.5% | 2,222 | 63.0% | 2,874 | 77.2% |
| Black | 760 | 13.1 | 449 | 14.5 | 480 | 14.8 |
| Hispanic | 1,043 | 19.4 | 564 | 17.8 | 178 | 4.4 |
| Other | 517 | 8.0 | 160 | 4.6 | 138 | 3.6 |
| Marital status | ||||||
| Married spouse present | 4,218 | 69.4 | 2,440 | 73.8 | 2,944 | 80.5 |
| Separated, divorced, widowed | 426 | 5.8 | 255 | 6.5 | 249 | 6.6 |
| Never married | 1,640 | 24.8 | 700 | 19.8 | 477 | 13.0 |
| Educationb | ||||||
| Less than bachelor’s | 4,377 | 68.9 | 2,577 | 75.3 | 3,054 | 83.1 |
| High school or less | 2,363 | 37.0 | 1,601 | 46.2 | 1,809 | 49.2 |
| Some collegec | 2,014 | 31.9 | 976 | 29.1 | 1,245 | 33.9 |
| Bachelor’s only | 1,305 | 21.2 | 663 | 20.2 | 386 | 10.5 |
| Master’s plus | 602 | 9.9 | 155 | 4.5 | 230 | 6.4 |
| Master’s | 450 | 7.4 | 114 | 3.3 | ||
| Professional | 89 | 1.4 | 25 | 0.7 | ||
| PhD | 63 | 1.0 | 16 | 0.5 | ||
| At least bachelor’s | 1907 | 31.1 | 818 | 24.7 | 616 | 16.9 |
Source: Author’s calculations based on the Survey of Income and Program Participation (1984, 1985, 1986, 1996, 2004, and 2008 panels).
Notes: The sample includes all women ages eighteen to forty-five who give birth during one of the SIPP panels. For time-varying characteristics like education, the reference level is the level in the month that a woman gives birth.
The number of households and number of women in the full panel based on the total number that appear in the survey as opposed to the number appearing in wave 1.
Ambiguity in 1980s coding of education variables makes it impossible to make an exact distinction between some college, bachelors, and graduate degree.
Includes associates and vocational degrees.
Table 2.
Characteristics by Education
| 2000s | 1990s | 1980s | |
|---|---|---|---|
| Less than bachelor’s | |||
| Married, spouse present | |||
| First births | 0.48 | 0.59 | 0.75 |
| Subsequent births | 0.65 | 0.72 | 0.80 |
| Education relative to spouse | |||
| Wife’s education ≥ husband’s | 0.71 | 0.69 | 0.65 |
| Age at first birth | 24.4 (5.3) | 24.5 (5.4) | 24.6 (4.7) |
| Parity of subsequent births | 2.7 (1.0) | 2.7 (1.0) | 2.7 (1.0) |
| Bachelor’s only | |||
| Married, spouse present | |||
| First births | 0.91 | 0.93 | 0.92 |
| Subsequent births | 0.95 | 0.96 | 0.97 |
| Education relative to spouse | |||
| Wife’s education ≥ husband’s | 0.81 | 0.82 | 0.75 |
| Age at first birth | 30.0 (4.4) | 29.4 (4.1) | 28.4 (3.7) |
| Parity of subsequent births | 2.5 (0.8) | 2.5 (0.7) | 2.4 (0.6) |
| Master’s plus | |||
| Married, spouse present | |||
| First births | 0.95 | 0.95 | 0.98 |
| Subsequent births | 0.98 | 0.95 | 0.98 |
| Education relative to spouse | |||
| Wife’s education ≥ husband’s | 0.57 | 0.57 | 0.51 |
| Age at first birth | 32.2 (4.1) | 32.4 (4.6) | 30.5 (3.8) |
| Parity of subsequent births | 2.4 (0.7) | 2.4 (0.7) | 2.4 (0.6) |
Source: Author’s calculations based on the Survey of Income and Program Participation (1984, 1985, 1986, 1996, 2004, and 2008 panels).
Notes: The birth sample includes women ages eighteen to forty-five who gave birth during one of the SIPP panels. Standard deviations in parentheses when relevant.
Table 3.
Characteristics by Race
| 2000s | 1990s | 1980s | |
|---|---|---|---|
| A: Black | |||
| Less than bachelor’s | |||
| Married, spouse present | |||
| First births | 0.21 | 0.24 | 0.39 |
| Subsequent births | 0.30 | 0.34 | 0.43 |
| Education relative to spouse | |||
| Wife’s education ≥ husband’s | 0.70 | 0.70 | 0.67 |
| Age at first birth | 23.5 (5.2) | 23.3 (5.7) | 23.7 (4.5) |
| Parity of subsequent births | 2.8 (1.1) | 2.7 (.9) | 2.9 (1.1) |
| Sample size | 651 | 399 | 442 |
| At least bachelor’s | |||
| Married, spouse present | |||
| First births | 0.69 | 0.76 | 0.61 |
| Subsequent births | 0.77 | 0.68 | 0.82 |
| Education relative to spouse | |||
| Wife’s education ≥ husband’s | 0.85 | 0.89 | 0.95 |
| Age at first birth | 30.6 (2.5) | 31.3 (2.4) | 28.1 (2.5) |
| Sample size | 109 | 50 | 38 |
| B: Hispanic | |||
| Less than bachelor’s | |||
| Married, spouse present | |||
| First births | 0.49 | 0.59 | 0.71 |
| Subsequent births | 0.73 | 0.73 | 0.75 |
| Education relative to spouse | |||
| Wife’s education ≥ husband’s | 0.78 | 0.76 | 0.82 |
| Age at first birth | 23.6 (4.9) | 23.0 (4.6) | 24.3 (4.8) |
| Sample size | 949 | 522 | 171 |
| At least bachelor’s | |||
| Married, spouse present | |||
| First births | 0.82 | 0.79 | 0.72 |
| Subsequent births | 0.91 | 0.92 | 1.00 |
| Education relative to spouse | |||
| Wife’s education ≥ husband’s | 0.89 | 0.93 | 1.00 |
| Age at first birth | 29.2 (2.5) | 28.8 (2.4) | 28.2 (2.5) |
| Sample size | 94 | 42 | 7 |
Source: Author’s calculations based on the Survey of Income and Program Participation (1984, 1985, 1986, 1996, 2004, and 2008 panels).
Notes: The birth sample includes women ages eighteen to forty-five who gave birth during one of the SIPP panels. Standard deviations in parentheses when relevant.
The primary outcome variables of interest are labor-force participation and weekly hours worked in a given month. A woman is considered to be in the labor force in a month if she is “with a job” at least one week of the month, including months when she is absent from work without pay; on layoff; or “not with a job” all month but on layoff or looking for work. She is only coded out of the labor force if she had “no job all month, no time on layoff, and no time looking for work.” Note that women who are “on leave” are coded as labor-force participants, for example under the Family and Medical Leave Act (FMLA).6 I test the robustness of my findings to using employment—defined as being with a job at least one week of the month—as the outcome of interest rather than labor-force participation, which includes layoff and job search, and find that the overall trends are quite similar. These results are available on request. To measure whether women opt for fewer hours, I use a categorical variable for whether a respondent worked more or less than thirty-five hours in a typical week conditional on working.7
Methodology—Event Study
To estimate how labor-force outcomes change around the event of birth, I pool information on all women who give birth during a given SIPP panel. Then, following Louis Jacobson, Robert LaLonde, and Daniel Sullivan’s 1993 study, I estimate the following regression model by least squares:
where Yit is the work outcome of interest for woman i in month t, αi are individual fixed effects and γt are year fixed effects. Defining bi as the month a woman gives birth, then
The are thus a set of dummy variables, one for each month from twenty-four months before to twenty-four months after a woman gives birth, omitting the dummy for twelve months before birth.8 For example, if in period t, woman i gave birth j months earlier (or if j is negative, j months later.) The dummies jointly represent a time line indexed to the date a woman gives birth and make it possible to estimate average outcomes for women who are j months before (or after) birth even if these women gave birth in different calendar months. Because I omit , the δj coefficients map out the time path of changes in outcomes relative to outcomes a year before the birth. The δj’s provide a detailed monthly measure of opting out for the two years after a woman gives birth.9 Including the twenty-four months before birth makes it possible to see whether women experience changes in outcomes in the months leading up to birth.
The SIPP panels are three to four years in duration. As a result, using all of the births that occur in each panel will mean that not all women in my sample have information for the full twenty-four lead and twenty-four lag months of the event study window because women give birth at different points over the course of the panel. The individual fixed-effects specification in equation (1), however, gives consistent estimates of opting out for an unbalanced panel as long as the reason why a woman has missing information is uncorrelated with the εit’s. Aside from attrition, whether I have data for a woman in any month j depends only on when during the panel she gave birth. In other words, all I require for consistency is that, conditional on giving birth during the panel, and any time invariant characteristics, when over the course of the panel that birth falls, is random. It seems very unlikely that women would time their births relative to the Census Bureau’s schedule for fielding SIPP panels. Although we may be worried that over time, age at first birth for different cohorts has shifted and that a one-or two-year difference in time of birth is relevant, by using fixed effects, we control for mothers’ birth cohort. Another concern is that women may time births relative to the business cycle. This may be a legitimate concern and for this reason I include year fixed effects in some specifications. Panel attrition remains a legitimate concern, therefore I reproduce the main results of the paper on a sample that excludes all women who left the panel or were absent from the panel for more than three straight months. The results are essentially the same. These results are available on request.10
I estimate equation (1) separately by education group, parity, and decade to make comparisons across these three dimensions. To claim that the pattern of opting out for a series of months is not statistically significantly different across decades, I test whether I can reject that the difference between coefficients for each decade for that series of months are jointly equal to zero. I operationalize this test by pooling the data from all panels and interacting dummies for each panel with each month-relative-to-birth dummy and testing if the series of relevant interaction terms are jointly equal to zero. The results of these tests are given in table A1. I also investigate how opting out differs by race by estimating models separately for black and Hispanic mothers by education and parity.
RESULTS: THE OPT-OUT CONTINUATION
The event study methodology lends itself well to a graphical presentation of results so that the time path of outcomes from the two years before to two years after birth is easily visualized. By plotting the δj coefficients estimated in equation (1) I can show dynamic changes in monthly outcomes relative to one year before birth. The changing contour of levels of outcomes—such as labor-force participation—over the time line is also interesting and relevant particularly when comparing trends across decades or between education categories. These level plots are easily constructed by adding the δj’s to the constant, which in the individual fixed-effects regression is an average of the estimated individual fixed effects.11 In a specification that does not use year fixed effects, the constant is an estimate of average labor-force participation for all women in the left-out time period—one year prior to giving birth.
Estimates of Opting Out in the 2000s
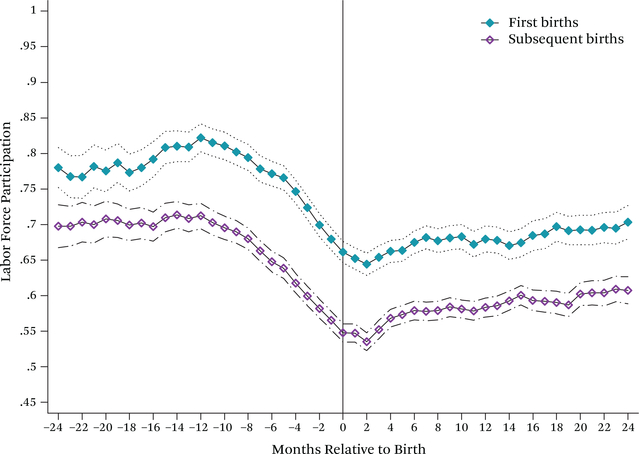
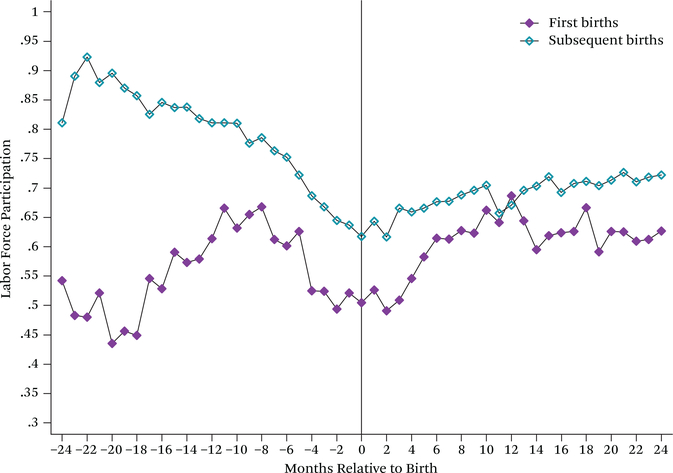
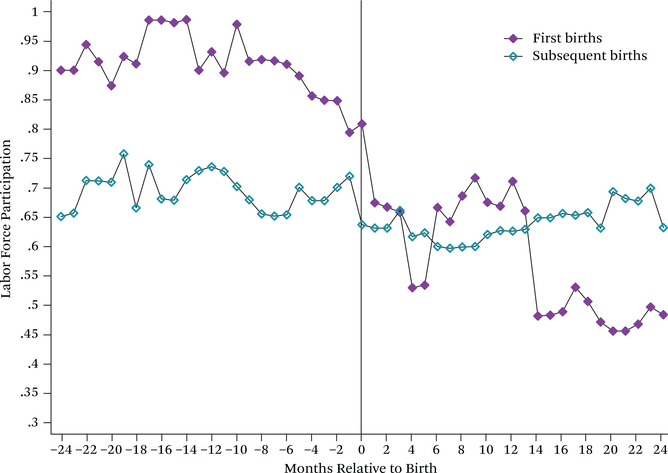
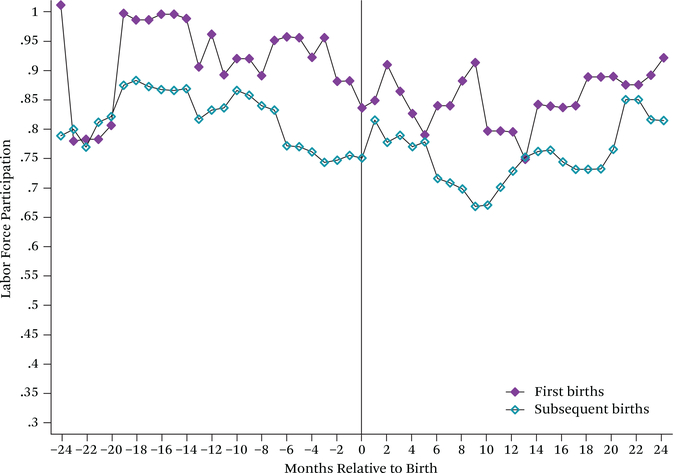
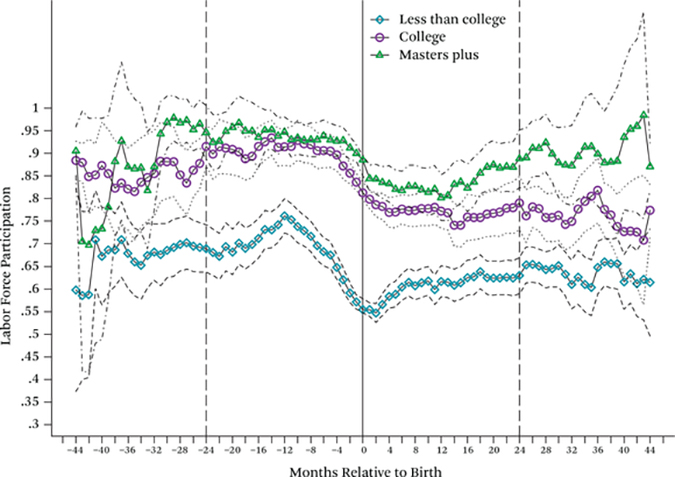
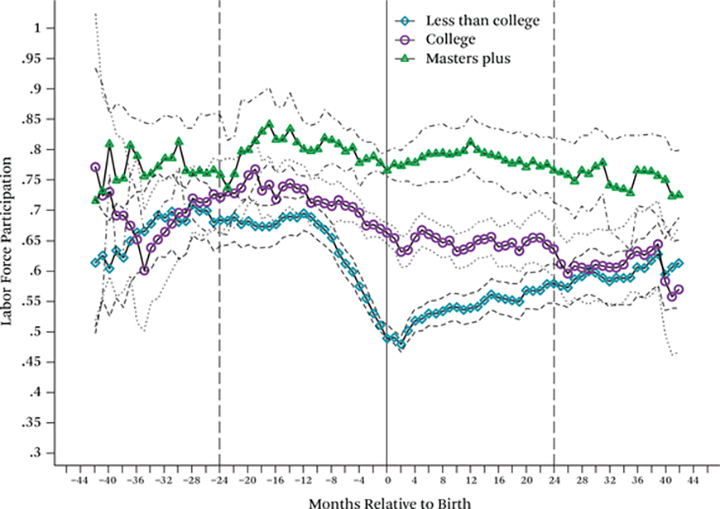
Figures 7 through 10 plot estimates of the level of labor-force participation in the four years around birth by parity and education for women ages eighteen to forty-five who gave birth from 2004 to 2012 using the 2004 and 2008 SIPP panels.12 Figure 7 presents labor-force participation for first and subsequent births of all women who gave birth during the panel. It shows substantial and sustained opting out of the labor force starting as early as one year before birth and lasting at least two years after both first and subsequent births; and that the estimates of these drops are highly statistically significant. For first births, labor-force participation fell from 82 percent one year before birth to around 68 percent in the year after birth—a drop of 14 percentage points—and hovered around 70 percent two years after birth. Labor-force participation two years prior to subsequent births was around 10 percentage points lower than participation in the two years prior to first births, but the relative rates of opting out were quite similar for the first and subsequent births, at least at this aggregate level of all women in the birth sample. Comparing rates a year before first births with those two years after subsequent births, figure 7 shows a 21 percentage point drop in labor-force participation. Figures A1 and A2 extend the event study window to its maximum width from around four years before to four years after births. Given that sample sizes more than two years away from birth become small, the estimates outside the window presented in the paper are less precise, but these figures provide suggestive evidence that participation rates remain below pre-birth levels for at least four years.
Figure 7. Labor-Force Participation, All Mothers.
Source: Author’s calculations based on the 2004 and 2008 Survey of Income and Program Participation panels.
Notes: Women age eighteen to forty-five who give birth during the panels. Plots show labor force participation from twenty-four months before to twenty-four months after birth (plotting the coefficients from equation (1) added to the constant with dependent variable an indicator for being in the labor force estimated separately by education and parity). Dashed lines are 95 percent point-wise confidence intervals.
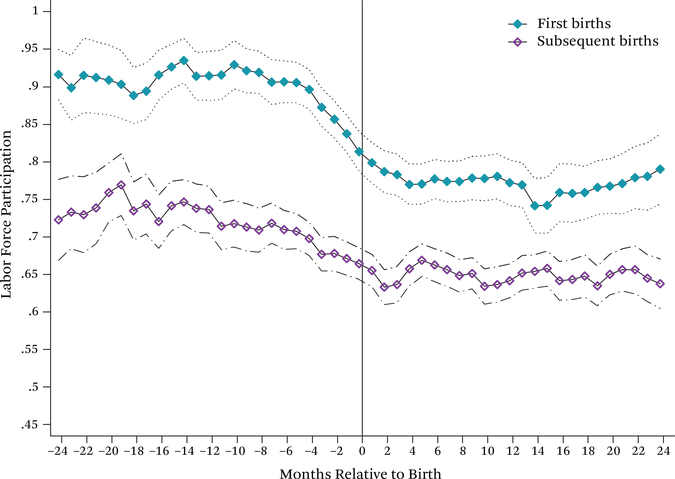
Figure 10. Labor-Force Participation, Master’s Degree Plus.
Source: Author’s calculations based on the 2004 and 2008 Survey of Income and Program Participation panels.
Notes: See notes to figure 7.
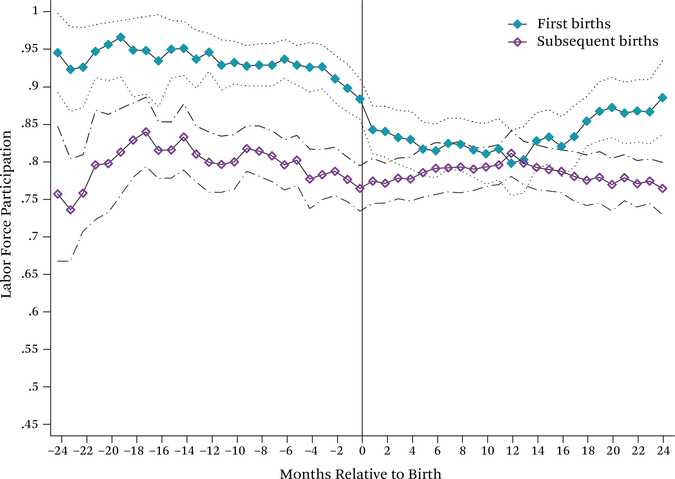
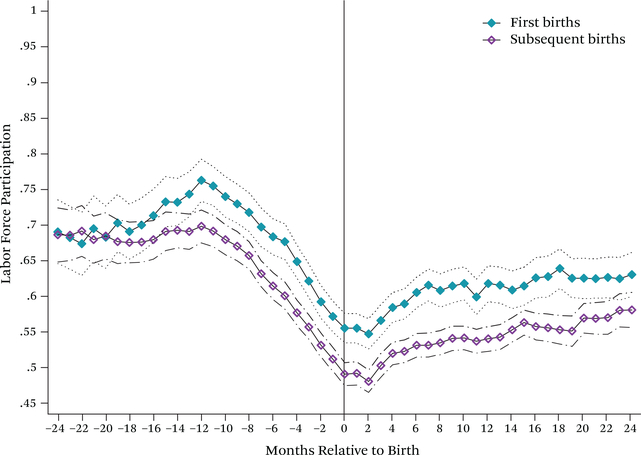
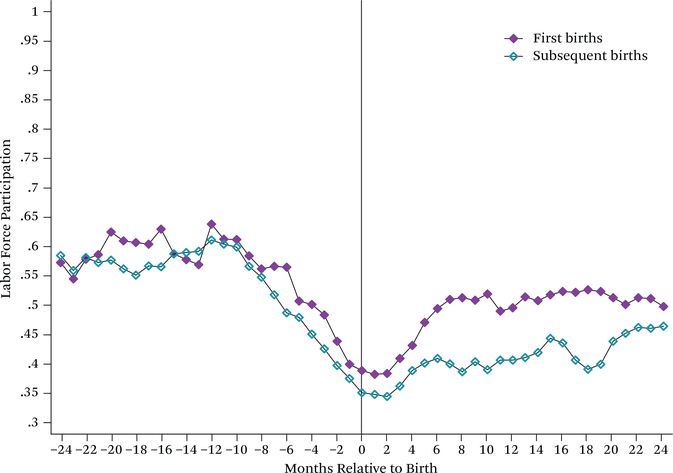
Figures 8 through 10, which present estimates of opting out behavior for women in three education groups, reveal substantial variation in labor-force participation around birth. Three main differences across groups—less than a bachelor’s, only a bachelor’s, and at least a master’s degree—are evident. First, the overall level of labor-force participation is rising in education—a year before first births 76 percent of women with less than a bachelor’s degree are in the labor force, versus 90 percent of women with a bachelor’s and 95 percent of women with at least a master’s. Second, less-educated women exit the labor force earlier in the months leading up to a birth than more-educated women—participation begins to drop as early at twelve months before birth among women with less than a bachelor’s but remains relatively stable until about two to five months before birth for women with bachelor’s and graduate degrees. Third, the trajectory of average participation for less-educated women shows a steeper fall in participation around birth followed by a steeper rebound in the year after birth, compared with a smoother drop and leveling off among more-educated women. The smoother profile implies that the majority of more-educated women who leave the labor force take an extended time away from it. Although the dip and return pattern indicates that some less-educated women exit briefly around a birth and return to work relatively quickly within the first six months after a birth.
Figure 8. Labor-Force Participation, Less than Bachelor’s.
Source: Author’s calculations based on the 2004 and 2008 Survey of Income and Program Participation panels.
Notes: See notes to figure 7.
Despite these differences in level and pattern of labor-force participation, all education groups experience a statistically significant, substantial, and sustained drop in labor-force participation around childbearing. As a summary measure, comparing participation a year prior to a first birth and two years after a subsequent birth, the drop for women with less than a bachelor’s degree is 18 percentage points, for those with only a bachelor’s is 28 percentage points, and for those with at least a master’s is 18 percentage points.13 The following paragraphs discuss the trends by education in more detail, including differences by parity.
Figure 8 presents estimates for women who had less than a bachelor’s degree when they gave birth. The trend in labor-force participation for this group is upward from two years prior to one year prior to first births. Given that a quarter of this group was twenty years old or younger at first birth, and that 45 percent had some college education, this trend is largely explained by transitions from school enrollment to work.14 Labor-force participation reaches a peak around 76 percent one year before first births and immediately starts to fall from that time through the second month after birth, reaching its lowest point of 55 percent two months afterward. By the seventh month, participation has returned to 62 percent and remains relatively stable for at least two years. Two years before subsequent births, the participation rate for women without a bachelor’s degree is 6 percentage points lower than a year before first births, but the pattern of opting out is quite similar to that around first births for less-educated women.
Figures 9 and 10 show results for women with bachelor’s and advanced degrees. For women with a bachelor’s degree, labor-force participation is stable at around 90 percent from two years to around six months before first births, and at about 75 percent from two years to a year before subsequent births. The estimates for women with at least a master’s degree are noisier given the substantially smaller sample size; however, we see participation rates around 95 percent up to two months before first births and 80 percent up to a year before subsequent births. Among women with only a bachelor’s degree experiencing first births, labor-force participation falls from 92 percent in twelve to six months before birth to around to 77 percent in the six to twelve months after. By twenty-four months after, participation rates for this group remained around 77 percent—16 percent lower than a year before. The extended event study in figures A1 and A2 shows that this lower participation persists into the fourth year after birth. Although estimates this long after birth are not as precise, they are statistically significantly lower than participation rates before birth. The master’s-plus women opt out at lower, but still substantial, rates, participation falling for first-time mothers from above 90 percent to around 80 percent during the year after first births, returning close to pre-birth levels only by the end of the second year afterward. The declines in labor-force participation start earlier for subsequent births than for first births for both the bachelor’s and at-least-master’s women. The rates of decline are less steep after subsequent births, particularly for women with at least a master’s degree, but importantly, occur from base levels of participation that are about 15 percentage points lower than a year before first births.
Figure 9. Labor-Force Participation, Bachelor’s Only.
Source: Author’s calculations based on the 2004 and 2008 Survey of Income and Program Participation panels.
Notes: See notes to figure 7.
Has Opting Out Changed?
Belkin’s opt-out revolution implies that women’s behavior changed dramatically over time. I test this claim by comparing women’s opting-out behavior across the 1980s, 1990s, and 2000s in terms of both labor-force participation and hours worked. I find that, despite notable changes in participation around birth over the past twenty-five years, the similarities are more striking than the differences. The rate of women opting into part-time work, meanwhile, has decreased for more-educated mothers.
Comparing Rates
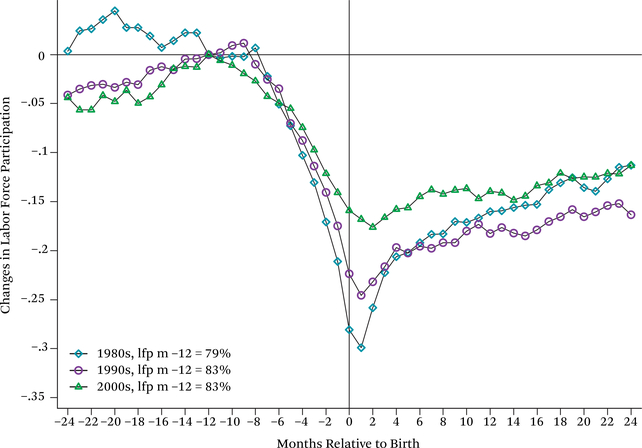
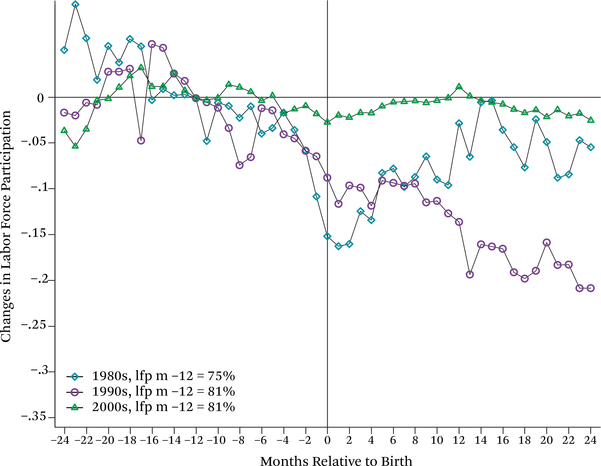
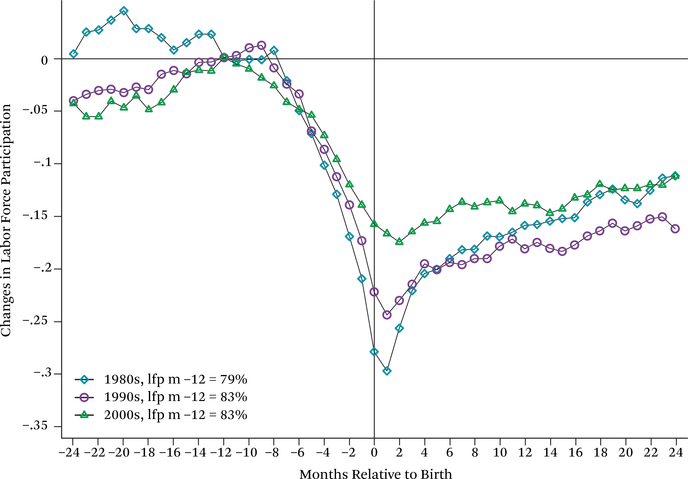
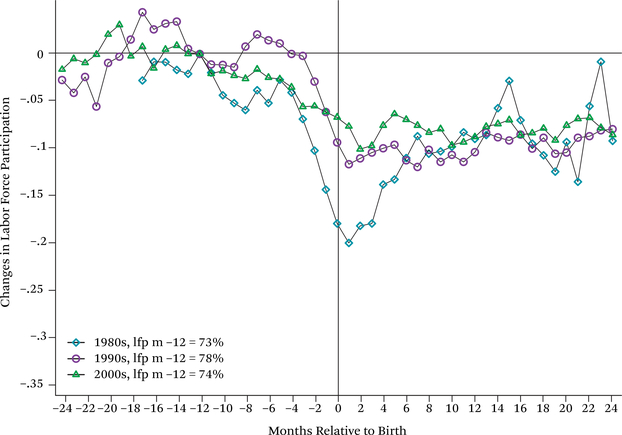
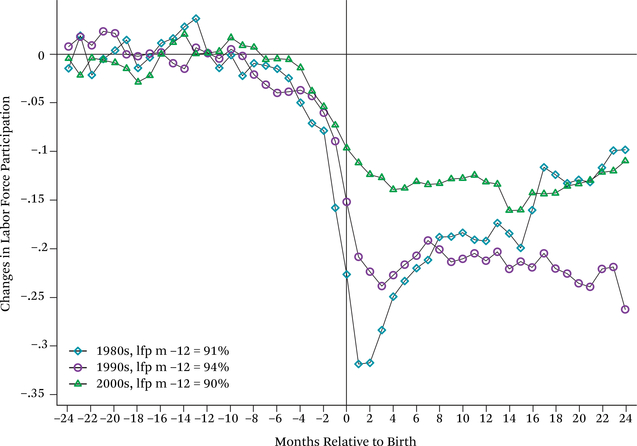
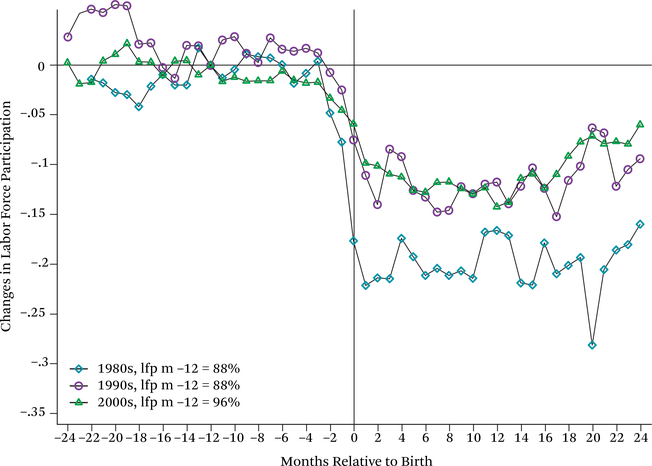
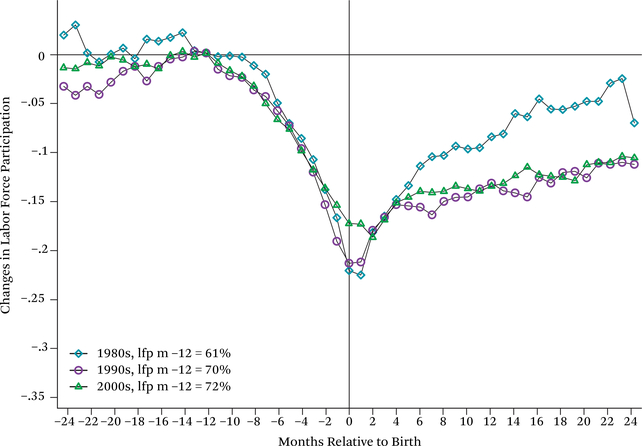
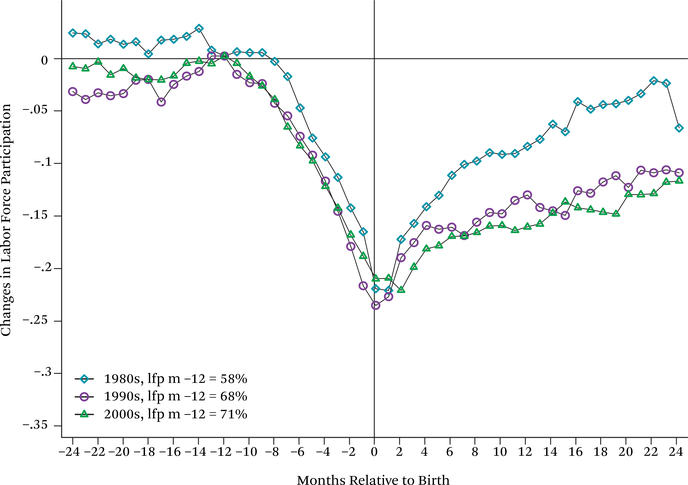
I estimate equation (1) separately by education, parity and decade using the birth samples from the 1984–1986, 1996, 2004, and 2008 SIPP panels. Figures 11 through 18 compare the δj coefficients across the three decades for each education and parity, thus showing the monthly changes (rather than levels) in labor-force participation relative to participation one year before birth.15
Figure 11. Changes in Labor-Force Participation, All, First Births.
Source: Author’s calculations based on the 1984–1986, 1996, 2004, and 2008 Survey of Income and Program Participation panels.
Notes: Women age eighteen to forty-five who give birth during one of the panels. Plots show changes in labor force participation from twenty-four months before to twenty-four months after birth (plotting the coefficients from equation (1) with dependent variable an indicator for being in the labor force estimated separately by education and parity).
Figure 18. Changes in Labor-Force Participation, Master’s Plus, Subsequent Births.
Source: Author’s calculations based on the 1984–1986, 1996, 2004, and 2008 Survey of Income and Program Participation panels.
Notes: See notes to figure 15.
Both differences and surprising similarities in opting-out behavior across the three decades are notable. The main difference is the much steeper drop and return pattern immediately following a birth in the 1980s compared with the later decades, indicating a lower incidence of short-term labor-force exits around birth over time. The shift from the 1980s to the 2000s is particularly large for college-educated mothers; the least-educated mothers still show some evidence of short-term intermittency around birth in the 2000s (as discussed earlier). One explanation for the less dramatic fall in labor-force participation in the months directly around birth in the later decades is the increase in family-friendly policies that allow women to take leave rather than exit the labor force right around birth that have largely benefited more-educated workers.16
Looking beyond six to eight months after birth, however, the similarities in opting out are striking. As figure 11 shows, in each decade women’s participation rate in the one to two years after a first birth was 15 to 17 percentage points lower than one year before the birth, and the differences are not statistically significant. Contrary to Belkin’s claim, the size of the reduction in the participation rate of college-educated mothers did not grow between the 1980s and 2000s—the drop was roughly 14 percentage points after first births in both decades. To the extent that behavior changed at all beyond the early months around birth, evidence indicates a reduction in opting out among women with at least a master’s degree.
As seen in figures 13 through 16, sharper drops followed by steeper recoveries in the 1980s, compared with those in the 1990s and 2000s, are echoed in the experiences of both women with less than a college education and those with bachelor’s degrees, though the magnitudes and base levels of participation before birth differ across the two groups. For women without a college degree at subsequent births, opting-out behavior changes from the 1980s to the 2000s. All three decades show an initial 25 percentage point drop in labor-force participation more than a year before birth, but in the 1980s women returned at a significantly faster rate than in the 1990s and 2000s. In results not shown here, I separate women with some college from women with a high school diploma or less and find that the divergence is driven by the less-educated mothers who stay out of the labor force after subsequent births at higher rates in the later decades. This result is surprising in light of welfare reform in the 1990s that encouraged women, including those with young children, to return to work.17
Figure 13. Changes in Labor-Force Participation, Less than Bachelor’s, First Births.
Source: Author’s calculations based on the 1984–1986, 1996, 2004, and 2008 Survey of Income and Program Participation panels.
Notes: See notes to figure 11.
Figure 16. Changes in Labor-Force Participation, at Least Bachelor’s, Subsequent Births.
Source: Author’s calculations based on the 1984–1986, 1996, 2004, and 2008 Survey of Income and Program Participation panels.
Notes: See notes to figure 15.
Figure 15 presents estimates of opting out around first births for women with only a bachelor’s degree. From twelve to four months before birth, the pattern of opting out is almost identical across the decades. From around four months before to six months after birth, we again find that women in the 1980s opt out at significantly higher rates, falling to 32 percentage points below pre-birth levels versus only 25 percentage points in the 1990s and 15 points in the 2000s. This steeper fall of the 1980s, however, is followed by a steeper rise, and by eight months after birth the relative change in labor-force participation is almost identical across the three decades. The patterns of opting out from six to twenty-four months after birth are not statistically significantly different comparing the 1980s and the 2000s.18 The fourth column of table A1 provides the results of statistical tests of an opt-out continuation for various intervals around birth. For women with bachelor’s degrees experiencing subsequent births, the opting-out patterns and level of pre-birth participation are quite similar over the three decades; the only notable differences are a delay in leaving the labor force before birth in the 1990s and higher initial rates of opting out in the 1980s.
Figure 15. Changes in Labor-Force Participation, at Least Bachelor’s, First Births.
Source: Author’s calculations based on the 1984–1986, 1996, 2004, and 2008 Survey of Income and Program Participation panels.
Notes: Women age eighteen to forty-five who give birth during one of the panels. Plots show changes in labor-force participation from twenty-four months before to twenty-four months after birth (plotting the coefficients from equation (1) with dependent variable an indicator for being in the labor force estimated separately by education and parity).
The estimates for women with at least a master’s degree are less precise because sample sizes are smaller, but it is at this education level that we see the biggest changes in behavior over time. Figure 17 shows that following an almost identical absence of opting out from twelve to two months before first births, women in the 1980s opted out around 10 percentage points more than in the later decades, though labor-force participation did fall in the in the 1990s and 2000s, bouncing around 7 to 15 percentage points below the year before birth. Figure 18 shows that estimates of opting out after subsequent births were greater in the 1990s than in the 1980s and 2000s, though these estimates are not precise. No opting out around subsequent births occurring during the 2004 panel was statistically significant. However, labor-force participation a year before these births was 16 percentage points lower than for similarly educated women in the 2000s birth sample—81 versus 95 percent.
Figure 17. Changes in Labor-Force Participation, Master’s Plus, First Births.
Source: Author’s calculations based on the 1984–1986, 1996, 2004, and 2008 Survey of Income and Program Participation panels.
Notes: See notes to figure 15.
Opting for Fewer Hours
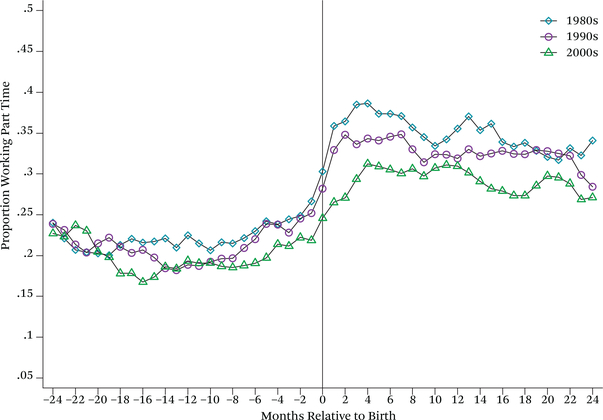
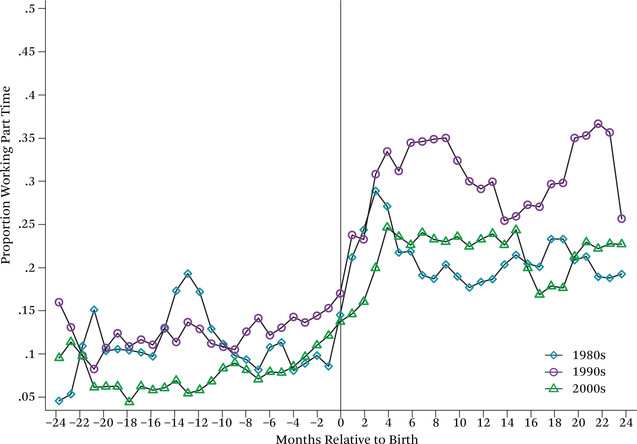
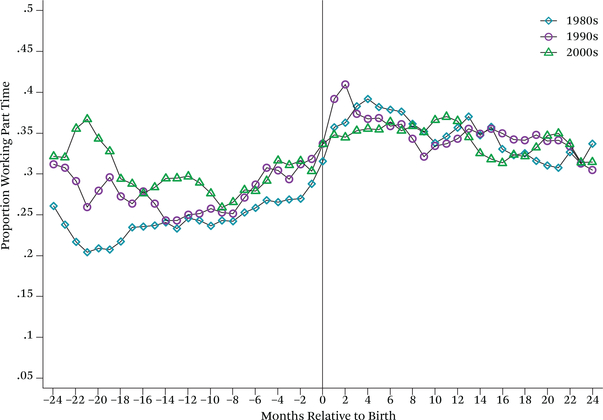
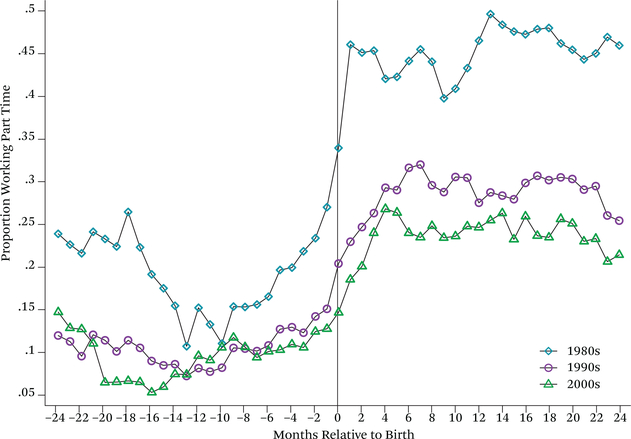
Opting out usually refers to women exiting the labor force. However, to balance work and family, women may choose instead to reduce their work hours rather than leave altogether after they have children. Figures 19 through 22 compare the proportion of women who were working fewer than thirty-five hours a week—part time, around first births, conditional on working, by education across the 1980s, 1990s, and 2000s.19 Across the education spectrum, the proportion of women working part time increases substantially after first births in all three decades. The transition to part-time work has diminished over time for more-educated women, however.
Figure 19. Part-Time Work, All, First Births.
Source: Author’s calculations based on on the 1984–1986, 1996, 2004, and 2008 Survey of Income and Program Participation panels.
Notes: Women age eighteen to forty-five who give birth during the panels. Plots show proportion working part time (less than thirty-five hours a week) conditional on working from twenty-four months before to twenty-four months after birth (plotting the coefficients from equation (1) with the dependent variable an indicator for working part-time estimated separately by education and parity).
Figure 22. Part-Time Work, Master’s Plus, First Births.
Source: Author’s calculations based on on the 1984–1986, 1996, 2004, and 2008 Survey of Income and Program Participation panels.
Notes: See notes to figure 19.
Figure 20 shows that the proportion of women with less than a bachelor’s degree who shift into part-time work after first births has remained relatively stable since the 1980s—a five to 10 percentage point increase from a base around 27 percent a year earlier. Figures 21 and 22 show that, for women with bachelor’s degrees and those with at least a master’s, both the shifts into part-time work after birth and the changes over time in these shifts are more substantial. The 1980s saw a relatively large increase in part-time work after first births—from 15 percent a year before to 45 percent a year after among women with bachelor’s degrees, and from 10 percent to around 32 percent for those with at least master’s degrees. In the 1990s and 2000s, from pre-birth levels of part-time work around 10 percent, the increase was substantially less—to about 29 in the 1990 and 24 percent in the 2000s in the two years after birth for women with bachelor’s degrees and to 20 percent for those with at least a master’s. This is surprising given recent opinion polls, which indicate that the majority of working mothers believe it would be ideal for themselves and their children if they worked part-time (Wang, Parker, and Taylor 2013). This, combined with the finding that 40 percent of nonworking mothers also think that working part time would be their ideal situation, suggests that a lack of good part-time options may be a driver of the opt-out continuation.20
Figure 20. Part-Time Work, Less than Bachelor’s, First Births.
Source: Author’s calculations based on on the 1984–1986, 1996, 2004, and 2008 Survey of Income and Program Participation panels.
Notes: See notes to figure 19.
Figure 21. Part-Time Work, at Least Bachelor’s, First Births.
Source: Author’s calculations based on on the 1984–1986, 1996, 2004, and 2008 Survey of Income and Program Participation panels.
Notes: See notes to figure 19.
Opting Out by Race and Marital Status
Figures 4 through 6 show that, historically, black mothers participated in the labor force at substantially higher rates than white mothers and that their participation increased more steeply through the 1970s, though the participation rates of black and white mothers have started to converge since the 1990s. In contrast, Hispanic mothers historically participated at lower levels, similar to white mothers through the 1970s, but their participation did not rise as steeply in the 1980s and 1990s. In 2010, only around 50 percent of Hispanic mothers with children under two were in the labor force, versus 72 percent of black mothers and 68 percent of white mothers.
Motivated by these differences in historical trends, I examine labor-force participation around birth by education and parity for black and Hispanic women. Figures 23 through 26 reveal that opting-out patterns for black and Hispanic mothers are distinctly different from the profiles for the full sample presented in figures 7 through 10. Black women with at least a bachelor’s opt out substantially less than the overall average, and less-educated black women actually opt in to the labor force after first births. Meanwhile, Hispanic mothers with bachelor’s degrees opt out at rates well above the average.
Figure 23. Opting Out in the 2000s, Blacks, Less than Bachelor’s.
Source: Author’s calculations based on the 2004 and 2008 Survey of Income and Program Participation panels.
Notes: Women age eighteen to forty-five who give birth during the panels. Plots show labor-force participation from twenty-four months before to twenty-four months after birth (plotting the coefficients from equation (1) added to the constant with dependent variable an indicator for being in the labor force estimated separately by race, education, and parity).
Figure 26. Opting Out in the 2000s, Hispanics, at Least Bachelor’s.
Source: Author’s calculations based on the 2004 and 2008 Survey of Income and Program Participation panels.
Notes: See notes to figure 23.
Figures 23 and 24 show opting-out patterns by parity for black mothers giving birth in the 2000s with less than a bachelor’s degree and at least a bachelor’s degree respectively. In contrast to all of the patterns in figures 4 through 6, figure 23 shows that labor-force participation is lowest before first births and that black women actually opt in on average after having children. Participation reaches a peak around 60 to 64 percent in the year before a first birth and then takes a 15 percentage point drop in the eight months centered around birth before rebounding to 65 percent a year after birth. A year before higher-order births, black mothers with less than a bachelor’s degree are participating at a much higher level, around 80 percent, before falling to 65 percent at the month of birth and to about 72 percent a year to two years after birth—a 17 percent increase comparing a year before first births to two years after subsequent ones.
Figure 24. Opting Out in the 2000s, Blacks, at Least Bachelor’s.
Source: Author’s calculations based on the 2004 and 2008 Survey of Income and Program Participation panels.
Notes: See notes to figure 23.
Figure 24 shows noisier estimates because the sample of black college-educated women is smaller. We see, though, that black women with at least a bachelor’s degree participate at rates similar to white women with bachelor’s degrees before first births—over 90 percent. In contrast to white women, however, they opt out substantially less—only 10 percentage points.
Figures 25 and 26 show opting out for Hispanic mothers. Among Hispanic women with less than a bachelor’s degree, labor-force participation is stable at around 60 percent before first births and at 50 percent from six months to two years after first births, taking a brief steeper dip in the four to six months around birth. The pattern for higher-order births is almost identical, but participation rates level off at around 40 to 45 percent two years after subsequent births—overall a 28 percent drop in labor-force participation. Figure 26 shows that college-educated Hispanic mothers participate around 90 percent before first births but at only 63 percent two years after subsequent births, a 32 percent drop.
Figure 25. Opting Out in the 2000s, Hispanic, Less than Bachelor’s.
Source: Author’s calculations based on the 2004 and 2008 Survey of Income and Program Participation panels.
Notes: See notes to figure 23.
Opting Out by Marital Status
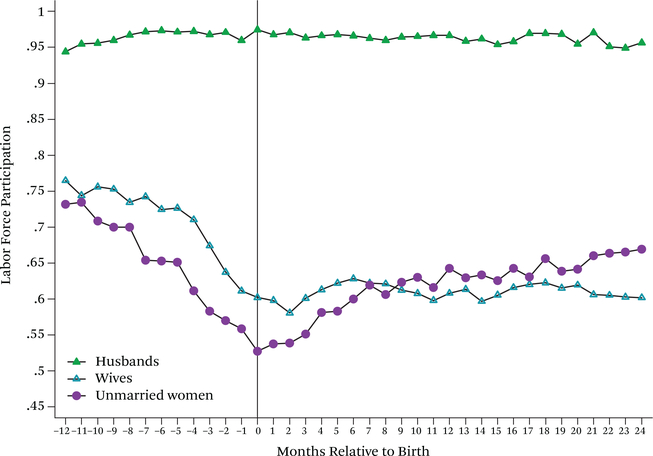
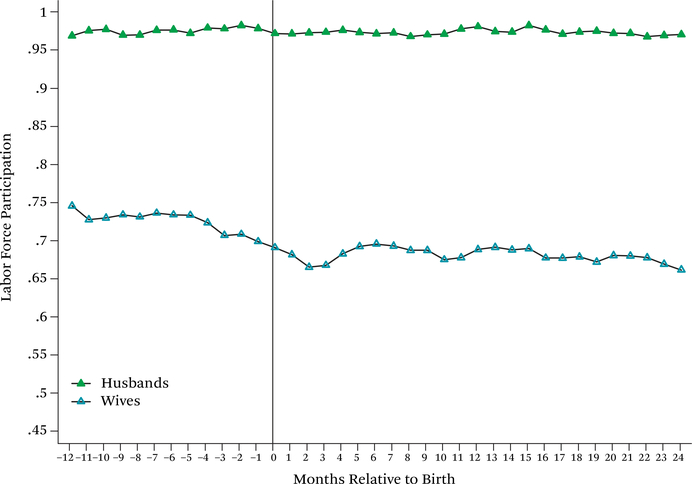
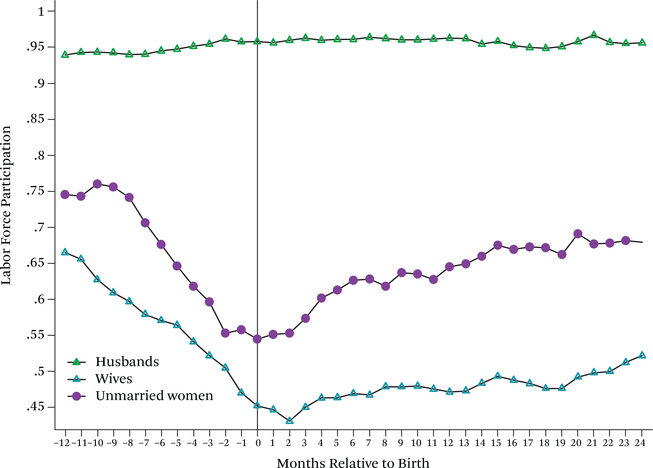
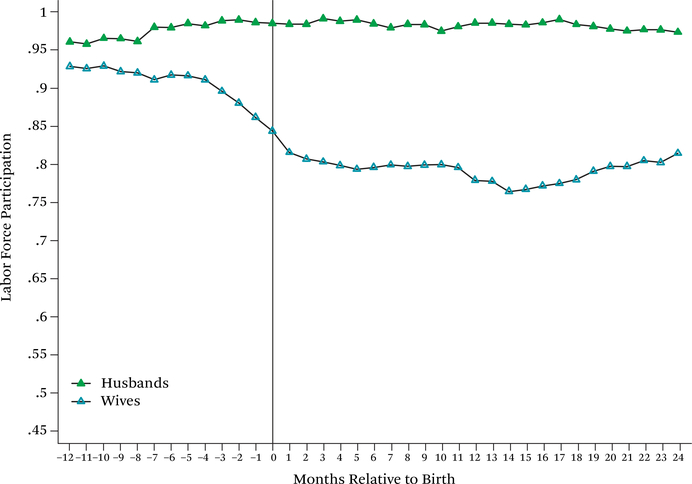
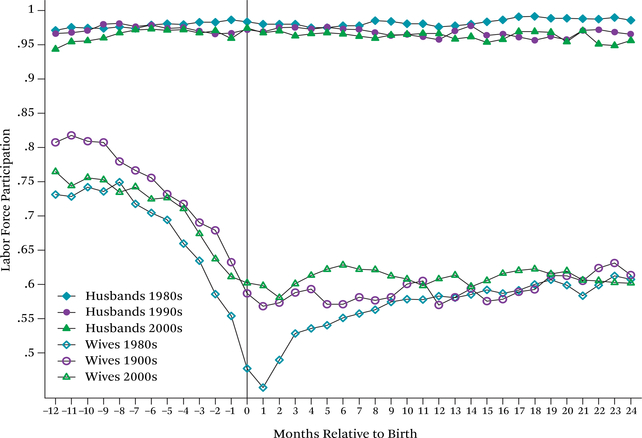
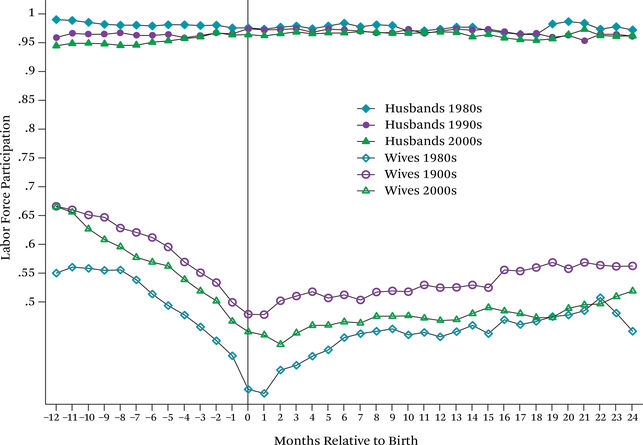
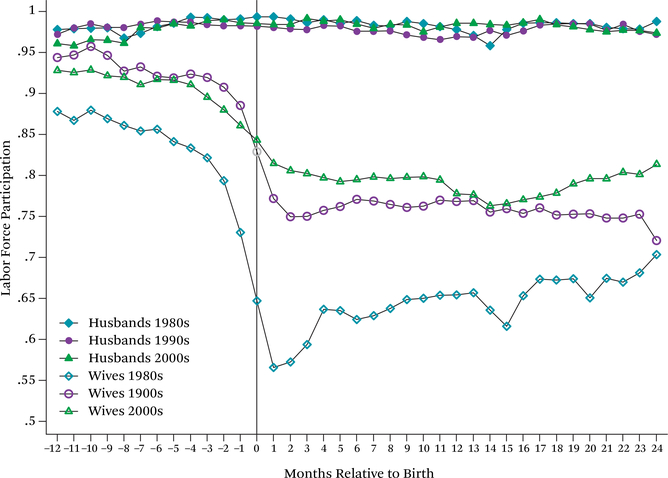
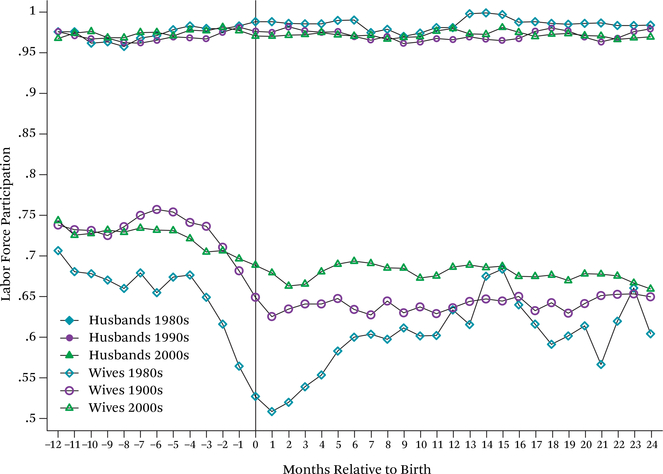
Because I can link fathers to births in the SIPP if they are present as a spouse at the time of birth, I also briefly address married fathers’ (lack of) opting out behavior. Figures 27 through 30 offer two primary takeaways. First, married women are less likely to reenter the labor force than unmarried women. Second, because fathers do not opt out of the labor force after a birth, by two years after subsequent births, the gap between mothers’ and fathers’ labor-force participation is 30 to 45 percentage points on average. Figures A7 through A10 indicate that this pattern of diverging participation within married couples along traditional gender lines has held remarkably stable over the past thirty years.
Figure 27. Fathers’ and Mothers’ Labor-Force Participation, Less than Bachelor’s, First Births.
Source: Author’s calculations based on the 2004 and 2008 Survey of Income and Program Participation panels.
Notes: Women age eighteen to forty-five who give birth during the panels and their spouses where relevant. Wives are women who were married with spouse present in the month they gave birth. Plots show labor-force participation from twenty-four months before to twenty-four months after birth (plotting the coefficients from equation (1) added to the constant with dependent variable an indicator for being in the labor force estimated separately by marital status, education, and parity).
Figure 30. Fathers’ and Mothers’ Labor-Force Participation, at Least Bachelor’s, Subsequent Births.
Source: Author’s calculations based on the 2004 and 2008 Survey of Income and Program Participation panels.
Notes: See notes to figure 27.
Figures 27 and 28 show that among women with less than a bachelor’s degree, married women reduce their participation after births substantially more than unmarried women after higher-order births—two years after birth only 52 percent of married women are in the labor force compared with 70 percent of unmarried women.21 Table 2 and table 3 indicate that marital status at birth varies substantially by education: only 48 percent of women with less than a bachelor’s degree married at first birth in the 2000s versus 91 percent of those with bachelor’s and 95 percent of those with master’s degrees or more. Because the vast majority of highly educated women are married at the time of birth, I do not show opting out for unmarried women with at least a bachelor’s degree in figures 29 and 30. Instead, I use this as an opportunity to compare the work behavior of wives and husbands around the time of birth. Figures 27 through 30 each tell the same story regarding married father’s labor-force participation around birth: about 95 percent and does not waver at any point during the event study window from two years before to two years after first or subsequent births for either education group. Meanwhile, the gap between the participation of husbands and wives grows to 42 percentage points for households in which the woman has less than a bachelor’s degree and to 32 percentage points in households with more-educated mothers. This is despite nearly identical participation rates among husbands and college-educated wives a year before first births.
Figure 28. Fathers’ and Mothers’ Labor-Force Participation, Less than Bachelor’s, Subsequent Births.
Source: Author’s calculations based on the 2004 and 2008 Survey of Income and Program Participation panels.
Notes: See notes to figure 27.
Figure 29. Fathers’ and Mothers’ Labor Force Participation, at Least Bachelor’s, First Births.
Source: Author’s calculations based on the 2004 and 2008 Survey of Income and Program Participation panels.
Notes: See notes to figure 27.
CONCLUSION
I have implemented a new dynamic measure of opting out across the education distribution in the 1980s, 1990s, and 2000s. I do not find an abrupt increase in opting out over the past three decades among highly educated women. In this, I concur with other recent findings rejecting an opt-out revolution. However, in the 2000s, a substantial and statistically significant percentage of women leave the labor force when they give birth. The rate of labor-force participation remains low for at least two years after first and subsequent births for women in all education categories—a pattern surprisingly similar to opting out for mothers in the 1990s and 1980s.
Although the opting-out profile is broadly similar across education, race, and marital status, investigating the differences in magnitude and timing provides motivation for future research. For example, women who are married are more likely to opt out (or at least to stay out longer) perhaps because they have more household resources. The vast majority of highly educated mothers are married and, as a result, have more resources. However, highly educated women also give up more in terms of future or current earnings when they exit the labor force. So why do they opt out at such high a rate?
Part-time or flexible work could provide an alternative to opting out. The Pew survey finds that half of working women would prefer to work part time when their children are young, yet I find that far fewer than half do so. The percentage preferring part-time work rises to 62 percent among college-educated working mothers, yet I find that the rate of part-time work among these women has fallen to around 25 percent since the 1980s. This inconsistency may be explained by a lack of desirable part-time alternatives, making labor-force exit the best among less than ideal alternatives for many women. One of the women in Belkin’s story states that she quit her job when her son was young because she was denied a part-time option. The Pew finding that 41 percent of nonworking mothers also claim part-time work would be ideal is suggestive evidence to corroborate this hypothesis. Resolving this puzzle may involve investigating nuances by occupation. As Claudia Goldin points out in her 2014 presidential address, occupations vary in the wage penalty to both time away and reduced hours, and that many of the occupations that highly skilled women have shifted into in recent decades like business and law exhibit this nonlinearity in rewards to long hours and uninterrupted attachment (Goldin 2014; see also Weeden, Cha, and Bucca, this issue).
Because the opting-out profile has remained relatively stable since the 1980s—any changes actually increasing rather than decreasing participation (such as in the months immediately around birth among women with at least a master’s)—opting out does not offer an explanation for the plateau in the growth of women’s labor-force participation. But an opt-out continuation, combined with a relative shift into occupations that penalize time away from work and reward long hours, may explain the persistence of the gender gap in earnings.
Figure 2. Labor-Force Participation of Women, Less than Bachelor’s.
Source: Author’s compilation based on U.S. Censuses 1950–1990 (Ruggles et al. 2010), Current Population Survey 1968–2014 (King et al. 2010).
Notes: See notes to figure 1.
Figure 5. Labor-Force Participation, with and Without Infant Children, Blacks.
Source: Author’s compilation based on U.S. Censuses 1950–1990 (Ruggles et al. 2010), Current Population Survey 1968–2014 (King et al. 2010).
Notes: See notes to figure 4.
Figure 12. Changes in Labor-Force Participation, All, Subsequent Births.
Source: Author’s calculations based on the 1984–1986, 1996, 2004, and 2008 Survey of Income and Program Participation panels.
Notes: See notes to figure 11.
Figure 14. Changes in Labor-Force Participation, Less than Bachelor’s, Subsequent Births.
Source: Author’s calculations based on the 1984–1986, 1996, 2004, and 2008 Survey of Income and Program Participation panels.
Notes: See notes to figure 11.
Acknowledgments
The author is grateful to Martha Bailey, Charlie Brown, Mary Corcoran, Robert Garlick, Andrew Goodman-Bacon, Brad Hershbein, David Lam, Matt Rutledge, Jeff Smith, and Pamela Smock for helpful comments and guidance. This research was supported in part by an NICHD training grant to the Population Studies Center at the University of Michigan (T32 HD007339).
APPENDIX
Figure A1. 2004 and 2008 SIPP Panels: Maximum Event Study Window, First Births.
Source: Author’s calculations based on the 2004 and 2008 Survey of Income and Program Participation panels.
Notes: Women age eighteen to forty-five who give birth during the panels. Plots show labor-force participation from forty-eight months before to forty-eight months after birth (plotting the coefficients from equation (1) added to the constant with dependent variable an indicator for being in the labor force estimated separately by education and parity). Dashed lines are 95 percent point-wise confidence intervals.
Figure A2. 2004 and 2008 SIPP Panels: Maximum Event Study Window, Subsequent Births.
Source: Author’s calculations based on the 2004 and 2008 Survey of Income and Program Participation panels.
Notes: See notes to figure A1.
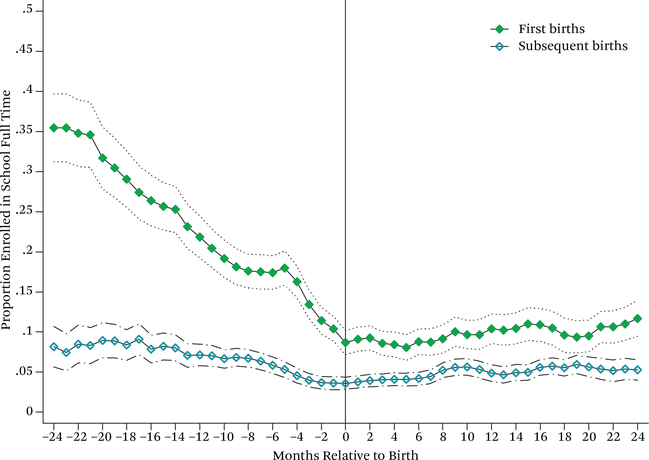
Figure A3. School Enrollment Around Birth, Less than Bachelor’s, Full Time.
Source: Author’s calculations based on the 2004 and 2008 Survey of Income and Program Participation panels.
Notes: Women age eighteen to forty-five who give birth during the panels. Plots show proportion enrolled in school from twenty-four months before to twenty-four months after birth (plotting the coefficients from equation (1) added to the constant estimated separately by education and parity). Dashed lines are 95 percent point-wise confidence intervals.
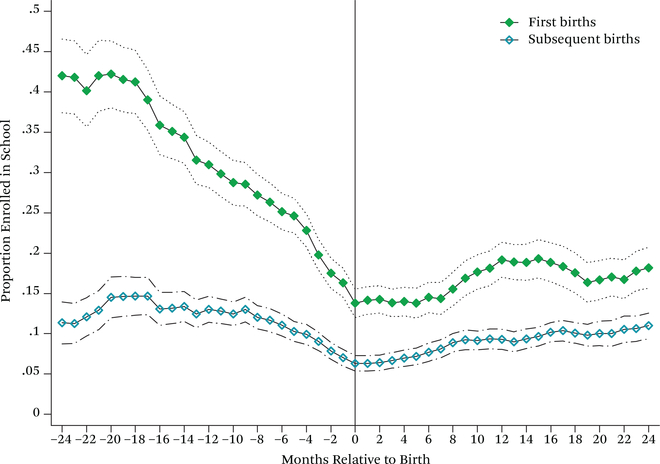
Figure A4. School Enrollment Around Birth, Less than Bachelor’s, Enrolled.
Source: Author’s calculations based on the 2004 and 2008 Survey of Income and Program Participation panels.
Notes: See notes to figure A3.
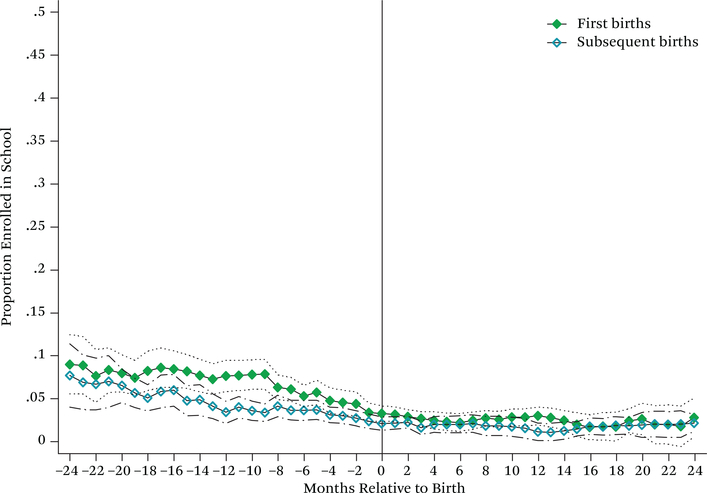
Figure A5. School Enrollment Around Birth, at Least Bachelor’s, Full Time.
Source: Author’s calculations based on the 2004 and 2008 Survey of Income and Program Participation panels.
Notes: See notes to figure A3.
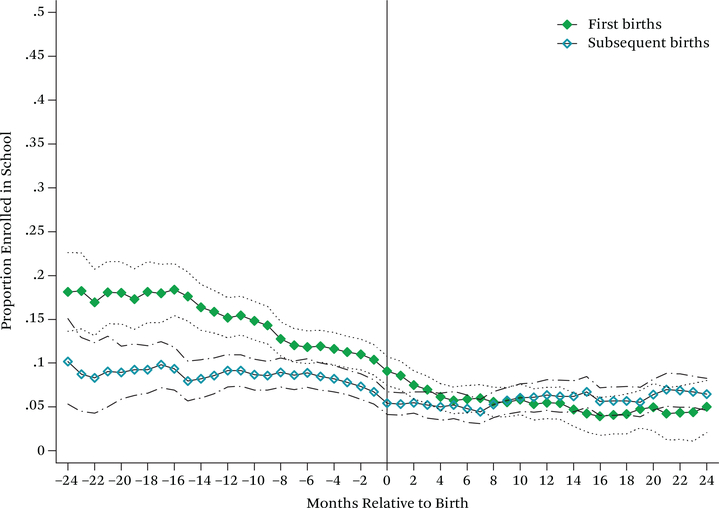
Figure A6. School Enrollment Around Birth, at Least Bachelor’s, Enrolled.
Source: Author’s calculations based on the 2004 and 2008 Survey of Income and Program Participation panels.
Notes: See notes to figure A3.
Figure A7. Husbands and Wives Participation, Less than Bachelor’s, First Births.
Source: Author’s calculations based on the 1984-1986, 1996, 2004, and 2008 Survey of Income and Program Participation panels.
Notes: Women age eighteen to forty-five who give birth during the panels and their spouse. Wives are women who were married with spouse present in the month they gave birth. Plots show labor-force participation from twelve months before to twenty-four months after birth (plotting the coefficients added to the constant from equation (1) with the dependent variable an indicator for being in the labor force estimated separately by marital status, education, and parity).
Figure A8. Husbands and Wives Participation, Less than Bachelor’s, Subsequent Births.
Source: Author’s calculations based on the 1984-1986, 1996, 2004, and 2008 Survey of Income and Program Participation panels.
Notes: See notes to figure A7.
Figure A9. Husbands and Wives Participation, at Least Bachelor’s, First Births.
Source: Author’s calculations based on the 1984-1986, 1996, 2004, and 2008 Survey of Income and Program Participation panels.
Notes: See notes to figure A7.
Figure A10. Husbands and Wives Participation, at Least Bachelor’s, Subsequent Births.
Source: Author’s calculations based on the 1984-1986, 1996, 2004, and 2008 Survey of Income and Program Participation panels.
Notes: See notes to figure A7.
Table A1.
Opting-Out Rates over Time and Statistical Test of Opt-Out Continuation
| Average change in lfp compared with a year prior to birth: | (1) 2000s | (2) 1990s | (3) 1980s | (1) vs (3) Test of difference in opt-out profiles between 1980s and between 1980s and 2000s (p-values)a |
|---|---|---|---|---|
| Less than bachelor’s | ||||
| First births | ||||
| -Six to birth | −0.141 | −0.141 | −0.159 | 0.000 |
| Birth to six months | −0.190 | −0.215 | −0.234 | 0.000 |
| Six to twelve months | −0.151 | −0.172 | −0.168 | 0.502 |
| Six to twenty-four months | −0.143 | −0.148 | −0.144 | 0.600 |
| Subsequent births | ||||
| -Six to birth | −0.143 | −0.142 | −0.131 | 0.028 |
| Birth to six months | −0.192 | −0.172 | −0.178 | 0.000 |
| Six to twelve months | −0.160 | −0.130 | −0.117 | 0.349 |
| Six to twenty-four months | −0.145 | −0.108 | −0.095 | 0.217 |
| Rate of opt out after subsequent births compared with women prior to first birthsb | ||||
| Six months | −0.230 | −0.246 | −0.303 | |
| Twelve months | −0.221 | −0.211 | −0.283 | |
| Twenty-four months | −0.181 | −0.178 | −0.280 | |
| Bachelor’s only | ||||
| First births | ||||
| -Six to birth | −0.045 | −0.058 | −0.115 | 0.144 |
| Birth to six months | −0.129 | −0.194 | −0.303 | 0.001 |
| Six to twelve months | −0.138 | −0.180 | −0.250 | 0.696 |
| Six to twenty-four months | −0.145 | −0.187 | −0.230 | 0.638 |
| Subsequent births | ||||
| -Six to birth | −0.050 | −0.019 | −0.093 | 0.070 |
| Birth to six months | −0.082 | −0.097 | −0.166 | 0.021 |
| Six to twelve months | −0.089 | −0.100 | −0.109 | 0.630 |
| Six to twenty-four months | −0.089 | −0.084 | −0.103 | 0.414 |
| Rate of opt out after subsequent births compared with women prior to first birthsb | ||||
| Six months | −0.253 | −0.300 | −0.272 | |
| Twelve months | −0.274 | −0.289 | −0.259 | |
| Twenty-four months | −0.278 | −0.259 | −0.266 | |
| Master’s plus | ||||
| First births | ||||
| –Six to birth | −0.030 | −0.023 | −0.043 | 0.091 |
| Birth to six months | −0.108 | −0.134 | −0.192 | 0.344 |
| Six to twelve months | −0.130 | −0.167 | −0.180 | 0.317 |
| Six to twenty-four months | −0.108 | −0.165 | −0.178 | 0.211 |
| Subsequent births | ||||
| –Six to birth | −0.016 | −0.037 | −0.065 | 0.027 |
| Birth to six months | −0.022 | −0.093 | −0.137 | 0.433 |
| Six to twelve months | −0.004 | −0.093 | −0.068 | 0.448 |
| Six to twenty-four months | −0.014 | −0.137 | −0.037 | 0.271 |
| Rate of opt out after subsequent births compared with women prior to first birthsb | ||||
| Six months | −0.153 | −0.224 | −0.254 | |
| Twelve months | −0.133 | −0.264 | −0.185 | |
| Twenty-four months | −0.180 | −0.332 | −0.197 | |
Source: Author’s calculations based on the Survey of Income and Program Participation (2000s: 2004 and 2008 panels, 1990s: 1996 panel, 1980s: 1984, 1985, and 1986 panels).
Test that the difference between the full set of δ coefficients from the relevant interval are jointly different in the 2000s from the 1980s. Based on pooling the data from the 1980s and 2000s panels and estimating equation (1) interacting dummies for each panel with each month-relative-to-birth dummy and testing if the series of relevant interaction terms are jointly equal to zero.
This is an approximate measure, since first-birth mothers are different from subsequent-birth mothers.
Table A2.
Mothers’ Opinions About Their Ideal Work Situation
| A. By Education | ||||||
|---|---|---|---|---|---|---|
| Less than Bachelor’s |
At Least Bachelor’s |
|||||
| Percent who answer ... | Not Working | Working | Not Working | Working | Not Working | Working |
| Considering everything, what would be the ideal situation for YOU—working: |
||||||
| Full-time | 22 | 37 | 26 | 43 | 13 | 29 |
| Part-time | 41 | 50 | 43 | 43 | 34 | 62 |
| Not at all | 35 | 11 | 29 | 13 | 53 | 8 |
| Sample size | 124 | 229 | 86 | 119 | 38 | 110 |
| B. By Race | ||||||
|---|---|---|---|---|---|---|
| White |
Black |
Hispanic |
||||
| Percent who answer ... | Not Working | Working | Not Working | Working | Not Working | Working |
| Considering everything, what would be the ideal situation for YOU—working: |
||||||
| Full-time | 11 | 28 | 49 | 63 | 29 | 47 |
| Part-time | 39 | 58 | 21 | 27 | 52 | 43 |
| Not at all | 48 | 12 | 30 | 10 | 19 | 11 |
| Sample size | 68 | 136 | 19 | 34 | 32 | 39 |
Source: Pew Research Center “Gender and Generations” dataset. Survey conducted November to December 2012. Respondents were over the age of eighteen and reported having at least one child under the age of eighteen. The Pew Research Center bears no responsibility for the analyses or interpretations of the data presented here.
Footnotes
Women who are on leave maintain attachment to their employers and are considered in the labor force.
Antecol and Boushey measure the child penalty in each calendar year (or decade) for all women in addition to conducting separate analysis by education category. Percheski focuses exclusively on women who identify as being in managerial or professional occupations and measures the penalty by birth cohort.
The first SIPP panel ran from 1984 to 1986. The Census Bureau initially fielded smaller, shorter, overlapping panels starting each year. The schedule was changed in 1996, and larger, longer, non-overlapping panels are now fielded approximately every four years.
I exclude women giving birth before age eighteen because my focus is not on young teen mothers who are unlikely to have prior labor market experience. Boushey (2005) and Antecol (2010) present results for women ages twenty-five to forty-four. Because I focus on birth events for women by educational attainment, extending the population to include women eighteen to twenty-five makes my results more representative for women with less than a college degree given that they tend to be younger when they have children. For example, looking at outcomes around first birth for women age twenty-five to forty-five with only a high school diploma will give a distorted picture of the high school graduate population because most women in this education category have first births before the age of twenty-five. Adding mothers under age twenty-five, however has almost no effect on the sample of college-educated women giving birth and should not affect comparability with previous work on opting out among women with at least a college degree.
If a mother has a child (children) who lives outside of the household when she gives birth, she will be mischar-acterized as a first-time mother, but this is likely to be a rare occurrence. The SIPP core waves do not ask number of own children ever born.
The FMLA went into effect in August 1993. The act requires businesses with fifty or more employees to pro-vide up to twelve weeks of unpaid job-protected leave per year to employees who have worked for at least twelve months and at least 1,250 hours who need leave for covered reasons, including the birth of a child (Waldfogel 2001). The states of California, New Jersey, and Rhode Island mandate paid family leave (Byker 2016). Washington state signed a paid leave law in 2007, but it is not yet in effect due to lack of a funding mechanism. New York state enacted a law in 2016 effective January 2018.
This is monthly in the 1996 and 2004 SIPP panels, but only for a four-month reference period in the 1984 to 1986 panels.
I also include a single dummy for all months more than twenty-four months before birth, and a dummy for all months more than twenty-four months after birth.
In the case of the binary labor-force participation outcome, I estimate a linear probability model. I calculate variance using a Huber-White heteroscedasticity-robust estimator clustered at the individual mother level. This allows for arbitrary covariance over time within units, and allows for heteroscedasticity across units, which is essential given that the linear probability model inherently has heteroskedastic errors.
Note that in 2004, the Census Bureau randomly dropped half of the sample for budget reasons. I do not count these women as having attrited from the sample in my robustness checks. Also, some women enter the panel after the beginning of the panel because they enter a household that is in the panel. These women are also not excluded in the robustness check.
For this reason, when results are displayed in levels, I show results from models that do not include year fixed effects, but I could alternatively plot levels relative to a reference year. The results are not substantively different.
Heteroscedasticity-robust standard errors clustered at the mother level are used to construct 95-percent point-wise confidence intervals that account for the standard errors of the estimates of the constant and the δj coefficients (and their covariance).
The y-axis for the figures in the paper are in the units of percentage points so I state changes as percentage point changes. However, given that different groups of women experience changes starting from different base levels, it is useful to convert these to percentage changes. In this case, the drop for women with less than a bachelor’s degree is 24 percent, for women with only a bachelor’s is 30 percent, and for women with at least a master’s nearly 20 percent.
I am able to track school enrollment in the SIPP. Figures A3 through A6 confirm this explanation for the ris-ing trend in labor-force participation prior to first births for mothers with less than a bachelor’s degree as full-time school enrollment falls from 35 percent to 20 percent in the penultimate year before birth.
The legend for each subsection gives the reference level of participation at twelve months before birth for each respective group. Confidence intervals are omitted to make the figures legible, but figures with confidence intervals are available on request.
Family-friendly policies include Family Medical Leave Act in 1993 or paid leave policies, which were mandated in California, Rhode Island, and New Jersey in the 2000s and are offered voluntarily by some firms. Byker (2016) examines the impact of paid leave laws on opting-out behavior and concludes that paid leave is instrumental in reducing short-term departures from the labor force around birth, particularly for less-educated women.
Breaking this high-school-or-less group down further, I find that the increased opting out in the 2000s is partially driven by unmarried women with less than a high school diploma, the population likely to be affected by welfare reform. However, opting out is also more prevalent in the 2000s than in earlier decades among married mothers with a high school diploma or less.
As described, this claim is based on a test that fails to reject that the full set of δ6 to δ24 coefficients are jointly different in the 2000s from the 1980s.
The proportion of women working part time before subsequent births is quite similar to the proportion two years after first births and does not change substantially after subsequent births, so these results are excluded.
The proportion of working women with at least a bachelor’s degree who claim that working part time would be ideal is over 60 percent as seen in table A2, which gives results of the Pew study by education and race.
Marital status is defined by status during the month of birth. Marital status may change after birth.
REFERENCES
- Antecol Heather. 2011. “The Opt-Out Revolution: Re-cent Trends in Female Labor Supply.” Research in Labor Economics 33(1): 45–83. [Google Scholar]
- Belkin Lisa. 2003. “The Opt-Out Revolution.” New York: Times Magazine, October 26, pp. 23–32. [Google Scholar]
- Bertrand Marianne, Goldin Claudia, and Katz Lawrence. 2010. “Dynamics of the Gender Gap for Young Professionals in the Corporate and Financial Sectors.” American Economic Journal: Applied Economics 2(3): 228–55. [Google Scholar]
- Blau Francine D., and Kahn Lawrence M. 1997. “Swimming Upstream: Trends in the Gender Wage Differential in the 1980s.” Journal of Labor Economics 15(1): 1–42. [Google Scholar]
- Blau Francine D., and Kahn Lawrence M. 2004. “The US Gender Pay Gap in the 1990s: Slowing Convergence” NBER working paper no. 10853 Cambridge, Mass: National Bureau of Economic Research. [Google Scholar]
- Boushey Heather. 2005. “Are Women Opting Out? Debunking the Myth.” Briefing Paper no. 2005–111-2. Washington, D.C.: Center for Economic and Policy Research. Accessed April 4, 2016 http://www.cepr.net/documents/publications/opt_out_2005_11_2.pdf. [Google Scholar]
- Buchmann Claudia, and Anne McDaniel. 2016. “Motherhood and the Wages of Women in Professional Occupations.” RSF: The Russell Sage Journal of the Social Sciences 2(4). doi: 10.7758/RSF.2016.2.4.05. [DOI] [PMC free article] [PubMed] [Google Scholar]
- Byker Tanya. 2016. “Paid Parental Leave Laws in the United States: Does Short-Duration Leave Affect Women’s Labor-Force Attachment?” American Economic Review 106(5): 242–46. [DOI] [PMC free article] [PubMed] [Google Scholar]
- Goldin Claudia. 2006. “The Quiet Revolution that Transformed Women’s Employment, Education and Family.” American Economic Review 96(2): 1–21. [Google Scholar]
- Goldin Claudia. 2014. “A Grand Gender Convergence: Its Last Chapter.” American Economic Review 104(4): 1091–119. [Google Scholar]
- Goldin Claudia, Katz Lawrence F., and Kuziemko Ilyana. 2006. “The Homecoming of American College Women: The Reversal of the College Gender Gap.” Journal of Economic Perspectives 20(4): 133–56. [Google Scholar]
- Herr Jane Leber, and Wolfram Catherine. 2012. “Opt-Out Rates at Motherhood Across High-Education Career Paths.” Industrial and Labor Relations Review 65(4): 928–50. [Google Scholar]
- Hotchkiss Julie, and Melinda Pitts M 2003. “ At What Level of Labor-Market Intermittency Are Women Penalized?” American Economic Review 93( 2): 233–37. [Google Scholar]
- Jacobson Louis S., Robert LaLonde, and Daniel G. Sullivan. 1993. “Earnings Losses of Displaced Workers.” American Economic Review 83(4): 685–709. [Google Scholar]
- King Miriam, Ruggles Steven J, Alexander Trent, Sarah Flood, Katie Genadek, Matthew B Schroeder, Brandon Trampe, and Rebecca Vick. 2010. Integrated Public Use Microdata Series, Current Population Survey: Version 3.0. [Machine-readable database]. Minneapolis: University of Minnesota. [Google Scholar]
- Mincer Jacob, and Polachek Solomon. 1974. “Family Investments in Human Capital: Earnings of Women.” Journal of Political Economy 82(2): S76–S108. [Google Scholar]
- Pal Ipshita, and Waldfogel Jane. 2016. “The Family Gap in Pay: New Evidence for 1967 to 2013.” RSF: The Russell Sage Journal of the Social Sciences 2(4). doi: 10.7758/RSF.2016.2.4.04. [DOI] [Google Scholar]
- Percheski Christine. 2008. “Opting Out? Cohort Differences in Professional Women’s Employment Rates from 1960 to 2005.” American Sociological Review 73(3): 497–517. [Google Scholar]
- Ruggles Steven J., Alexander Trent, Genadek Katie, Goeken Ronald, Schroeder Matthew B., and Sobek Matthew. 2010. Integrated Public Use Microdata Series: Version 5.0 [Machine-readable database]. Minneapolis: University of Minnesota. [Google Scholar]
- Waldfogel Jane. 2001. “Family Medical Leave: Evidence from the 2000 Surveys.” Monthly Labor Review 124(9): 17–23. [Google Scholar]
- Wang Wendy, Parker Kim, and Taylor Paul. 2013. “Breadwinner Moms.” Washington, D.C.: Pew Research Center. [Google Scholar]
- Weeden Kim A., Cha Youngjoo, and Bucca Mauricio. 2016. “Long Work Hours, Part-Time Work, and Trends in the Gender Gap in Pay, the Motherhood Wage Penalty, and the Fatherhood Wage Premium.” RSF: The Russell Sage Journal of the Social Sciences 2(4). doi: 10.7758/RSF.2016.2.4.03. [DOI] [Google Scholar]
- Wood Robert G., Corcoran Mary, and Courant Paul. 1993. “Pay Differences Among the Highly Paid: The Male-Female Earnings Gap in Lawyers’ Salaries.” Journal of Labor Economics 11(3): 417–41. [Google Scholar]


