

Abstract
The behaviors that define autism spectrum disorders (ASDs) have been hypothesized to result from disordered communication within brain networks. Several groups have investigated this question using resting-state functional magnetic resonance imaging (RS-fMRI). However, the published findings to date have been inconsistent across laboratories. Prior RS-fMRI studies of ASD have employed conventional analysis techniques based on the assumption that intrinsic brain activity is exactly synchronous over widely separated parts of the brain. By relaxing the assumption of synchronicity and focusing, instead, on lags between time series, we have recently demonstrated highly reproducible patterns of temporally lagged activity in normal human adults. We refer to this analysis technique as resting-state lag analysis (RS-LA). Here, we report RS-LA as well as conventional analyses of RS-fMRI in adults with ASD and demographically matched controls. RS-LA analyses demonstrated significant group differences in rs-fMRI lag structure in frontopolar cortex, occipital cortex, and putamen. Moreover, the degree of abnormality in individuals was highly correlated with behavioral measures relevant to the diagnosis of ASD. In this sample, no significant group differences were observed using conventional RS-fMRI analysis techniques. Our results suggest that altered propagation of intrinsic activity may contribute to abnormal brain function in ASD.
Keywords: dynamics, neural communication, resting-state fMRI, systems
Introduction
Autism spectrum disorder (ASD) is a neurodevelopmental disorder characterized by impaired social interaction and communication, repetitive behaviors, and restricted interests. ASD currently affects ∼1% of the population, and its prevalence is rising ( Wingate and Baio 2014 ). Yet, the pathophysiology of ASD remains poorly understood. Several studies have sought to characterize disordered brain function in ASD using functional connectivity (FC) analysis of resting-state functional magnetic resonance imaging (RS-fMRI) ( Uddin et al. 2013 ). Resting-state functional connectivity (RS-FC) is contingent on the fact that intrinsic brain activity is temporally synchronous within functionally related systems ( Biswal et al. 1995 ; Buckner et al. 2011 ; Power et al. 2011 ; Thomas Yeo et al. 2011 ; Choi et al. 2012 ). Synchronicity of intrinsic activity is widely referred to as FC; the associated topographies are known as resting-state networks (RSNs) ( Beckmann et al. 2005 ; Fox and Raichle 2007 ; Biswal et al. 2010 ). RSNs recapitulate the topographies of fMRI responses to a wide variety of sensory, motor, and cognitive paradigms ( Cordes et al. 2000 ; Smith et al. 2009 ). However, implicit in conventional FC analyses is the assumption that intrinsic activity is exactly synchronous within RSNs. Thus, conventional analyses model RS-fMRI time series as a combination of network processes that evolve over time ( Beckmann et al. 2005 ; Cordes and Nandy 2006 ), but such analyses make no provision for the possibility that intrinsic activity may propagate from region to region.
We have recently described an alternative analysis technique, which explicitly focuses on apparent propagation in rs-fMRI data ( Mitra et al. 2014 , 2015 ; Yuste and Fairhall 2015 ). Using this technique (see Methods; Fig. 1 ), we previously demonstrated, in awake, normal humans, that the blood oxygen level dependent (BOLD) signal exhibits highly reproducible temporal lag patterns on a time scale of ∼1 s; some regions are systematically early with respect to the rest of brain, whereas other regions are systematically late ( Mitra et al. 2014 , 2015 ). We have also shown that the lag structure of RS-fMRI data is composed of multiple temporal sequences ( Mitra et al. 2015 ) and that lag structure can be focally altered by experimental manipulations of behavioral state ( Mitra et al. 2014 ). We operationally infer apparent propagation on the basis of measured temporal lags, assuming nothing regarding the path or mechanism by which BOLD signals “propagate” between regions. In particular, the temporal scale of this phenomenology is much slower than axonal transmission via fiber tracts ( Caminiti et al. 2009 ). With this understanding, we omit “apparent” in future references to BOLD signal propagation.
Figure 1.
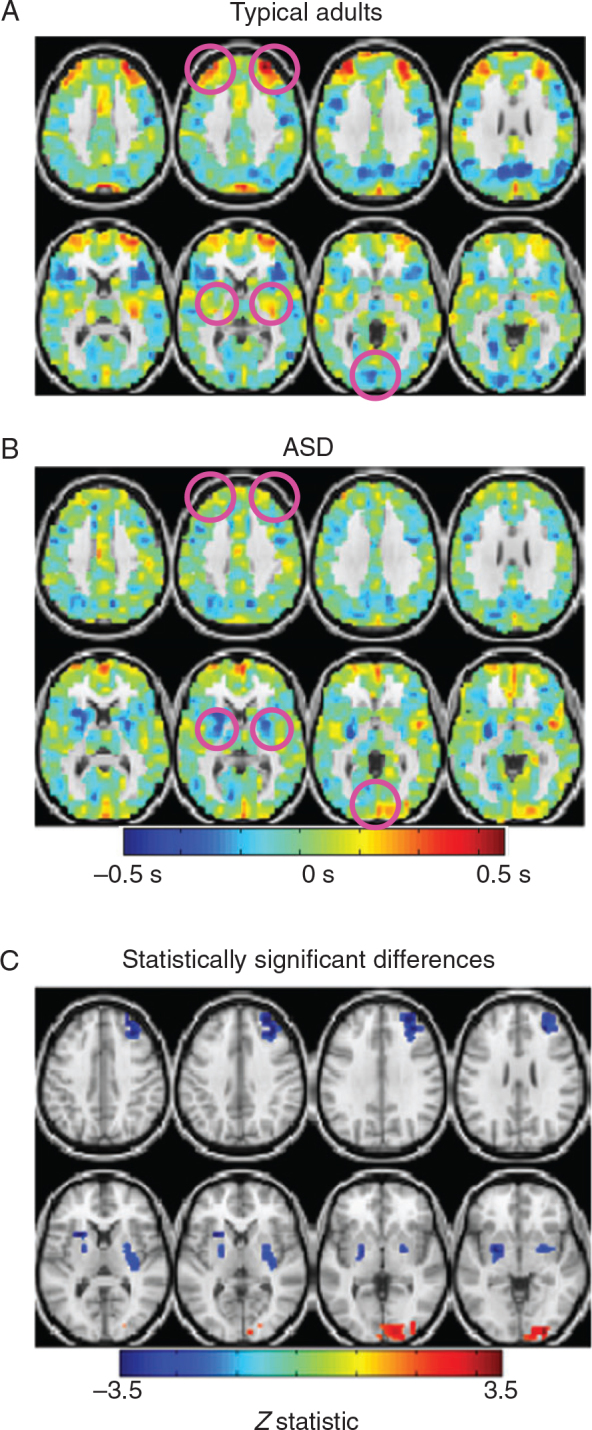
Lag maps reveal focal differences in ASD. ( A ) Group-level lag map in typical adults. Blue hues represent regions that are early with respect to the rest of the brain (negative seconds); red hues represent areas that are late with respect to the rest of the brain (positive seconds). Apparent propagation in the BOLD signal is measured on a time scale of ±0.5 s. ( B ) Group-level lag map in high-functioning adults with ASD. ( C ) Lag difference map, ASD minus typical adults, masked to show spatial clusters exhibiting statistically significant differences (|Z| > 3, P < 0.05; see Methods). Areas with significantly different RS-LA values are in right frontopolar cortex, bilateral putamen, and predominantly right occipital cortex.
Here, we report RS-LA as well as conventional analyses of RS-fMRI data acquired in 23 high-functioning young adults with ASD. Control data were acquired in 23 demographically matched typically developing (TD) individuals. Group comparisons revealed focally altered lag differences in frontopolar cortex, occipital cortex, and putamen. Moreover, these ASD vs. TD differences strongly correlated with behavioral measures relevant to the diagnosis of ASD.
Methods
Participants
A total of 54 right-handed participants (28 high-functioning ASD individuals and 26 typically developing [TD] control subjects) were enrolled. Exclusion criteria included history of brain trauma or seizures and/or severe hearing/visual/physical disabilities. All ASD probands were verbal, and their diagnoses were established using: 1) developmental history obtained by expert an clinician; 2) parent-report ratings of current symptom burden using the Social Responsiveness Scale (SRS) ( Constantino and Gruber 2012 )—this was obtained on all subjects in the study including TD participants, as a measure of quantitative variation in autistic social impairment, ranging from subtle, subclinical autistic-like traits to clinical-level symptomatology; 3) Autism Diagnostic Observation Schedule (ADOS [ Gotham et al. 2009 ], obtained for all ASD subjects by trained, research certified raters); and 4) expert clinician diagnosis according to DSM-IV, derived from the information gathered in 1–3. Nineteen of the 23 ASD subjects used in the final analysis (see below) additionally had a standardized developmental history acquired using the Autism Diagnostic Interview—Revised (ADI-R, [ Rutter et al. 2003 ])—in all cases these assessments agreed with expert clinician diagnosis of an autism spectrum disorder (ASD). For the purposes of this study, we define “verbal” as operationalized by the Clinical Evaluation of Language Fundamentals (CELF) questionnaire (see Table 1 ). All non-ASD subjects were recruited from the community; they underwent full diagnostic screening to confirm non-ASD status if their SRS score was >60T. Several subjects were excluded due to rigorous limits on head-motion-related artifact (see Additional fMRI Data Preprocessing). The final dataset upon which all subsequent analyses were based consists of the data from a total of 46 subjects: 23 high-functioning ASD and 23 TD controls, described in Table 1 . All experimental protocols were approved by the Human Research Protection Office at Washington University School of Medicine.
Table 1.
Demographic and behavioral characterization of study participants
| Autism | Control | P | |
|---|---|---|---|
| Sample size | 23 | 23 | — |
| Gender | 4 females, 19 males | 6 females, 17 males | 0.49 |
| Age at scan | 18.5 ± 3.0 | 18.8 ± 2.3 | 0.70 |
| Full-scale IQ | 103.9 ± 16.6 | — | — |
| ADOS communication + social interaction | 11.3 ± 4.5 | — | — |
| CELF core language score | 112.4 ± 10.9 | 115.5 ± 5.3 | 0.38 |
| CELF receptive language index | 102.4 ± 12.0 | 108.0 ± 9.0 | 0.16 |
| CELF expressive language index | 109.3 ± 11.8 | 113.6 ± 7.1 | 0.34 |
| SRS total | 90.1 ± 23.1 | 14.1 ± 10.3 | 3.9 × 10 −18 |
| SRS social communication and interaction | 74.5 ± 18.0 | 12.2 ± 9.8 | 2.0 × 10 −18 |
| SRS-restricted interests and repetitive behavior | 15.9 ± 6.8 | 1.9 ± 2.0 | 3.3 × 10 −12 |
| ABCL/CBCL attention problems | 9.8 ± 4.4 | 2.3 ± 2.2 | 5.3 × 10 −9 |
| ADI-R (collected in 19/23 subjects) | AGRE classification scheme: 13/19 classified with “strict Autism”, 6/19 classified as “broad spectrum” | — | — |
Note: Autism Genetic Resource Exchange (AGRE) guidelines used to classify ADI-R.
fMRI Data Acquisition
All imaging was performed with a 3T Siemens Tim Trio equipped with the standard 12-channel head coil and product sequences. Each subject provided 2 or 3 6-min resting-state fMRI runs (32 contiguous slices, 4 × 4 × 4 mm voxels, TE 27 ms, TR 2.2 s, 164 volumes) depending on tolerance. Subjects were instructed to simply lie still with their eyes closed and remain awake. Maintained wakefulness was confirmed by verbal inquiry immediately after each fMRI run. Structural imaging included 1 T1-weighted MP-RAGE (160 slices, 1 × 1 × 1 mm voxels) and 1 T2-weighted fast spin-echo (coverage and resolution matched to the fMRI).
Initial fMRI Data Preprocessing
Initial preprocessing generally followed our previously described pipeline ( Shulman et al. 2010 ). Briefly, this pipeline includes correction for asynchronous slice timing, realignment to correct for head movement within and across fMRI runs, and intensity scaling to achieve a whole-brain mode value of 1000. fMRI image distortions were corrected using the FUGUE module in FSL ( Jenkinson et al. 2012 ). Since field maps were not acquired in individuals, field maps were approximated using the technique described by Gholipour et al. (2008 ). Distortion correction and motion correction were combined in one resampling step to generate volumetric time series in Talairach atlas space (3-mm cubic voxels).
Additional fMRI Data Preprocessing
Additional preprocessing in preparation for RS-FC and RS-LA analyses included frame censoring and de-noising. Frame censoring was computed using the DVARS measure ( Smyser et al. 2010 ; Power et al. 2012 ). It has recently been shown that de-noising can lead to “cosmetic” improvements, that is, frames with improved DVARS values harboring retained artifact ( Power et al. 2014 ). Therefore, frame censoring was computed before de-noising. Data from subjects with <150 retained frames were not further analyzed. The fraction of censored frames in the analyzed data was 27.1% ± 13.4% and 23.2% ± 15.8%, respectively, ASD and TD groups. There was no statistically significant difference in the mean DVARS values post-censoring between the TD and ASD groups ( Supplementary Fig. S1 ). The retained frames were voxel-wise-made zero-mean but not otherwise temporally or spatially filtered. De-noising then proceeded using a combination of strategies similar to those previously described by others ( Behzadi et al. 2007 ; Bianciardi et al. 2009 ; Giove et al. 2009 ; Chai et al. 2012 ). Nuisance regressors were derived from white matter and ventricle masks, segmented in each individual using FreeSurfer ( Fischl 2012 ), and spatially resampled in register with the functional data. In greater detail, the FreeSurfer-derived masks were subdivided into cubes (5 or 3 voxels per side in white matter or ventricles) from which multiple time series were extracted; these time series then were orthogonalized and dimensionality-reduced using singular value decomposition (SVD). The number of retained regressors was determined in a data-dependent manner (covariance matrix condition number <50). Time series were also extracted from noisy (temporal s.d. >2.5% relative to the whole-brain mode) voxels in the extra-axial space (excluding the eyes) and similarly dimensionality-reduced using SVD. The mean number of nuisance regressors derived from white matter, ventricles, and the extra-axial space was, respectively, 8, 5, and 15. The final set of nuisance regressors also included the 6 parameters derived from rigid body head-motion correction, the global signal (GS) averaged over the (FreeSurfer-segmented) brain, and the GS temporal derivative.
Resting-State Functional Connectivity Analysis (RS-FC)
Conventional RS-FC was computed in terms of voxel pairs. Voxels were defined by dividing the gray matter mask in atlas space into 6526 (6 mm) 3 cubic regions of interest restricted to gray matter with full brain coverage, including the cerebellum ( Mitra et al. 2015 ). Each voxel was assigned to 1 of 7 resting-state networks ( Hacker et al. 2013 ). Only the 1065 voxels with over a 95% probability of belonging to one of these networks are shown in the correlation matrices. A map of the voxels and their network assignments is shown in Supplementary Figure S2 . Functional connectivity was conventionally assessed in terms of Pearson correlations between time series extracted from voxel pairs.
Resting-State Lag Analysis (RS-LA)
Our method for computing lags between time series has been previously published ( Mitra et al. 2014 ). Conventional seed-based correlation analysis involves computation of the Pearson correlation, r , between the time series, extracted from a seed region, and a second time series, extracted from some other locus [single voxel or region of interest (ROI)]. Thus,
| (1) |
where and are the temporal standard deviations of signals and and is the interval of integration. Here, we generalize the assumption of exact temporal synchrony and compute lagged cross-covariance functions. Thus,
| (2) |
where is the lag (in units of time). The value of at which exhibits an extremum defines the temporal lag (equivalently, delay) between signals and ( Konig 1994 ). Although cross-covariance functions can exhibit multiple extrema in the analysis of periodic signals, BOLD time series are aperiodic ( Maxim et al. 2005 ; He et al. 2010 ) and almost always give rise to lagged cross-covariance functions with a single, well-defined extremum, typically in the range ±1 s. We determine the extremum abscissa and ordinate using parabolic interpolation ( Mitra et al. 2014 ).
Given a set of n time series, extracted from n voxels, finding all corresponding to the extrema, of yields the antisymmetric, time-delay matrix:
| (3) |
The diagonal entries of are necessarily zero, as any time series has zero lag with itself. Moreover, since time series preceding implies that follows by the same interval. The voxels used are the (6 mm) 3 cubic regions described in the RS-FC methodology ( Mitra et al. 2015 ).
We projected the multivariate data represented in the matrix onto one-dimensional maps using the technique described by Nikolic and colleagues ( Schneider et al. 2006 ; Nikolic 2007 ). We refer to these one-dimensional maps as lag projections. Operationally, the projection is computed as the mean across the columns of (eq . 3), that is,
| (4) |
Group-level lag projections were obtained by computing each lag projections individually (averaging across temporally contiguous epochs) and then averaging.
Statistical Analysis
Pearson correlations were Fisher z -transformed prior to statistical significance testing. Statistical significance of ASD vs. TD differences in spatial maps derived using both RS-LA and RS-FC was assessed on a cluster-wise basis using threshold-extent criteria computed by extensive permutation resampling ( Hayasaka and Nichols 2003 ; Hacker et al. 2012 ). This nonparametric approach to significance testing applies equally well to RS-LA maps and conventional results obtained by seed-based RS-FC. In Figure 2 , two-sample t -tests were applied to compute the statistical significance of correlations between lag values and behavioral measures. Lag values extracted from 3 regions were correlated against 2 behavioral measures in 2 subpopulations (ASD and typical adults). Thus, P -values in Figure 2 were corrected for 3·2·2 = 12 multiple comparisons.
Figure 2.

Lag in right frontopolar and putamen regions of interest exhibit a significant correlation with behavioral scores. ( A ) Lag values in individuals with ASD averaged over the frontopolar ROI derived from Figure 1C negatively correlate with attention problem scores. This result implies that earlier (more negative) lag values in right frontopolar cortex are associated with higher levels of attention deficit in ASD. Female data points are circled. ( B ) Lag values in individuals from the entire cohort averaged over the right frontopolar ROI negatively correlate with attention problem scores. Dark blue points represent TD subjects; light blue represents ASD. ( C ) Lag values in individuals with ASD averaged over the putamen ROI derived from Figure 1C negatively correlate with SRS-restricted interest and repetitive behavior scores. This result implies that earlier (more negative) lag values in putamen are associated with higher levels ASD-related deficit. Female data points are circled. ( D ) Lag values in individuals from the entire cohort averaged over the putamen ROI negatively correlate with SRS-restricted interest and repetitive behavior scores. Colors as in ( B ). All P -values have been multiple comparisons corrected (see Methods). P -values are not shown for the scatter plots in ( B , D ) as these regions were selected on the basis of distinguishing between ASD and TD and are therefore required to exhibit high correlation with behavioral measures, which also distinguish between ASD and TD individuals. However, the continuous distribution of lag values and behavioral scores in ( B , D ) is informative. This caveat does not apply to the P -values reported in ( A , C ).
Results
Resting-State Lag Analysis
Figure 1 shows lag projection maps in typical young adults (Fig. 1A ) and high-functioning young adults with ASD (Fig. 1B ). Lag projection maps show whether a voxel is, on average, early (blue) or late (red) compared with the rest of the brain (see Methods). Statistically significant lag differences were identified in right frontopolar cortex, predominantly right occipital cortex, and bilateral putamen (Fig. 1C ). Frontopolar cortex is a late structure in typical adults ( Mitra et al. 2014 ) (red hues in Fig. 1A ) but not in the ASD cohort (Fig. 1B ). Although the frontopolar lag effect was statistically significant only in the right hemisphere, a similar finding was present also in the left hemisphere. Occipital cortex is early in typical adults (Fig. 1A ) but late in the ASD cohort (Fig. 1B ), especially in the right hemisphere. Finally, RS-LA values in putamen are near zero in typical adults (Fig. 1A ) but significantly negative (early) in the ASD cohort (Fig. 1B ). These results can be summarized as follows: 1) frontopolar cortex is late with respect to the rest of the brain in typical adults but not ASD; 2) occipital cortex is early in typical adults but late in ASD; 3) putamen is a mid-latency (lag values near zero) in typical adults, but very early in ASD.
Having identified focal regions of altered propagated intrinsic activity in ASD, we asked whether individual differences in lag maps correlate with behavioral measures. Frontopolar cortex has been variably assigned to the frontoparietal control network (FPC) or the ventral attention network (VAN) ( Dosenbach et al. 2007 ; Shulman et al. 2010 ; Hacker et al. 2013 ). Both the FPC and the VAN are associated with allocation of attentional resources. Accordingly, we tested the relationship between frontopolar cortex lag (Fig. 2C ) and attention problem scores, as measured by the adult behavior checklist (ABCL) or childhood behavior checklist (CBCL), depending on the age of the participant. Lag values in right frontopolar cortex were strongly anticorrelated with attention problem scores within the ASD cohort (Fig. 2A ). Thus, relative earliness in frontopolar cortex was associated with attentional deficits. The same relationship was observed across all participants (ASD + TD) (Fig. 2B ). Occipital cortex lag and putamen lag each exhibited weaker, nonsignificant correlations with attention problem scores in the ASD cohort ( r = 0.08, P = 0.72; r = −0.12, P = 0.58, respectively). Thus, the relation between attention problem scores and lag is spatially restricted to frontopolar cortex.
The putamen is associated with abnormal motor behaviors in ASD ( Hollander et al. 2005 ; Langen et al. 2007 ). Accordingly, we examined putamen lag in relation to the SRS-restricted interest and repetitive behavior score. Putamen lag values were significantly anticorrelated with this measure in the ASD group (Fig. 2C ). The same relation was observed when comparing across typical adults and adults with ASD (Fig. 2D ). Figure 1 demonstrates that putamen is an abnormally early in ASD. Therefore, these data suggest that individuals in whom putamen is a stronger source of propagated intrinsic activity are more likely to exhibit repetitive behaviors and restricted interests. Occipital cortex lag and frontopolar cortex lag each exhibited weaker, nonsignificant relationships with SRS-restricted interest and repetitive behavior scores in our ASD cohort ( r = 0.35, P = 0.10; r = −0.15, P = 0.49, respectively). Thus, the relation between repetitive behavior score and lag is spatially restricted to the putamen.
The behavioral correlates of occipital lag abnormalities in ASD are not clear. One possibility is altered performance in visual perceptual tasks ( Belmonte and Yurgelun-Todd 2003 ). However, as such measures were not available in this cohort, we did not identify a behavioral correlate of the occipital lag effect.
Since the manifestations of ASD may differ in females versus males ( Baron-Cohen 2002 ; Baron-Cohen et al. 2005 ), we performed several control analyses to check that gender was not responsible for the effects described earlier. First, we repeated the analysis in Figure 2 using lag maps derived from only males, in both the TD and ASD groups ( Supplementary Fig. S3 ). Statistically significant lag differences were again found in right frontopolar cortex and predominantly right occipital cortex. The main consequence of limiting the analysis to males was loss of statistical significance in left putamen attributable to the reduced population size. Next, we regressed gender out of the results shown in Figure 2A , C and obtained the following correlations: (2A) r = −0.51, (2C) r = −0.56. Each of these results is statistically significant ( P < 0.05) after regressing out the effects of gender. The distributions of data points representing females in the scatter plots (circled in Fig. 2A , C ) also show that gender is not responsible for the observed correlations.
Resting-State Functional Connectivity
Conventional RS-FC, computed using (6 mm) 3 cubic gray matter voxels, ordered by network affiliation (see Methods and Supplementary Fig. S2 ), are shown in Figure 3 . Visual inspection reveals little difference between RS-FC in typical adults and high-functioning adults with ASD (Fig. 3A ). To quantitatively test for ASD versus TD group differences, we computed mean intra-RSN RS-FC correlations (mean Pearson r values collapsed over diagonal blocks). Figure 3B shows minimal differences between typical adults and ASD. The largest difference was observed in the language network ( P = 0.02, two-sided t -test). However, even this effect was not statistically significant after correction for multiple comparisons (7 comparisons). To examine whole-brain zero-lag correlation effects at the group level, the 6526 × 6526 correlation matrices computed in the TD and ASD groups were differenced. We then applied principal components analysis (PCA) to the correlation difference matrix. If a detectable group difference is present, then one or more principal components (PCs) will exceed the fraction of variance explained by the 95th percentile of the null-distribution (computed through permutation re-sampling across groups; see Fig. 3C caption). However, Figure 3C demonstrates that no principal components met this criterion. Thus, we did not find a detectable group difference in zero-lag correlation structure. For comparison, we applied the same approach to the difference time-delay matrix computed between groups ( Supplementary Fig. S4 ) and found 1 significant principal component ( Supplementary Fig. S4 A ). The topography of the principal component ( Supplementary Fig. S4 B ) includes the same regions found by the cluster-level significance analysis (Fig. 1C ).
Figure 3.

Functional connectivity analysis reveals no statistically significant differences between typical adults and high-functioning adults with ASD. ( A ) Correlation matrices depicting FC in 7 networks in typical adults and ASD. The networks are as follows: dorsal attention network (DAN), VAN, somatomotor network (SMN), visual network (VIS), FPC, language network (LAN), and default mode network (DMN). Correlations are shown using regions of interest (see Methods) sorted by network affiliation (see Methods, Supplementary Fig. S2 ). ( B ) Mean intranetwork correlation is shown for each network in each population. Blue represents typical adults; red represents high-functioning adults with ASD. FC in the language network is lower in ASD, but the P -value of this effect ( P = 0.02) does not survive correction for multiple comparisons (7 networks = 7 comparisons). ( C ) Eigenspectrum derived from applying PCA to the difference correlation matrix (ASD minus TD), computed over the whole brain (6526 voxels). The eigenspectrum shows the percent variance, of the difference correlation matrix, accounted for by each principal component (PC). Nonzero eigenvalues are generated by noise even in the absence of a true group difference. Statistical significance therefore is assessed by permutation resampling across groups to compute the null-distribution corresponding to chance. PCs whose variance explained exceeds the 95th percentile of the null-distribution (red line) are statistically significant. Thus, there are no statistically significant PCs in the present data.
Finally, we also computed conventional voxel-wise correlation maps using as seeds the voxels identified by RS-LA (Fig. 1C ) to determine whether RS-FC is altered in right frontopolar cortex, occipital cortex, and putamen (Fig. 4 ). No statistically significant group differences were found using the same cluster-oriented statistical methodology represented in Figure 1C . The minimum effect size our sample was powered to detect was a Pearson r difference of 0.08 in a cluster of at least 95 voxels. We note that the present null finding does not exclude the possibility that significant ASD versus TD differences in conventional FC might be demonstrated with larger cohorts.
Figure 4.
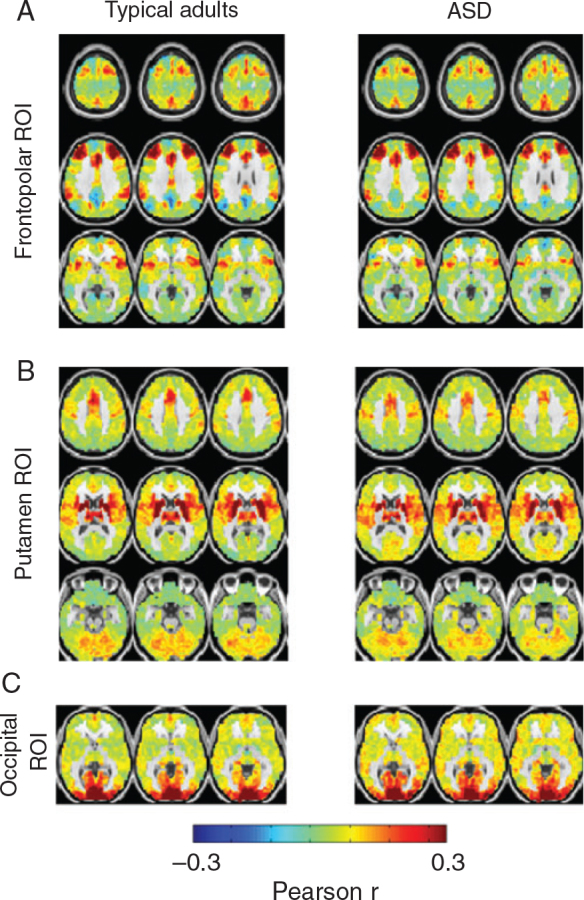
There are no significant differences in whole-brain FC in regions exhibiting significant lag effects. Shown are voxel-wise FC maps in TD adults and high-functioning adults with ASD. Seed regions of interest were derived by RS-LA as illustrated in Figure 1C : right frontopolar cortex ( A ), bilateral putamen ( B ), and occipital cortex ( C ). No statistically significant TD versus ASD differences were observed using criteria derived by permutation resampling at the cluster level.
Discussion
Summary of Present Findings
We applied a recently described resting-state lag analysis (RS-LA) technique ( Mitra et al. 2014 ) to study patterns of propagated intrinsic RS-fMRI activity in typically developing (TD) adults and high-functioning adults with ASD. We found focal differences in right frontopolar cortex, occipital cortex (predominantly in the right hemisphere), and putamen bilaterally. Differences in RS-LA correlated with behavioral scores. RS-LA effects in frontopolar cortex and putamen specifically correlated, respectively, with deficits in attention and repetitive motor behaviors. In contrast, we found no statistically significant differences in the topography or magnitude of conventionally assessed resting-state FC. Our results suggest that abnormal brain function in ASD manifests more robustly as alterations in the lag structure of intrinsic activity (RS-LA) than in changes in the zero-lag correlations of intrinsic activity (RS-FC). Importantly, since the changes in lag are small (∼500 ms; Fig. 2 ) in comparison with the temporal scale of BOLD fMRI fluctuations, alterations in the lag structure of intrinsic activity can occur independently of changes in conventional FC (Fig. 4 ).
Resting-State Functional Connectivity (RS-FC)
It is widely believed that altered brain circuitry underlies the behavioral manifestations of ASD ( Courchesne and Pierce 2005 ; Geschwind and Levitt 2007 ; Just et al. 2012 ; Stevenson et al. 2014 ). Resting-state functional neuroimaging has been used to investigate this hypothesis, but the results have been variable and often contradictory ( Deen and Pelphrey 2012 ; Di Martino et al. 2013 ; Tyszka et al. 2013 ; Uddin et al. 2013 ). Phenotypic heterogeneity in ASD undoubtedly contributes to variability in reported fMRI findings. However, and just as importantly, head motion has been, until recently, an underappreciated source of artifact in resting-state fMRI studies ( Power et al. 2012 , 2014 ). The most consistently reported finding in ASD has been reduced long-distance FC ( Courchesne and Pierce 2005 ; Cherkassky et al. 2006 ; Just et al. 2007 , 2012 ; Assaf et al. 2010 ; Rudie et al. 2012 ; Washington et al. 2014 ). However, most of these reports antedate clear demonstrations that head-motion introduces artifacts in RS-fMRI that reduce long-distance FC ( Deen and Pelphrey 2012 ; Power et al. 2012 , 2014 ). More recent work, incorporating appropriate controls for head motion, has found largely typical patterns of RS-FC in high-functioning adults with ASD ( Deen and Pelphrey 2012 ; Redcay et al. 2013 ; Tyszka et al. 2013 ) although there persists disagreement on this point ( Di Martino et al. 2013 ). The present work applies frame censoring and extensive de-noising to minimize artifacts. Our RS-FC results reveal no statistically significant, large-scale group differences in conventional RS-FC (Figs 3 and 4 ). These results do not necessarily establish that there are no differences, only that the effect size of these differences must be smaller than the present study is powered to detect. However, our results do indicate that RS-FC differences attributable to ASD, if they exist, are relatively subtle. Additionally, similar RS-FC between groups implies that the quality of the RS-fMRI data is comparable in the ASD and TD samples.
Resting-State Lag Analysis (RS-LA)
RS-LA revealed highly significant, focal differences in RS-fMRI lag structure in ASD. The interpretation of this result relies on the physiology underlying patterns of temporal lag in intrinsic activity. Apparent propagation of low-frequency (<1 Hz) spontaneous activity over 100s of milliseconds, inferred on the basis of temporal lag, has been extensively described in the rodent brain using various modalities, including whole cell recordings ( Hahn et al. 2006 ), local field potentials ( Sirota et al. 2003 ; Luczak et al. 2007 ; Sheroziya and Timofeev 2014 ), voltage sensitive dyes ( Ferezou et al. 2007 ; Mohajerani et al. 2010 , 2013 ), and calcium imaging ( Stroh et al. 2013 ). The mechanisms underlying slow propagation of intrinsic activity are still not well understood; potential mechanisms include balance in excitatory:inhibitory activity ( Sheroziya and Timofeev 2014 ) as well as astrocytic signaling ( Cossart et al. 2003 ). Despite the wealth of evidence across modalities demonstrating slow apparent propagation of low-frequency activity, concern lingers that regional variations in the latency of neurovascular coupling could largely account for the lag structure of RS-fMRI ( Handwerker et al. 2004 ; Friston 2009 ). Although vascular and neuronal contributions to observed lag structure cannot be separated on the basis of the BOLD signal alone, we can adjudicate between a primarily neuronal versus primarily vascular explanation for observed lag structure differences by considering the plausibility of each of these explanations in the context of past and present results.
First, we have previously reported focal task-related changes in resting-state lag structure by comparing resting-state activity before and after task blocks ( Mitra et al. 2014 ). A vascular explanation for this result implies focal changes in the dynamics of neurovascular coupling over many minutes. There is no evidence for such focal “vascular memory”. On the other hand, it is highly plausible that task performance leaves a neural trace which manifests as altered propagation of intrinsic activity. In fact, such traces must underlie episodic memory and skill acquisition ( Albert et al. 2009 ; Holleman and Battaglia 2015 ).
Second, let us suppose that regional differences in neurovascular coupling delays do exist. We further assume that neural processes are effectively simultaneous, neglecting axonal conduction delays on the order of tens of milliseconds ( Vicente et al. 2008 ). Then, RS-fMRI lag structure hypothetically could arise because some regions transduce neural activity into a BOLD signal before other regions. These regional differences in neurovascular coupling kinetics can be expressed as a lag map. Importantly, if the entirety of RS-fMRI lag structure were attributable to a single set of regionally dependent neurovascular coupling delays, the dimensionality of RS-fMRI lag structure would be exactly 1 [for mathematical proof, see appendix in Mitra et al. [2014 ]). However, we have recently shown that RS-fMRI lag structure has high-dimensionality and consists of multiple temporally lagged processes ( Mitra et al. 2015 ). This result demonstrates that hemodynamic factors cannot account for the entirety of RS-fMRI lag structure (for further discussion of dimensionality and lag structure as it relates to hemodynamics, please see Mitra et al. [2015 ]).
Finally, our results demonstrate focal group differences in RS-fMRI lag structure that correlate with behavioral measures (Fig. 2 ). A primarily vascular explanation for this finding would suggest that there are differences in neurovascular dynamics between ASD versus TD individuals and that the extent of these vascular differences is related to behavior. However, as far as we are aware, there have been no reports of focally altered neurovascular dynamics in ASD. In fact, BOLD fMRI responses have been reported to be largely identical in individuals with simplex ASD and age-matched TD adolescents ( Feczko et al. 2012 ). In contrast, a neuronal explanation suggests that neuronal communication is altered in ASD versus TD adults, a hypothesis that has been widely articulated ( Geschwind and Levitt 2007 ). Therefore, we believe that focal differences in RS-fMRI lag structure in ASD are more likely to represent alterations in the apparent propagation of intrinsic activity as opposed to differences in neurovascular coupling. Future direct tests combining other modalities with fMRI will be necessary to definitely test this perspective.
The regions identified in this study, frontopolar cortex, putamen, and occipital cortex, have previously been reported as areas that may contribute to the behavioral symptoms of ASD. The frontopolar regions are nodes of the VAN, as defined by some reports ( Fox et al. 2006 ; Hacker et al. 2013 ). Other schemes assign these regions to the FPC ( Dosenbach et al. 2007 ; Vincent et al. 2008 ); both networks are involved in the regulation of attention. The ventral attention system is recruited by the orienting response ( Corbetta and Shulman 2002 ; Bressler et al. 2008 ). Selective attention is impaired in ASD ( Ciesielski et al. 1990 ; Burack 1994 ; Belmonte and Yurgelun-Todd 2003 ); this deficit has previously been attributed to prefrontal areas, including the frontopolar cortex, on the basis of aberrant cortical organization ( Casanova et al. 2002 ; Stoner et al. 2014 ), genetics ( Geschwind and Levitt 2007 ), and neuroimaging ( Courchesne and Pierce 2005 ; Just et al. 2007 , 2012 ). Our data suggest that the network affiliation of frontopolar cortex, as determined by RS-FC, is unaltered in ASD (Fig. 4A ) but that this region does not play its normal role as a destination for propagated intrinsic activity (Fig. 1 ). The relationship between frontopolar lag and attention deficits (Fig. 2A , B ) suggests that the status of this region as late with respect to the rest of the brain (positive lag values) underlies this region's attention-related functions. Individuals in whom frontopolar cortex is not a destination of intrinsic activity (less positive values in Fig. 2A , B ) have, in general, higher attention problem scores. The ASD versus TD lag difference in frontopolar cortex is bilateral but stronger (and statistically significant) in the right hemisphere (Fig. 1 ). This lateralization may be related to the fact that the VAN is right lateralized in typical subjects ( Fox et al. 2006 ; Shulman et al. 2010 ).
Repetitive behaviors have been associated with striatum across a range of neuropsychiatric disorders, including obsessive-compulsive disorder ( Rauch et al. 1997 ), schizophrenia ( Meyer-Lindenberg et al. 2002 ), Tourette syndrome ( Saka and Graybiel 2003 ), and ASD ( Sears et al. 1999 ; Hollander et al. 2005 ). Several studies have reported increased striatal volume in ASD, including in the putamen, independent of whole-brain volume ( Hollander et al. 2005 ; Haznedar et al. 2006 ; Rojas et al. 2006 ; Langen et al. 2007 ), although at least one study did not find this effect ( Gaffney et al. 1989 ). In the present data, lag values in putamen were near zero in typical adults (Fig. 1 ), indicating that the putamen normally is a weak source of propagated intrinsic activity. In ASD, lag values in the putamen were strongly negative, indicating that putamen is a strong source of propagated intrinsic activity in ASD. More negative putaminal lag values in ASD were correlated with higher repetitive behavior scores (Fig. 2C , D ). This result suggests that increased RS-fMRI activity propagation from putamen is related to a more severe repetitive behavior phenotype.
Our analysis also revealed significant changes in occipital lag. The possible behavioral correlates of this finding are not clear. Diminished gaze fixation is one of the core features of autism ( Ozonoff et al. 2010 ; Jones and Klin 2013 ). Altered facial processing in ASD has been linked to aberrant function in occipital cortex, among other areas ( Pierce et al. 2001 ; Dalton et al. 2005 ). Differences in visual perceptual tasks, visual attention tasks, and visual receptive fields have also been reported in ASD ( Belmonte and Yurgelun-Todd 2003 ; Schwarzkopf et al. 2014 ). Thus, although occipital cortex may be relatively spared in ASD from the structural perspective ( Carper et al. 2002 ; Stoner et al. 2014 ), there exists clear evidence of altered neuronal function. Future directed studies are required to follow up on the present occipital findings.
On the Continuous Distribution of ASD-Related Traits
Abundant evidence suggests that autism represents extreme manifestations of behavioral traits that are continuously distributed within the human population ( Waterhouse et al. 1996 ; Constantino et al. 2000 , 2004 ; Spiker et al. 2002 ; Constantino and Todd 2003 ; Constantino 2011 ). The distributions of behavioral measures ( x -axes) shown in Figure. 2B , D support this principle. Importantly, the distributions of RS-LA values ( y -axes) also show no evidence of separable clusters (Fig. 2B , D ). This finding suggests that, along with behavioral traits, the underlying differences in neural function in ASD also represent one tail of a continuous distribution.
Limitations
One set of limitations of the present work arises from technical and interpretive aspects of RS-LA ( Mitra et al. 2014 ). Because of the need for dimensionality reduction, all present RS-LA analyses were conducted on (6 mm) 3 cubic voxels. Thus, the spatial resolution of RS-LA is somewhat limited in comparison with fMRI. Also, RS-LA is subject to lateness bias near large venous structures, for example, the superior sagittal sinus ( Mitra et al. 2014 ). However, such biases theoretically should not impact comparisons across groups. In particular, there is no reason to suppose that ASD is associated with altered venous anatomy.
Our investigation of the behavioral correlates of altered lag is limited to the behavioral measures collected in the present study. These measures were generic (e.g., SRS) and not designed to test RS-LA-driven hypotheses. More extensive behavioral testing for functions associated with frontopolar cortex, putamen, and occipital cortex are needed. Finally, the modest sample size of the present study limits our power to detect small TD versus ASD differences. However, our results do suggest that alterations in propagated intrinsic activity in ASD are more robust than alterations in conventional RS-FC. Therefore, we believe that RS-LA offers a promising avenue of investigation for better understanding the pathophysiology underlying ASD.
Supplementary Material
Supplementary material can be found at: http://www.cercor.oxfordjournals.org/
Funding
This work was supported by the National Institute of Health (NS080675 to M.E.R. and A.Z.S., P30NS048056 to A.Z.S., F30MH106253 to A.M.).
Supplementary Material
Notes
We thank Tyler Blazey and Yi Zhang for assistance in data preprocessing. Conflict of Interest: None declared.
References
- Albert NB , Robertson EM , Mehta P , Miall RC . 2009. . Resting state networks and memory consolidation . Commun Integr Biol . 2 : 530 – 532 . [DOI] [PMC free article] [PubMed] [Google Scholar]
- Assaf M , Jagannathan K , Calhoun VD , Miller L , Stevens MC , Sahl R , O'Boyle JG , Schultz RT , Pearlson GD . 2010. . Abnormal functional connectivity of default mode sub-networks in autism spectrum disorder patients . Neuroimage . 53 : 247 – 256 . [DOI] [PMC free article] [PubMed] [Google Scholar]
- Baron-Cohen S . 2002. . The extreme male brain theory of autism . Trends Cogn Sci . 6 : 248 – 254 . [DOI] [PubMed] [Google Scholar]
- Baron-Cohen S , Knickmeyer RC , Belmonte MK . 2005. . Sex differences in the brain: implications for explaining autism . Science . 310 : 819 – 823 . [DOI] [PubMed] [Google Scholar]
- Beckmann CF , DeLuca M , Devlin JT , Smith SM . 2005. . Investigations into resting-state connectivity using independent component analysis . Philos Trans R Soc Lond B Biol Sci . 360 : 1001 – 1013 . [DOI] [PMC free article] [PubMed] [Google Scholar]
- Behzadi Y , Restom K , Liau J , Liu TT . 2007. . A component based noise correction method (CompCor) for BOLD and perfusion based fMRI . NeuroImage . 37 : 90 – 101 . [DOI] [PMC free article] [PubMed] [Google Scholar]
- Belmonte MK , Yurgelun-Todd DA . 2003. . Functional anatomy of impaired selective attention and compensatory processing in autism . Brain Res Cogn Brain Res . 17 : 651 – 664 . [DOI] [PubMed] [Google Scholar]
- Bianciardi M , van Gelderen P , Duyn JH , Fukunaga M , de Zwart JA . 2009. . Making the most of fMRI at 7 T by suppressing spontaneous signal fluctuations . NeuroImage . 44 : 448 – 454 . [DOI] [PMC free article] [PubMed] [Google Scholar]
- Biswal B , Yetkin FZ , Haughton VM , Hyde JS . 1995. . Functional connectivity in the motor cortex of resting human brain using echo-planar MRI . Magn Reson Med . 34 : 537 – 541 . [DOI] [PubMed] [Google Scholar]
- Biswal BB , Mennes M , Zuo XN , Gohel S , Kelly C , Smith SM , Beckmann CF , Adelstein JS , Buckner RL , Colcombe S et al. . 2010. . Toward discovery science of human brain function . Proc Natl Acad Sci USA . 107 : 4734 – 4739 . [DOI] [PMC free article] [PubMed] [Google Scholar]
- Bressler SL , Tang W , Sylvester CM , Shulman GL , Corbetta M . 2008. . Top-down control of human visual cortex by frontal and parietal cortex in anticipatory visual spatial attention . J Neurosci . 28 : 10056 – 10061 . [DOI] [PMC free article] [PubMed] [Google Scholar]
- Buckner RL , Krienen FM , Castellanos A , Diaz JC , Yeo BT . 2011. . The organization of the human cerebellum estimated by intrinsic functional connectivity . J Neurophysiol . 106 : 2322 – 2345 . [DOI] [PMC free article] [PubMed] [Google Scholar]
- Burack JA . 1994. . Selective attention deficits in persons with autism: preliminary evidence of an inefficient attentional lens . J Abnorm Psychol . 103 : 535 – 543 . [DOI] [PubMed] [Google Scholar]
- Caminiti R , Ghaziri H , Galuske R , Hof PR , Innocenti GM . 2009. . Evolution amplified processing with temporally dispersed slow neuronal connectivity in primates . Proc Natl Acad Sci USA . 106 : 19551 – 19556 . [DOI] [PMC free article] [PubMed] [Google Scholar]
- Carper RA , Moses P , Tigue ZD , Courchesne E . 2002. . Cerebral lobes in autism: early hyperplasia and abnormal age effects . Neuroimage . 16 : 1038 – 1051 . [DOI] [PubMed] [Google Scholar]
- Casanova MF , Buxhoeveden DP , Brown C . 2002. . Clinical and macroscopic correlates of minicolumnar pathology in autism . J Child Neurol . 17 : 692 – 695 . [DOI] [PubMed] [Google Scholar]
- Chai XJ , Castanon AN , Ongur D , Whitfield-Gabrieli S . 2012. . Anticorrelations in resting state networks without global signal regression . NeuroImage . 59 : 1420 – 1428 . [DOI] [PMC free article] [PubMed] [Google Scholar]
- Cherkassky VL , Kana RK , Keller TA , Just MA . 2006. . Functional connectivity in a baseline resting-state network in autism . Neuroreport . 17 : 1687 – 1690 . [DOI] [PubMed] [Google Scholar]
- Choi EY , Yeo BT , Buckner RL . 2012. . The organization of the human striatum estimated by intrinsic functional connectivity . J Neurophysiol . 108 : 2242 – 2263 . [DOI] [PMC free article] [PubMed] [Google Scholar]
- Ciesielski KT , Courchesne E , Elmasian R . 1990. . Effects of focused selective attention tasks on event-related potentials in autistic and normal individuals . Electroencephalogr Clin Neurophysiol . 75 : 207 – 220 . [DOI] [PubMed] [Google Scholar]
- Constantino JN . 2011. . The quantitative nature of autistic social impairment . Pediatr Res . 69 : 55R - 62R . [DOI] [PMC free article] [PubMed] [Google Scholar]
- Constantino JN , Gruber CP . 2012. . The Social Responsiveness Scale-2 . Los Angeles: : Western Psychological Services; . [Google Scholar]
- Constantino JN , Gruber CP , Davis S , Hayes S , Passanante N , Przybeck T . 2004. . The factor structure of autistic traits . J Child Psychol Psychiatry . 45 : 719 – 726 . [DOI] [PubMed] [Google Scholar]
- Constantino JN , Przybeck T , Friesen D , Todd RD . 2000. . Reciprocal social behavior in children with and without pervasive developmental disorders . J Dev Behav Pediatr . 21 : 2 – 11 . [DOI] [PubMed] [Google Scholar]
- Constantino JN , Todd RD . 2003. . Autistic traits in the general population: a twin study . Arch Gen Psychiatry . 60 : 524 – 530 . [DOI] [PubMed] [Google Scholar]
- Corbetta M , Shulman GL . 2002. . Control of goal-directed and stimulus-driven attention in the brain . Nat Rev Neurosci . 3 : 201 – 215 . [DOI] [PubMed] [Google Scholar]
- Cordes D , Haughton VM , Arfanakis K , Wendt GJ , Turski PA , Moritz CH , Quigley MA , Meyerand ME . 2000. . Mapping functionally related regions of brain with functional connectivity MR imaging . AJNR Am J Neuroradiol . 21 : 1636 – 1644 . [PMC free article] [PubMed] [Google Scholar]
- Cordes D , Nandy RR . 2006. . Estimation of the intrinsic dimensionality of fMRI data . NeuroImage . 29 : 145 – 154 . [DOI] [PubMed] [Google Scholar]
- Cossart R , Aronov D , Yuste R . 2003. . Attractor dynamics of network UP states in the neocortex . Nature . 423 : 283 – 288 . [DOI] [PubMed] [Google Scholar]
- Courchesne E , Pierce K . 2005. . Why the frontal cortex in autism might be talking only to itself: local over-connectivity but long-distance disconnection . Curr Opin Neurobiol . 15 : 225 – 230 . [DOI] [PubMed] [Google Scholar]
- Dalton KM , Nacewicz BM , Johnstone T , Schaefer HS , Gernsbacher MA , Goldsmith HH , Alexander AL , Davidson RJ . 2005. . Gaze fixation and the neural circuitry of face processing in autism . Nat Neurosci . 8 : 519 – 526 . [DOI] [PMC free article] [PubMed] [Google Scholar]
- Deen B , Pelphrey K . 2012. . Perspective: Brain scans need a rethink . Nature . 491 : S20 . [DOI] [PubMed] [Google Scholar]
- Di Martino A , Yan CG , Li Q , Denio E , Castellanos FX , Alaerts K , Anderson JS , Assaf M , Bookheimer SY , Dapretto M et al. . 2013. . The autism brain imaging data exchange: towards a large-scale evaluation of the intrinsic brain architecture in autism . Mol Psychiatry . 19 : 659 – 667 . [DOI] [PMC free article] [PubMed] [Google Scholar]
- Dosenbach NU , Fair DA , Miezin FM , Cohen AL , Wenger KK , Dosenbach RA , Fox MD , Snyder AZ , Vincent JL , Raichle ME et al. . 2007. . Distinct brain networks for adaptive and stable task control in humans . Proc Natl Acad Sci USA . 104 : 11073 – 11078 . [DOI] [PMC free article] [PubMed] [Google Scholar]
- Feczko E , Miezin FM , Constantino JN , Schlaggar BL , Petersen SE , Pruett JR Jr . 2012. . The hemodynamic response in children with Simplex Autism . Dev Cogn Neurosci . 2 : 396 – 408 . [DOI] [PMC free article] [PubMed] [Google Scholar]
- Ferezou I , Haiss F , Gentet LJ , Aronoff R , Weber B , Petersen CC . 2007. . Spatiotemporal dynamics of cortical sensorimotor integration in behaving mice . Neuron . 56 : 907 – 923 . [DOI] [PubMed] [Google Scholar]
- Fischl B . 2012. . FreeSurfer . Neuroimage . 62 : 774 – 781 . [DOI] [PMC free article] [PubMed] [Google Scholar]
- Fox MD , Corbetta M , Snyder AZ , Vincent JL , Raichle ME . 2006. . Spontaneous neuronal activity distinguishes human dorsal and ventral attention systems . Proc Natl Acad Sci USA . 103 : 10046 – 10051 . [DOI] [PMC free article] [PubMed] [Google Scholar]
- Fox MD , Raichle ME . 2007. . Spontaneous fluctuations in brain activity observed with functional magnetic resonance imaging . Nat Rev Neurosci . 8 : 700 – 711 . [DOI] [PubMed] [Google Scholar]
- Friston K . 2009. . Causal modelling and brain connectivity in functional magnetic resonance imaging . PLoS Biol . 7 : e33 . [DOI] [PMC free article] [PubMed] [Google Scholar]
- Gaffney GR , Kuperman S , Tsai LY , Minchin S . 1989. . Forebrain structure in infantile autism . J Am Acad Child Adolesc Psychiatry . 28 : 534 – 537 . [DOI] [PubMed] [Google Scholar]
- Geschwind DH , Levitt P . 2007. . Autism spectrum disorders: developmental disconnection syndromes . Curr Opin Neurobiol . 17 : 103 – 111 . [DOI] [PubMed] [Google Scholar]
- Gholipour A , Kehtarnavaz N , Gopinath K , Briggs R , Panahi I . 2008. . Average field map image template for Echo-Planar image analysis . Conf Proc IEEE Eng Med Biol Soc . 2008 : 94 – 97 . [DOI] [PubMed] [Google Scholar]
- Giove F , Gili T , Iacovella V , Macaluso E , Maraviglia B . 2009. . Images-based suppression of unwanted global signals in resting-state functional connectivity studies . Magn Reson Imaging . 27 : 1058 – 1064 . [DOI] [PubMed] [Google Scholar]
- Gotham K , Pickles A , Lord C . 2009. . Standardizing ADOS scores for a measure of severity in autism spectrum disorders . J Autism Dev Disord . 39 : 693 – 705 . [DOI] [PMC free article] [PubMed] [Google Scholar]
- Hacker CD , Laumann TO , Szrama NP , Baldassarre A , Snyder AZ , Leuthardt EC , Corbetta M . 2013. . Resting state network estimation in individual subjects . Neuroimage . 82C : 616 – 633 . [DOI] [PMC free article] [PubMed] [Google Scholar]
- Hacker CD , Perlmutter JS , Criswell SR , Ances BM , Snyder AZ . 2012. . Resting state functional connectivity of the striatum in Parkinson's disease . Eur J Neurol . 135 : 3699 – 3711 . [DOI] [PMC free article] [PubMed] [Google Scholar]
- Hahn TT , Sakmann B , Mehta MR . 2006. . Phase-locking of hippocampal interneurons’ membrane potential to neocortical up-down states . Nat Neurosci . 9 : 1359 – 1361 . [DOI] [PubMed] [Google Scholar]
- Handwerker DA , Ollinger JM , D'Esposito M . 2004. . Variation of BOLD hemodynamic responses across subjects and brain regions and their effects on statistical analyses . Neuroimage . 21 : 1639 – 1651 . [DOI] [PubMed] [Google Scholar]
- Hayasaka S , Nichols TE . 2003. . Validating cluster size inference: random field and permutation methods . Neuroimage . 20 : 2343 – 2356 . [DOI] [PubMed] [Google Scholar]
- Haznedar MM , Buchsbaum MS , Hazlett EA , LiCalzi EM , Cartwright C , Hollander E . 2006. . Volumetric analysis and three-dimensional glucose metabolic mapping of the striatum and thalamus in patients with autism spectrum disorders . Am J Psychiatry . 163 : 1252 – 1263 . [DOI] [PubMed] [Google Scholar]
- He BJ , Zempel JM , Snyder AZ , Raichle ME . 2010. . The temporal structures and functional significance of scale-free brain activity . Neuron . 66 : 353 – 369 . [DOI] [PMC free article] [PubMed] [Google Scholar]
- Hollander E , Anagnostou E , Chaplin W , Esposito K , Haznedar MM , Licalzi E , Wasserman S , Soorya L , Buchsbaum M . 2005. . Striatal volume on magnetic resonance imaging and repetitive behaviors in autism . Biol Psychiatry . 58 : 226 – 232 . [DOI] [PubMed] [Google Scholar]
- Holleman E , Battaglia FP . 2015. . Memory consolidation, replay, and cortico- hippocampal interactions . In: Tatsuno M , editor. Analysis and Modeling of Coordinated Multi-neuronal Activity . New York: : Springer; . p. 207 – 221 . [Google Scholar]
- Jenkinson M , Beckmann CF , Behrens TE , Woolrich MW , Smith SM . 2012. . Fsl . NeuroImage . 62 : 782 – 790 . [DOI] [PubMed] [Google Scholar]
- Jones W , Klin A . 2013. . Attention to eyes is present but in decline in 2–6-month-old infants later diagnosed with autism . Nature . 504 : 427 – 431 . [DOI] [PMC free article] [PubMed] [Google Scholar]
- Just MA , Cherkassky VL , Keller TA , Kana RK , Minshew NJ . 2007. . Functional and anatomical cortical underconnectivity in autism: evidence from an FMRI study of an executive function task and corpus callosum morphometry . Cereb Cortex . 17 : 951 – 961 . [DOI] [PMC free article] [PubMed] [Google Scholar]
- Just MA , Keller TA , Malave VL , Kana RK , Varma S . 2012. . Autism as a neural systems disorder: a theory of frontal-posterior underconnectivity . Neurosci Biobehav Rev . 36 : 1292 – 1313 . [DOI] [PMC free article] [PubMed] [Google Scholar]
- Konig P . 1994. . A method for the quantification of synchrony and oscillatory properties of neuronal activity . J Neurosci Methods . 54 : 31 – 37 . [DOI] [PubMed] [Google Scholar]
- Langen M , Durston S , Staal WG , Palmen SJ , van Engeland H . 2007. . Caudate nucleus is enlarged in high-functioning medication-naive subjects with autism . Biol Psychiatry . 62 : 262 – 266 . [DOI] [PubMed] [Google Scholar]
- Luczak A , Bartho P , Marguet SL , Buzsaki G , Harris KD . 2007. . Sequential structure of neocortical spontaneous activity in vivo . Proc Natl Acad Sci USA . 104 : 347 – 352 . [DOI] [PMC free article] [PubMed] [Google Scholar]
- Maxim V , Sendur L , Fadili J , Suckling J , Gould R , Howard R , Bullmore E . 2005. . Fractional Gaussian noise, functional MRI and Alzheimer's disease . Neuroimage . 25 : 141 – 158 . [DOI] [PubMed] [Google Scholar]
- Meyer-Lindenberg A , Miletich RS , Kohn PD , Esposito G , Carson RE , Quarantelli M , Weinberger DR , Berman KF . 2002. . Reduced prefrontal activity predicts exaggerated striatal dopaminergic function in schizophrenia . Nat Neurosci . 5 : 267 – 271 . [DOI] [PubMed] [Google Scholar]
- Mitra A , Snyder AZ , Blazey T , Raichle ME . 2015. . Lag threads organize the brain's intrinsic activity . Proc Natl Acad Sci USA . 112 : E2235 – E2244 . [DOI] [PMC free article] [PubMed] [Google Scholar]
- Mitra A , Snyder AZ , Hacker CD , Raichle ME . 2014. . Lag structure in resting state fMRI . J Neurophysiol . 111 : 2374 – 2391 . [DOI] [PMC free article] [PubMed] [Google Scholar]
- Mohajerani MH , Chan AW , Mohsenvand M , Ledue J , Liu R , McVea DA , Boyd JD , Wang YT , Reimers M , Murphy TH . 2013. . Spontaneous cortical activity alternates between motifs defined by regional axonal projections . Nat Neurosci . 16 : 1426 – 1435 . [DOI] [PMC free article] [PubMed] [Google Scholar]
- Mohajerani MH , McVea DA , Fingas M , Murphy TH . 2010. . Mirrored bilateral slow-wave cortical activity within local circuits revealed by fast bihemispheric voltage-sensitive dye imaging in anesthetized and awake mice . J Neurosci . 30 : 3745 – 3751 . [DOI] [PMC free article] [PubMed] [Google Scholar]
- Nikolic D . 2007. . Non-parametric detection of temporal order across pairwise measurements of time delays . J Comput Neurosci . 22 : 5 – 19 . [DOI] [PubMed] [Google Scholar]
- Ozonoff S , Iosif AM , Baguio F , Cook IC , Hill MM , Hutman T , Rogers SJ , Rozga A , Sangha S , Sigman M et al. . 2010. . A prospective study of the emergence of early behavioral signs of autism . J Am Acad Child Adolesc Psychiatry . 49 : 256 – 266 . e251–252 . [PMC free article] [PubMed] [Google Scholar]
- Pierce K , Muller RA , Ambrose J , Allen G , Courchesne E . 2001. . Face processing occurs outside the fusiform ‘face area’ in autism: evidence from functional MRI . Brain . 124 : 2059 – 2073 . [DOI] [PubMed] [Google Scholar]
- Power JD , Barnes KA , Snyder AZ , Schlaggar BL , Petersen SE . 2012. . Spurious but systematic correlations in functional connectivity MRI networks arise from subject motion . Neuroimage . 59 : 2142 – 2154 . [DOI] [PMC free article] [PubMed] [Google Scholar]
- Power JD , Cohen AL , Nelson SM , Wig GS , Barnes KA , Church JA , Vogel AC , Laumann TO , Miezin FM , Schlaggar BL et al. . 2011. . Functional network organization of the human brain . Neuron . 72 : 665 – 678 . [DOI] [PMC free article] [PubMed] [Google Scholar]
- Power JD , Mitra A , Laumann TO , Snyder AZ , Schlaggar BL , Petersen SE . 2014. . Methods to detect, characterize, and remove motion artifact in resting state fMRI . NeuroImage . 84 : 320 – 341 . [DOI] [PMC free article] [PubMed] [Google Scholar]
- Rauch SL , Savage CR , Alpert NM , Dougherty D , Kendrick A , Curran T , Brown HD , Manzo P , Fischman AJ , Jenike MA . 1997. . Probing striatal function in obsessive-compulsive disorder: a PET study of implicit sequence learning . J Neuropsychiatry Clin Neurosci . 9 : 568 – 573 . [DOI] [PubMed] [Google Scholar]
- Redcay E , Moran JM , Mavros PL , Tager-Flusberg H , Gabrieli JD , Whitfield-Gabrieli S . 2013. . Intrinsic functional network organization in high-functioning adolescents with autism spectrum disorder . Front Hum Neurosci . 7 : 573 . [DOI] [PMC free article] [PubMed] [Google Scholar]
- Rojas DC , Peterson E , Winterrowd E , Reite ML , Rogers SJ , Tregellas JR . 2006. . Regional gray matter volumetric changes in autism associated with social and repetitive behavior symptoms . BMC Psychiatry . 6 : 56 . [DOI] [PMC free article] [PubMed] [Google Scholar]
- Rudie JD , Shehzad Z , Hernandez LM , Colich NL , Bookheimer SY , Iacoboni M , Dapretto M . 2012. . Reduced functional integration and segregation of distributed neural systems underlying social and emotional information processing in autism spectrum disorders . Cereb Cortex . 22 : 1025 – 1037 . [DOI] [PMC free article] [PubMed] [Google Scholar]
- Rutter M , Le Couteur A , Lord C . 2003. . ADI-R: Autism diagnostic interview-revised manual . Los Angeles, CA: : Western Psychological Services; . [Google Scholar]
- Saka E , Graybiel AM . 2003. . Pathophysiology of Tourette's syndrome: striatal pathways revisited . Brain Dev . 25(Suppl 1) : S15 – S19 . [DOI] [PubMed] [Google Scholar]
- Schneider G , Havenith MN , Nikolic D . 2006. . Spatiotemporal structure in large neuronal networks detected from cross-correlation . Neural Comput . 18 : 2387 – 2413 . [DOI] [PubMed] [Google Scholar]
- Schwarzkopf DS , Anderson EJ , de Haas B , White SJ , Rees G . 2014. . Larger extrastriate population receptive fields in autism spectrum disorders . J Neurosci . 34 : 2713 – 2724 . [DOI] [PMC free article] [PubMed] [Google Scholar]
- Sears LL , Vest C , Mohamed S , Bailey J , Ranson BJ , Piven J . 1999. . An MRI study of the basal ganglia in autism . Prog Neuropsychopharmacol Biol Psychiatry . 23 : 613 – 624 . [DOI] [PubMed] [Google Scholar]
- Sheroziya M , Timofeev I . 2014. . Global intracellular slow-wave dynamics of the thalamocortical system . J Neurosci . 34 : 8875 – 8893 . [DOI] [PMC free article] [PubMed] [Google Scholar]
- Shulman GL , Pope DL , Astafiev SV , McAvoy MP , Snyder AZ , Corbetta M . 2010. . Right hemisphere dominance during spatial selective attention and target detection occurs outside the dorsal frontoparietal network . J Neurosci . 30 : 3640 – 3651 . [DOI] [PMC free article] [PubMed] [Google Scholar]
- Sirota A , Csicsvari J , Buhl D , Buzsaki G . 2003. . Communication between neocortex and hippocampus during sleep in rodents . Proc Natl Acad Sci USA . 100 : 2065 – 2069 . [DOI] [PMC free article] [PubMed] [Google Scholar]
- Smith SM , Fox PT , Miller KL , Glahn DC , Fox PM , Mackay CE , Filippini N , Watkins KE , Toro R , Laird AR et al. . 2009. . Correspondence of the brain's functional architecture during activation and rest . Proc Natl Acad Sci USA . 106 : 13040 – 13045 . [DOI] [PMC free article] [PubMed] [Google Scholar]
- Smyser CD , Inder TE , Shimony JS , Hill JE , Degnan AJ , Snyder AZ , Neil JJ . 2010. . Longitudinal analysis of neural network development in preterm infants . Cereb Cortex . 20 : 2852 – 2862 . [DOI] [PMC free article] [PubMed] [Google Scholar]
- Spiker D , Lotspeich LJ , Dimiceli S , Myers RM , Risch N . 2002. . Behavioral phenotypic variation in autism multiplex families: evidence for a continuous severity gradient . Am J Med Genet . 114 : 129 – 136 . [DOI] [PubMed] [Google Scholar]
- Stevenson RA , Siemann JK , Schneider BC , Eberly HE , Woynaroski TG , Camarata SM , Wallace MT . 2014. . Multisensory temporal integration in autism spectrum disorders . J Neurosci . 34 : 691 – 697 . [DOI] [PMC free article] [PubMed] [Google Scholar]
- Stoner R , Chow ML , Boyle MP , Sunkin SM , Mouton PR , Roy S , Wynshaw-Boris A , Colamarino SA , Lein ES , Courchesne E . 2014. . Patches of disorganization in the neocortex of children with autism . New Engl J Med . 370 : 1209 – 1219 . [DOI] [PMC free article] [PubMed] [Google Scholar]
- Stroh A , Adelsberger H , Groh A , Ruhlmann C , Fischer S , Schierloh A , Deisseroth K , Konnerth A . 2013. . Making waves: initiation and propagation of corticothalamic Ca2+ waves in vivo . Neuron . 77 : 1136 – 1150 . [DOI] [PubMed] [Google Scholar]
- Thomas Yeo BT , Krienen FM , Sepulcre J , Sabuncu MR , Lashkari D , Hollinshead M , Roffman JL , Smoller JW , Zollei L , Polimeni JR et al. . 2011. . The organization of the human cerebral cortex estimated by intrinsic functional connectivity . J Neurophysiol . 106 : 1125 – 1165 . [DOI] [PMC free article] [PubMed] [Google Scholar]
- Tyszka JM , Kennedy DP , Paul LK , Adolphs R . 2013. . Largely typical patterns of resting-state functional connectivity in high-functioning adults with autism . Cereb Cortex . 247 : 1894 – 1905 . [DOI] [PMC free article] [PubMed] [Google Scholar]
- Uddin LQ , Supekar K , Menon V . 2013. . Reconceptualizing functional brain connectivity in autism from a developmental perspective . Front Hum Neurosci . 7 : 458 . [DOI] [PMC free article] [PubMed] [Google Scholar]
- Vicente R , Gollo LL , Mirasso CR , Fischer I , Pipa G . 2008. . Dynamical relaying can yield zero time lag neuronal synchrony despite long conduction delays . Proc Natl Acad Sci USA . 105 : 17157 – 17162 . [DOI] [PMC free article] [PubMed] [Google Scholar]
- Vincent JL , Kahn I , Snyder AZ , Raichle ME , Buckner RL . 2008. . Evidence for a frontoparietal control system revealed by intrinsic functional connectivity . J Neurophysiol . 100 : 3328 – 3342 . [DOI] [PMC free article] [PubMed] [Google Scholar]
- Washington SD , Gordon EM , Brar J , Warburton S , Sawyer AT , Wolfe A , Mease-Ference ER , Girton L , Hailu A , Mbwana J et al. . 2014. . Dysmaturation of the default mode network in autism . Hum Brain Mapp . 35 : 1284 – 1296 . [DOI] [PMC free article] [PubMed] [Google Scholar]
- Waterhouse L , Morris R , Allen D , Dunn M , Fein D , Feinstein C , Rapin I , Wing L . 1996. . Diagnosis and classification in autism . J Autism Dev Disord . 26 : 59 – 86 . [DOI] [PubMed] [Google Scholar]
- Wingate M , Baio J . 2014. . Prevalence of autism spectrum disorder among children aged 8 years - autism and developmental disabilities monitoring network, 11 sites, United States, 2010 . Morb Mortal Wkly Rep . 63 : 1 – 21 . [PubMed] [Google Scholar]
- Yuste R , Fairhall AL . 2015. . Temporal dynamics in fMRI resting-state activity . Proc Natl Acad Sci USA . 112 : 5263 – 5264 . [DOI] [PMC free article] [PubMed] [Google Scholar]
Associated Data
This section collects any data citations, data availability statements, or supplementary materials included in this article.