ABSTRACT
Background
The residency match process for competitive specialties hinders programs' ability to holistically review applications.
Objective
A computer simulation model of the residency application process was created to test the hypotheses that (1) it is advantageous to medical students to apply to the maximum number of programs under the current system, and (2) including a medical student's residency program preferences at the beginning of the application process improves the efficiency of the system for applicants and programs as quantified by the number of interview invitations received.
Methods
The study was conducted in 2016 using 2014 Otolaryngology Match data. A computer model was created to perform simulations for multiple scenarios to test the hypotheses. Students were assigned scores representing easy and hard metrics and program preferences, simulating a mixture of individual student preference and general program popularity.
Results
We modeled a system of 99 otolaryngology residency programs with 292 residency spots and 460 student applicants. While it was individually advantageous for an applicant to apply to the maximum number of programs, this led to a poor result for the majority of students when all applicants undertook the strategy. The number of interview invitations improved for most applicants when preference was revealed.
Conclusions
Offering applicants an option to provide program preference improves the practical number of interview invitations. This enables programs to review applicants holistically—instead of using single parameters such as United States Medical Licensing Examination scores—which facilitates a selection of applicants who will be successful in residency.
What was known and gap
Applicants to competitive residencies are applying to more programs, thus limiting programs' ability to holistically review students.
What is new
A computer simulation model of the residency application process evaluated if it is advantageous for medical students to apply to the maximum number of residency programs and provide program preferences at the beginning of the application process.
Limitations
The model simplifies characteristics and motivations of students and programs within a single specialty.
Bottom line
The model demonstrates that the option to provide student preferences to residency programs at the time of application submission could benefit students and programs.
Introduction
Medical students applying to residency programs must first be chosen for interviews and then be selected for hire. Historically, logistical constraints restricted the number of applications medical students could submit, but standardized online processes now permit the easy submission of many applications. Although it is tempting to criticize applicants for applying to more than 100 programs, according to game theory, this is a rational response because an individual will maximize his or her chance for success as long as the cost is minimal.1,2
With increasing numbers of applications, programs often create screening techniques to reduce the applicant pool. Easy to review metrics include objective data such as United States Medical Licensing Examination scores and class rank (Table). After easy metrics are applied, hard to review components, such as personal statements, recommendation letters, volunteer activities, and research interests, are evaluated. While this system allows programs to manage increased numbers of applications, there is strong evidence that easy metrics correlate poorly with residency success.3–6
Table.
Residency Match Applicant Metrics
| Easy to Review | Hard to Review |
|
|
Abbreviations: USMLE, United States Medical Licensing Examination; GPA, grade point average; AOA, Alpha Omega Alpha.
As students apply to an increasing number of programs, program directors lose the ability to discern sincere interest. Programs may be willing to closely consider applications from students with a high likelihood of ranking the program if they could be identified. We created a computer simulation model of the residency application process to analyze this problem and test potential solutions. We hypothesized that providing applicants with an option to reveal preference to programs will (1) increase an applicant's number of interview invitations to a practical limit, and (2) permit programs to completely review applications from the most interested applicants.
Methods
We created a computer simulation model of the residency application process, using MATLAB (MathWorks, Natick, MA), that included students' applications, programs' application screening and review process, and interview invitations. Students were randomly assigned scores representing easy and hard metrics (Table) and program preferences, simulating a mix of individual student preference and general program popularity. Details of the model and simulation process are provided as online supplemental material.
For each simulation, students applied to a defined number of residency programs in order of preference. If a residency program received more applications than it had resources to review, applicants were screened solely on easy scores. The selected applications then underwent a full review using the total score (both easy and hard). After initial screening, if a residency program received more applicants than it could interview, all previously screened applicants were ranked using students' total scores. Each residency program sent out interview invitations up to the limit they could accommodate in order of students' total scores. If students received more interview invitations than they could accept, they declined the least preferred invitations. Programs with declined invitations filled the empty spots by inviting the next student on the program's list.
In some simulations, we allowed students to convey preferences to residency programs by revealing whether the program fit into a list of preferred programs. This simulated a system where students submit applications at various cost tiers. If students chose to convey preferences, the easy score was enhanced for those programs. The enhancement varied from a modest amount (reflecting a reasonable program preference) to a more exaggerated amount (accentuating changes for visualization purposes). This simulated to a program the value of knowing an applicant's interest (ie, being more willing to fully evaluate the application and potentially interview students who demonstrate sincere interest).
We recorded the number of interview invitations offered to an index applicant with specific easy and hard scores assigned +2, +1, 0, –1, or –2 standard deviations from the mean for easy and hard scores. For some simulations, all students submitted identical numbers of applications; in others, the index student submitted a different number of applications than the rest of the group.
We performed simulations the following 4 ways: (1) without residency programs having knowledge of any student's preference; (2) with programs knowing the preferences of all students; (3) with programs knowing the preferences of only the index student; and (4) with programs knowing the preferences of all students except the index student. The latter 2 simulations explored the impact of a particular student acting in a manner different from the rest of the students.
This study was declared exempt from Institutional Review Board approval.
Results
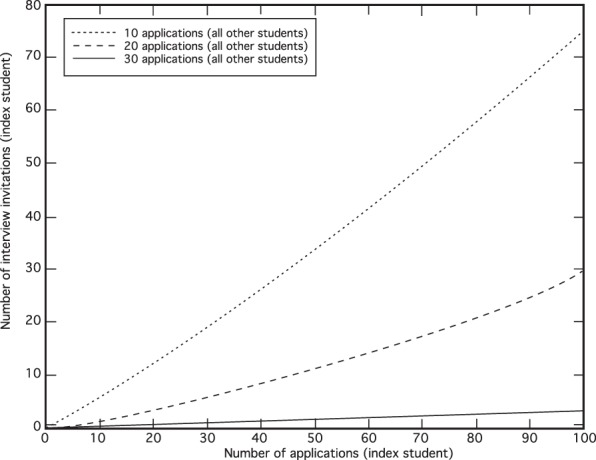
We modeled a system of 99 otolaryngology residency programs with 292 residency spots and 460 student applicants. Figure 1 plots interview invitations for a student with average easy and hard scores, applying to varying numbers of programs, while other students submitted a constant number of applications. Increasing the number of applications led to more interview invitations for all points on all curves.
Figure 1.

Interviews for Average Student by Number of Applicationsa
a Number of interviews received versus number of applications submitted for index student when all other students submitted a constant number of applications. The index student in this case had average easy and hard scores. The 3 curves show a scenario when all other applicants apply to a fixed number of programs (10, 20, and 30).
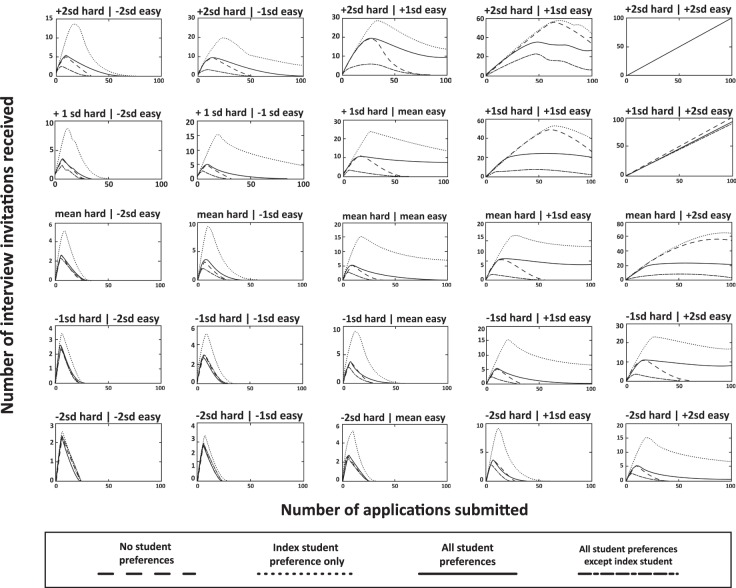
Figure 2 plots interview invitations for 25 index students when all students submitted the same number of applications (ranging from 1 to 99 programs). Lines in each subplot represent whether students provided preference information to programs. Figure 2 shows the results for a large preference modification, which demonstrates the differences more clearly on these plots. However, the same relationships were found to a lesser degree using all preference values. For each index student and all numbers of applications, the interview number increased when preferences were provided (dotted line) compared with when they were not (dashed line). When all students provided preferences (solid line), results improved for most index students. Index students with both the highest easy and hard scores did worse when all students provided preferences. However, there was no detrimental effect on this group as these students received more interview invitations than they could practically accept (20 in our model). For each index student and each number of applications, providing preferences resulted in more interview invitations compared with withholding preferences when the other students behaved in the same manner. When other students did not provide preferences, the number of interviews represented by the dotted lines (preference provided) was always greater than the number represented by the dashed line (no preference provided). The same is seen when the other students provided preferences. As the number of applications increased for all students, the number of interview invitations became more skewed toward the top applicants. When preference was included, this phenomenon was less extreme.
Figure 2.
Interviews for Students with Varying Characteristics and Preference Sharinga
a Number of interview invitations for index student with varying easy and hard to review characteristics relative to the mean. The figure plots the interview invitations received based on the number of applications submitted and the provision of preference information. Each subplot represents an index student with hard and easy scores of either –2, –1, 0, +1, or +2 standard deviations from the mean. The x-axis indicates the number of applications sent out by all students. The y-axis represents the number of interview invitations received by the index student. The dashed line represents the situation when no students provide preferences. The dotted line represents only the index student providing preferences. The dash-dot line represents all students providing preferences except for the index student. The solid line represents all students providing preferences.
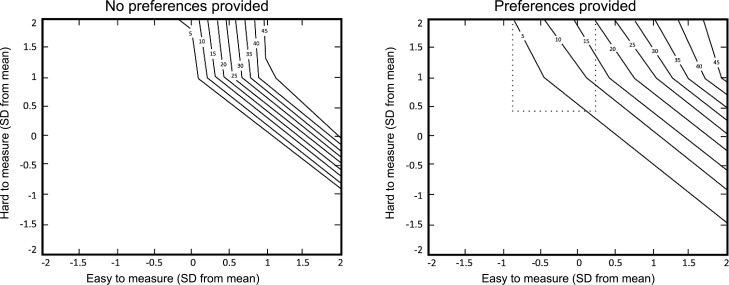
Figure 3 plots the distributions of interviews by applicants' easy and hard scores when every applicant submitted 50 applications. The subplots demonstrate the change in the distributions from no preferences provided by any applicant (left) to preferences provided by all applicants (right). A narrower distribution was seen without preference, emphasizing the easy characteristics of an applicant. With preference, interviews were distributed widely and more applicants with higher hard scores were included, which is seen within the area of the dotted polygon in the preferences plot.
Figure 3.
Distribution of Interviews by Preference Sharinga
a The contour lines indicate the number of interview invitations offered to each applicant based on their easy and hard scores relative to mean, ±2 standard deviations. With no preference provided, programs would offer interviews preferentially to a relatively small group of applicants with the highest easy scores. With preference, interviews were distributed more widely and more applicants with higher hard scores were included; this increase is seen within the area of the dotted polygon in the preferences plot. The applicants contained within the area of the dotted polygon on the (+) preference plot are 1 and 2 standard deviations above the mean in the hard category.
Discussion
Our computer model simulation demonstrated that applicants were incentivized to apply to as many programs as possible when cost per application was low. When students responded by submitting large numbers of applications, programs responded by limiting interview invitations to a pool of candidates with strong, easily measured metrics. Allowing students to express preferences at the time of application improved interview invitations for students with strong holistic metrics without significantly disadvantaging other strong applicants.
Applicants were incentivized to apply to as many programs as possible (Figure 1) when competing student application numbers were fixed and cost per application was low. Weissbart and colleagues2 came to a similar conclusion in their analysis of the Urology Match. Without a significant cost per application, every student sought to improve his or her own outcome by applying to the maximum number of programs. This occurred despite inevitably leading to fewer interview invitations for the majority of applicants (Figure 2).
Our model also predicted a counterintuitive situation where a competitive specialty could have both unmatched students and unfilled programs. This occurred if all students applied to a majority of programs, and the programs had little ability to determine sincere student interest. Programs limited interview requests to the same small pool of top applicants, which was insufficient to fill all programs. Students outside the top applicant pool were not granted interviews and went unmatched.
One potential solution is to impart a larger application cost—monetary or time—in an effort to reduce the total number of applications. However, higher financial costs could increase student debt and disproportionately affect students with fewer financial resources. Individual essay requirements for each program, used in the 2016 Otolaryngology Match, requires time and effort. Eventually, the effort to write an additional essay exceeds the added benefit. However, the time required to counteract the impetus toward more applications may detract from more beneficial educational activities (or prove an insufficient cost to deter additional applications). A cap on the number of applications students could submit was somewhat successful (albeit unpopular) in Japan, in an effort to enhance matching into specific rural regions. This approach requires limiting options and could be perceived by students as individually detrimental.
Rather than limiting applications, we propose having medical students voluntarily provide preference information to programs. Student preferences remain invisible to programs at the time of initial applicant evaluation. One exception is the case of audition rotations, which are expected in a number of competitive residency programs,7,8 and demonstrate student interest, as evidenced by the cost (time, effort, and financial resources). Currently, a student's preference is not revealed until he or she accepts an interview offer. However, students' preference at the time of interview acceptance is unlikely to differ significantly from their preference at the time of application; the same information is available to students at both time points. Conveying preference provides benefit for most students without actual harm. Students with the highest scores may receive fewer interviews but still receive as many from preferred programs as they can practically accept.
Providing preference on the Electronic Residency Application Service application could be a straightforward option. A student could choose to reveal whether a program was within the list of top programs. If a program did not receive preference, it was outside the top list or the student did not want to reveal preference. It is more likely that a program would fully evaluate both easy and hard aspects of applicants who indicated a preference for the program.
It is not required that students provide preferences; game theory dictates that merely offering the choice ensures that all students will make the choice. It is advantageous for any student to provide preferences whether other students do or not, no matter how many applications are submitted (Figure 2). Therefore, every student would voluntarily choose to provide preferences if given the option, resulting in the desired scenario without imposing an actual requirement.
Our study has limitations. The results are limited by our model, which simplifies characteristics and motivations of students and programs and seeks to describe overall outcomes based on broad and generalized decisions. While we chose values representing a single specialty and year as a reasonable approximation of a competitive residency application environment, the overall findings are likely generalizable. We made assumptions that programs behave in a certain manner (eg, number of interviews per available slot) and assigned value to certain factors (eg, easy and hard to measure metrics, how much to value applicant interest), which may vary by situation. Future enhancements to the model would be to simulate the match process itself.
Conclusion
A computer model using Otolaryngology Match numbers found that allowing medical students to voluntarily add preferences for programs at the time of application submission enhances students' practical number of interview invitations for nearly all applicants. In competitive residencies, knowing application program preferences may reduce use of easy to measure metrics to screen large numbers of applicants and promote inclusion of hard to measure metrics in more holistic assessment of applicants.
Supplementary Material
References
- 1.Gale D, Shapley LS. College admissions and the stability of marriage. Am Math Mon. 1962;69(1):9–15. doi: 10.2307/2312726. [DOI] [Google Scholar]
- 2.Weissbart SJ, Hall SJ, Fultz BR, Stock JA. The urology match as a prisoner's dilemma: a game theory perspective. Urology. 2013;82(4):791–797. doi: 10.1016/j.urology.2013.04.061. [DOI] [PubMed] [Google Scholar]
- 3.Daly KA, Levine SC, Adams GL. Predictors for resident success in otolaryngology. J Am Coll Surg. 2006;202(4):649–654. doi: 10.1016/j.jamcollsurg.2005.12.006. [DOI] [PubMed] [Google Scholar]
- 4.Warrick SS, Crumrine RS. Predictors of success in an anesthesiology residency. Acad Med. 1986;61(7):591–595. doi: 10.1097/00001888-198607000-00007. [DOI] [PubMed] [Google Scholar]
- 5.Egol KA, Collins J, Zuckerman JD. Success in orthopaedic training: resident selection and predictors of quality performance. J Am Acad Orthop Surg. 2011;19(2):72–80. doi: 10.5435/00124635-201102000-00002. [DOI] [PubMed] [Google Scholar]
- 6.Gebhard GM, Hauser LJ, Dally MJ, Weitzenkamp DA, Cabrera-Muffly C. Do otolaryngology residency applicants relocate for training? Laryngoscope. 2016;126(4):829–833. doi: 10.1002/lary.25501. [DOI] [PMC free article] [PubMed] [Google Scholar]
- 7.Baldwin K, Weidner Z, Ahn J, Mehta S. Are away rotations critical for a successful match in orthopaedic surgery? Clin Orthop Relat Res. 2009;467(12):3340–3345. doi: 10.1007/s11999-009-0920-9. [DOI] [PMC free article] [PubMed] [Google Scholar]
- 8.Bernstein AD, Jazrawi LM, Elbeshbeshy B, Della Valle CJ, Zuckerman JD. Orthopaedic resident-selection criteria. J Bone Joint Surg Am. 2002;84-A(11):2090–2096. doi: 10.2106/00004623-200211000-00026. [DOI] [PubMed] [Google Scholar]
Associated Data
This section collects any data citations, data availability statements, or supplementary materials included in this article.


