

Abstract
Background and aims
Experimental data suggest that the HLA-DQ2 gene dose has a strong quantitative effect on clinical outcomes and severity of celiac disease (CD). We aimed to conduct a meta-analysis with systematic review to investigate the association between HLA-DQB1*02 gene doses and the characteristics of CD.
Methods
We searched seven medical databases for studies discussing HLA-DQB1 gene dose in CD and various disease characteristics, such as clinical presentation, histology, age at diagnosis, and comorbidities. Odds ratios (OR, for categorical variables) and weighted mean differences (for age) were calculated to compare patients with a double dose of HLA-DQB1*02 versus those with single and zero doses. Heterogeneity was tested with I2-statistics and explored by study subgroups (children and adults).
Results
Twenty-four publications were eligible for meta-analysis. Classical CD was more frequent with a double versus single dose of the HLA-DQB1*02 allele (OR = 1.758, 95%CI: 1.148–2.692, I2 = 0.0%). In pediatric studies, gene dose effect was more prominent (OR = 2.082, 95%CI: 1.189–3.646, I2 = 0.0% and OR = 3.139, 95%CI: 1.142–8.630, I2 = 0.0% for the comparisons of double versus single and double versus zero dose, respectively). Atrophic histology was more prevalent with a double versus zero dose (OR = 2.626, CI: 1.060–6.505, I2 = 21.3%). We observed no gene dose effect regarding diarrhea, age at diagnosis, the severity of villous atrophy, and the association with type 1 diabetes mellitus.
Conclusion
A double dose of HLA-DQB1*02 gene seems to predispose patients to developing classical CD and villous atrophy. Risk stratification by HLA-DQB1*02 gene dose requires further clarification due to the limited available evidence.
Introduction
Celiac disease (CD) is an immune-mediated systemic disorder triggered by gluten that occurs in genetically susceptible individuals [1, 2]. CD is characterized histologically by small intestinal mucosal damage, clinically by various intestinal and extraintestinal manifestations.
The presence of HLA-DQ2 or DQ8 is essential in the disease pathogenesis. T-lymphocytes recognize gliadin peptides presented by antigen presenting cells expressing DQ2 or DQ8 on cell surface, exclusively. Therefore, theoretically, either haplotype must be present in all CD-patients [3].
HLA-DQ2 is present in up to 90–95% of celiac cases. The HLA-DQ2 heterodimer consists of an α and a β subunit encoded by HLA-DQA1*05 and HLA-DQB1*02 alleles on chromosome 6, respectively [3]. Alleles are located on the same chromosome in cis configuration (DR3/DQ2 haplotype) or separately on homologous chromosomes in trans configuration (DR5/DQ7 and DR5/DQ2 haplotypes) [3]. The two types of DQ2 heterodimers are DQ2.5 (DQA1*0501/B1*0201) and DQ2.2 (DQA1*0201/B1*0202). Patients with heterodimers of DQ2.5 carry a high risk and with heterodimers of DQ2.2 carry a low risk of CD [2, 4, 5]. DQ2.2 molecules are structurally similar to DQ2.5, but the latter’s gluten peptide-binding properties are less prominent [3, 4, 6]. Those with DQ2.2 haplotype are at high risk of CD but only if they are DQ2.2/2.5 or DQ2.2/DQ7 heterozygotes. In the latter case, functional DQ2.5 molecules can be assembled from α and β chains encoded separately on different chromosomes (DQA1*0505 and DQB1*0202, respectively); this constitution is called ‘DQ2 in trans’ [2, 5, 7, 8]. HLA-DQ8 is found up to 5–10% of CD patients, whose α and β chains are encoded by HLA-DQA1*0301 and HLA-DQB1*0302, respectively (that is, DR4/DQ8 haplotype with DR4-linked inheritance). A small minority of patients have half of the DQ2 heterodimer (either DQA*05 or DQB*02); however, it seems to be sufficient for effective antigen presentation [2, 5, 8].
Since the DQ2 molecule plays a crucial role in CD pathogenesis, the number of HLA DQB1*0201 copies might have important consequences in CD patients: 4 αβ-chain combinations can be synthesized in heterozygotes but all HLA-DQ molecules are identical in homozygotes [5, 9, 10]. Experimental data support this connection: HLA-DQ2.5 homozygotes can present gluten peptides on antigen-presenting cells more effectively than HLA-DQ2.5 heterozygotes [4, 5]. HLA-DQ2.5 homozygotes are at fivefold risk of CD as compared to HLA-DQ2.5 heterozygotes [6, 9–11]. The presence of a second β chain seems decisive in determining the risk, whereas the role of a second α chain appears less important [10, 12, 13]. The magnitude of immune response depends on gene dose: HLA-DQ2.5 homozygotes show maximal T-cell activation and proinflammatory response, whereas heterozygotes exhibit less prominent responses. The more DQ2.5 molecules are expressed on antigen presenting cells, the stronger the immune activation is [4–6]. Based on these in vitro immunological studies, one might assume that HLA-DQ2 homozygosity alters the course of CD; furthermore, the gene dose effect is manifested clinically with an increased risk of complications [14].
To our best knowledge, no meta-analyses have been conducted on the clinical effects of HLA-DQB1*02 gene dose in CD. It is assumed that patients with a double dose of HLA-DQB1*02 exhibit worse clinical outcomes, though some papers reported on how HLA-DQ2 gene dose (i.e., the number of DQB1*02 alleles) is associated with CD phenotype. This meta-analysis aims to investigate the association between HLA-DQB1*02 gene dose and the disease characteristics.
Materials and methods
We conducted our meta-analysis observing the rules of the Preferred Reporting Items for Systematic Reviews and Meta-Analysis (PRISMA) Statement (S1 Appendix) [15].
Search
PubMed (MEDLINE), Embase, Cochrane Controlled Register of Trials (CENTRAL), Web of Science, WHO Global Health Library, ClinicalTrials.gov, and Scopus were searched for articles discussing gene dose effect from inception until 22nd October 2018. Our query was “celiac AND (homozyg* OR heterozyg* OR "gene dose" OR "gene dosage" OR "double dose" OR "double dosage" OR "single dose" OR "single dosage" OR "zero dose" OR "zero dosage" OR DQB1 OR DQ2.5 OR DQ2.2 OR DQ7 OR DQ8 OR "DQ2 in trans")”. Reference lists and citing articles of the relevant studies were hand-searched for further papers. No filters were imposed upon the search. Draft of search in Embase is presented in S2 Appendix.
Our PICO format was, as follows: (P) celiac disease, (I1) zero-dose HLA-DQB1*02, (I2) single-dose HLA-DQB1*02, (C) double-dose HLA-DQB1*02, (O) celiac phenotype at diagnosis including histological severity (atrophic vs. non-atrophic and Marsh 3c vs. Marsh 3a-b), clinical presentation (classical vs. non-classical and diarrhea vs. non-diarrhea), age at onset and at diagnosis, celiac-specific serology; concomitant immune-mediated disorders, dermatitis herpetiformis, anemia, dental complications, and malignant tumors.
Eligibility, selection, and data extraction
We included original papers and conference abstracts, with the exclusion of case reports; and excluded comments, letters, editorials, and review articles. Eligible study design included both observational and experimental studies with adequate description of the genetic background and disease characteristics.
Eligible studies discussed celiac patients diagnosed in accordance with the current guidelines with known gene dose of HLA-DQB1*02 (double, single, and zero doses) and reported at least one of our predefined outcomes of patients by genotypes, separately. On inclusion, only PCR-based HLA-typing (sequence-specific primer or oligonucleotide probes) was acceptable.
Outcomes included clinical presentation dichotomized into classical and non-classical phenotype according to the Oslo criteria. Classical and non-classical CD are defined by the presence and absence of signs and symptoms of malabsorption (i.e., diarrhea, steatorrhea, weight loss, or growth failure), respectively [16], or into groups with and without diarrhea. Age at diagnosis and at disease onset were assessed separately. On one hand, diagnostic histology was divided into atrophic (Marsh 3 grade) and non-atrophic (Marsh 0–2 grades) mucosal damage [17]. On the other hand, we analyzed the severity of villous atrophy graded by the Marsh-Oberhuber classification (Marsh 3c vs. Marsh 3a-b) [18]. Tissue transglutaminase antibodies and endomysial antibodies were in the focus when discussing diagnostic serology. Other outcomes included disease complications and comorbid conditions (i.e., anemia, osteoporosis, autoimmunity, dental complications, dermatitis herpetiformis, malignant tumors, and type 1 diabetes mellitus).
We combined the yield of search in a reference manager software (EndNote X7.4, Clarivate Analytics, Philadelphia, PA, US), followed by the removal of overlaps between database content and duplicate records. The duplicate-free pool was searched first by title, then by abstracts, and full-texts against our eligibility criteria. Each phase of selection was carried out by two independent review authors (PV and KS) in duplicate, discrepancies were resolved by third party (MS) arbitration. Investigators had no contact with the authors of the original papers.
The following data were collected by two investigators onto pre-constructed Excel sheets: publication data, study design, population (numbers and characteristics of participants), HLA-DQB1*02 gene dose, age at onset; age, histology, serology, clinical presentation, anemia at diagnosis; concomitant immune-mediated disorders and complications: type 1 diabetes mellitus, dermatitis herpetiformis, dental enamel defect, recurrent aphthous stomatitis, enteropathy-associated T-cell lymphoma (EATL), small bowel carcinoma (SBC).
In the case of articles giving only HLA-DQ genotype, HLA-DQB1*02 gene dose was calculated, as follows: double-dose—HLA-DQ2.5 homozygotes (DQ2.5/DQ2.5) and compound heterozygotes (DQ2.5/DQ2.2); single-dose—HLA-DQ2.5 heterozygotes (DQ2.5/DQX) and HLA-DQ2 in trans (DQ2.2/DQ7); and zero-dose—HLA-DQ8/DQX and HLA-DQ2.2/DQX, where X represents any alleles except for DQ2.5 [8, 19–28].
Risk of bias assessment
Two authors (MB and EP), unblinded to publication data, assessed the methodological quality of each study by using a tool developed a priori by our review team based on the Newcastle-Ottawa Scale (S1 Table). Results of risk of bias assessment were taken into account when assessing the limitations of the individual studies.
Statistical analysis
A biostatistician (NF) carried out the statistical analysis by using Comprehensive Meta-Analysis software (Version 3, Biostat, Englewood, NJ). The random effect model with DerSimonian-Laird estimation was used for analysis [29]. For dichotomous outcomes (i.e., histology, clinical presentation, and diarrhea), we calculated odds ratios (ORs) and 95% confidence interval (CIs). For age at diagnosis, weighted mean difference (MD) and 95% CIs were calculated. Statistical significance was attained when p<0.05.
Heterogeneity was tested with I2- and chi2-tests. An I2 of 0%-40%, 30%-60%, 50%-90%, and 75%-100% represented not important, moderate, substantial, and considerable between-study heterogeneity with p<0.10 indicating statistical significance [30]. Since the clinical phenotype of CD diagnosed in childhood and adulthood may differ, we planned to set up study subgroups by age (children and adults) in each plot [31–35]. The number of studies was insufficient for meta-regression by gene dose.
Funnel plots were used to assess publication bias.
Sensitivity analysis was performed by omitting studies one-by-one from the analyses and recalculating the pooled effect.
Results
Search and selection
Fig 1. shows the flowchart of this work. Our search strategy yielded 6704 records (PubMed [MEDLINE]: 954, Embase: 2277, CENTRAL: 43, Web of Science: 925, WHO Global Health Library: 795, ClinicalTrials.gov: 6, and Scopus: 1704). Out of a total of 59 papers eligible for qualitative synthesis (Table 1 and S2 Table) [7, 8, 12–14, 19–28, 36–79], 24 were included in meta-analysis (Table 1) [8, 12, 19–28, 36–47]. Results of meta-analysis are summarized in Table 2, raw data on disease characteristics are presented in S3 Table.
Fig 1. Flow chart of meta-analysis.
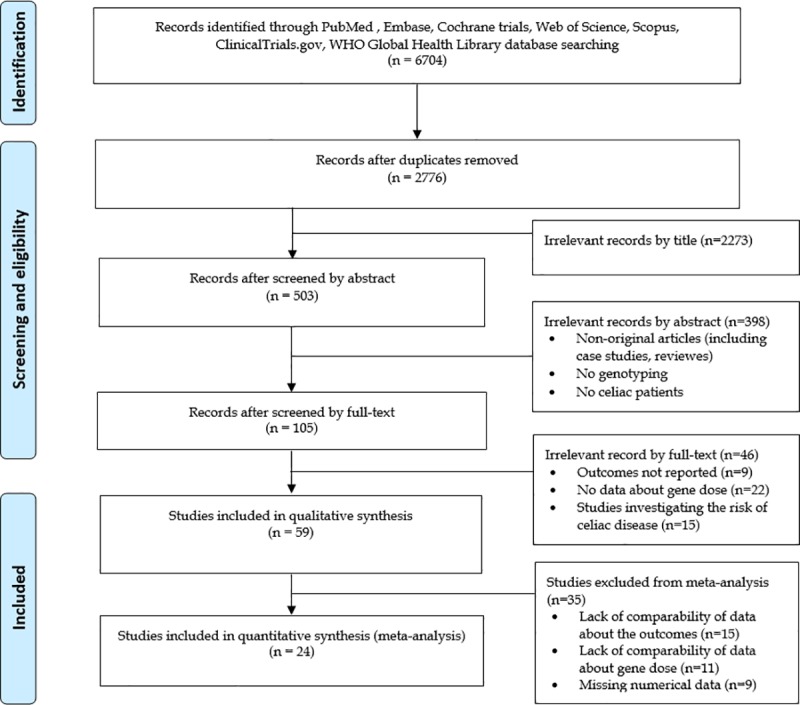
Table 1. Characteristics of included studies.
| Author (year) | Country | Settings | N0 of pts. | Age group | Genotyping | ||
|---|---|---|---|---|---|---|---|
| Method | Target of typing within the study | N0 of pts. (double/single/zero dose) | |||||
| Akar et al. (2015) [36] | Turkey | prospective, single center, cross-sectional | 36 CD pts | children | PCR-SSP | HLA-DQB1*0201 allele dose | 5/24/7 |
| Araya et al. (2015) [19] | Chile | prospective, single center, case-control | 56 CD pts and 166 first degree relatives | children and adults | PCR-SSP | HLA-DQ genotype | 12/25/7 |
| Bastos et al. (2017) [20] | Brazil | prospective, multicenter, case-control | 66 CD pts and 32 CD/T1DM pts | not reported (median age 14 years) | RT-PCR | HLA-DQ genotype | 16/52/30 |
| Cabrera et al. (2018) [21] | Spain | prospective, single center, case-control | 196 CD pts and 206 healthy control | children | PCR-SSO | HLA-DQ genotype | 79/103/14 |
| Cakir et al. (2014) [22] | Turkey | prospective, single center, cross-sectional? | 78 CD pts | children | PCR-SSO | HLA-DQ genotype | 28/34/14 |
| Colombe et al. (2015) [37] | USA | retrospective, single center, cross-sectional | 89 CD pts | adults | PCR-SSP | HLA-DQB1*0201 allele dose | 45/7/37 |
| Congia et al. (1994) [38] | Italy | prospective, single center, case-control | 62 CD pts and 89 healthy control | children and adults | PCR-SSO | HLA-DQB1*0201 allele dose | 30/31/1 |
| Eller et al. (2006) [39] | Israel | prospective, single center, cross-sectional | 175 Beduin kindred | children and adults | PCR-SSO | HLA-DQB1*0201 allele dose | 3/3/0 |
| Greco et al. (1998) [40] | Italy | prospective, single center, cross-sectional | 145 CD pts | children | PCR-SSO | HLA-DQB1*02 allele dose | 46/84/15 |
| Gudjonsdottir et al. (2009) [23] | Sweden, Norway | prospective, multi-center, cross-sectional | 224 CD pts (HLA status was available: 98 pts) | children and adults | PCR-SSO | HLA-DQ genotype | 40/52/6 |
| Hanif et al. (2017) [24] | Pakistan | prospective, single center, observational | 12 CD pts | children | PCR | HLA-DQ genotype | 5/7/0 |
| Jores et al. (2007) [12] | Italy | retrospective, single center, cross-sectional | 187 CD pts | children | PCR-SSO | HLA-DQB1*0201 allele dose | 77/93/17 |
| Kabatova et al. (2017) [25] | Slovakia | retrospective, single center, cross-sectional | 258 CD pts (HLA status was available: 217 pts) | children | PCR-SSP | HLA-DQ genotype | 42/97/78 |
| Karinen et al. (2006) [41] | Finland | prospective, single center, cross-sectional | 144 CD pts (only siblings from 52 families) | adults | PCR-SSP | HLA-DQB1*0201 allele dose | 32/103/9 |
| Mohammed et al. (2014) [42] | Egypt | prospective, single center, case-control | 31 CD/T1DM pts | children and adults | PCR-SSP | HLA-DQB1*02 allele dose | 16/8/7 |
| Nenna et al. (2008) [43] | Italy | prospective, single center, cross-sectional | 124 CD pts | children | PCR-SSP | HLA-DQB1*02 allele dose | 26/85/13 |
| Ros et al. (2010) [26] | Spain | retrospective, single center, cross-sectional | 396 CD pts | children | PCR-SSO | HLA-DQ genotype | 168/206/17 |
| Rostami-Nejad et al. (2014) [8] | Iran | retrospective, multicenter, case-control | 59 CD pts and 151 healthy control | children and adults | PCR-SSP | HLA-DQ genotype | 15/30/14 |
| Schweiger et al. (2016) [27] | Slovenia | prospective, single center, case-control | 68 CD pts vs 69 CD/T1DM pts | children | PCR-SSO and -SSP | HLA-DQ genotype | 41/81/12 |
| Thomas et al. (2009) [44] | UK | retrospective, single center, cross-sectional | 384 CD pts (HLA status was available: 360 pts) | adults | PCR-SSP | HLA-DQB1*0201 allele dose | 71/247/42 |
| Vegas-Sanchez et al. (2015) [45] | Spain | retrospective, single center, cross-sectional | 14 CD pts | adults | PCR-SSO | HLA-DQB1*0201 allele dose | 2/7/3 |
| Vermeulen et al. (2009) [28] | The Netherlands | retrospective, single center, cross-sectional | 113 CD pts | children | PCR-SSO | HLA-DQ genotype | 45/58/10 |
| Viken et al. (2017) [46] | Norway | retrospective, multicenter, case-control | 327 CD pts and 215 CD/T1DM pts | children | PCR-SSP | HLA-DQB1*0201 allele dose | 141/321/78 |
| Zubillaga et al. (2002) [47] | Spain | prospective, single center, cross-sectional | 133 CD pts | children | PCR-SSP | HLA-DQB1*02 allele dose | 63/63/7 |
CD: celiac disease; PCR-SSP: polymerase chain reaction with sequence-specific primers; PCR-SSO: polymerase chain reaction with sequence-specific oligonucleotide probes, Pts: patients RT-PCR: real-time polymerase chain reaction; T1DM: type 1 diabetes mellitus.
Table 2. Results of meta-analysis.
| Outcomes, subgroups by age |
Double vs. single dose of HLA-DQB1*02 | Double vs. zero dose of HLA-DQB1*02 | ||||
|---|---|---|---|---|---|---|
| N0 of patients | OR (95% CI), p-value | Heterogeneity (I2, chi2) |
N0 of patients | OR (95% CI), p-value | Heterogeneity (I2, chi2) |
|
| Atrophic vs. non-atrophic | 722 | 0.991 (0.406–2.420), p = 0.984 | 11.8%, p = 0.338 | 430 | 2.626 (1.060–6.505), p = 0.037* | 21.3%, p = 0.260 |
| children | 237 | 1.729 (0.319–9.370), p = 0.525 | 71.6%, p = 0.061* | 159 | 1.757 (0.236–13096), p = 0.583 | 0.0%, p = 0.542 |
| adults | 379 | 0.537 (0.175–1.652), p = 0.278 | 0.0%, p = 0.682 | 200 | 2.534 (0.675–9.507), p = 0.168 | 0.0%, p = 0.945 |
| Marsh 3c vs. Marsh 3a-b | 862 | 0.870 (0.514–1.470), p = 0.602 | 39.7%, p = 0.127 | 418 | 0.822 (0.333–2.032), p = 0.671 | 46.8%, p = 0.068* |
| children | 399 | 0.821 (0.401–1.681), p = 0.590 | 0.0%, p = 0.397 | 251 | 0.975 (0.296–3.208), p = 0.967 | 65.2%, p = 0.035* |
| adults | 442 | 0.957 (0.420–2.184), p = 0.918 | 82.4%, p = 0.017* | 147 | 0.753 (0.157–3.599), p = 0.722 | 50.2%, p = 0.134 |
| Classical vs. non-classical | 458 | 1.758 (1.148–2.692), p = 0.009* | 0.0%, p = 0.744 | 221 | 1.701 (0.725–3.991), p = 0.222 | 40.7%, p = 0.168 |
| children | 305 | 2.082 (1.189–3.646), p = 0.010* | 0.0%, p = 0.609 | 81 | 3.139 (1.142–8.630), p = 0.027* | 0.0%, p = 0.747 |
| Diarrhea vs. non-diarrhea | 934 | 1.147 (0.863–1.523), p = 0.345 | 0.0%, p = 0.860 | 421 | 1.092 (0.655–1.818), p = 0.337 | 0.0%, p = 0.856 |
| children | 616 | 1.143 (0.819–1.593), p = 0.432 | 0.0%, p = 0.727 | 308 | 1.111 (0.569–2.170), p = 0.758 | 0.0%, p = 0.724 |
| adults | 318 | 1.158 (0.671–1.998), p = 0.599 | 0.0%, p = 1.000 | 113 | 1.065 (0.484–2.342), p = .0875 | 0.0%, p = 1.000 |
| Type 1 diabetes mellitus | 840 | 0.914 (0.437–1.912), p = 0.811 | 71.8%, p = 0.006* | 411 | 1.169 (0.410–3.331), p = 0.770 | 89.8%, p<0.001* |
| children | 766 | 0.597 (0.218–1.634), p = 0.315 | 79.3%, p = 0.008* | 365 | 0.242 (0.045–1.312), p = 0.100 | 79.4%, p = 0.008* |
| MD (95% CI), p-value | Heterogeneity (I2, chi2) |
MD (95% CI), p-value | Heterogeneity (I2, chi2) |
|||
| Age at diagnosis | 512 | -0.523 (-1.630 to 0.585), p = 0.355 | 28.6%, p = 0.231 | 147 | -7.332 (-19.833 to 5.169), p = 0.250 | 71.4%, p = 0.015* |
| children | 377 | -0.303 (-1.156 to 0.551), p = 0.487 | 5.5%, p = 0.366 | 106 | -2.026 (-5.824 to 1.771), p = 0.296 | 48.7%, p = 0.142 |
| adults | 133 | -5.000 (-10.876 to 0.876), p = 0.095 | 0.0%, p = 1.000 | 41 | -15.000 (-25.509 to -4.491), p = 0.005* | 0.0%, p = 1.000 |
Asterisks indicate a p<0.05 for OR and MD, and a p<0.10 for heterogeneity tested with chi2-test. CI: confidence interval; OR: odds ratio; MD: mean difference.
Clinical presentation
Five studies [22, 23, 38, 43, 47] were included in the comparison of classical vs. non-classical CD regarding double vs. single dose of HLA-DQB1*02; of them, four [22, 23, 38, 43] were included in the analysis regarding double vs. zero dose of HLA-DQB1*02. Patients with a double dose of HLA-DQB1*02 had classical CD more frequently, compared to those having a single dose of the allele (OR = 1.758, CI: 1.148 to 2.692, p = 0.009) in a homogeneous dataset (I2 = 0.0%, p = 0.744) (Fig 2). The difference was more prominent in the subgroup of children (OR = 2.082, CI: 1.189 to 3.646, p = 0.010) in a homogeneous dataset (I2 = 0.0%, p = 0.609) (Fig 2). In the analysis of a double dose of HLA-DQB1*02 vs. a zero dose of the allele, we detected a significant gene dose effect only if children were included in the analysis (OR = 3.139, CI: 1.142 to 8.630, p = 0.027) in a homogeneous dataset (I2 = 0.0%, p = 0.747) (Fig 3). Setting up the subgroup of children reduced the heterogeneity from 40.7% to 0.0% (Fig 3).
Fig 2. Odds ratios of classical presentation of CD at diagnosis with double dose vs. single dose of HLA-DQB1*02.

Patients with a double dose of HLA-DQB1*02 had classical CD more frequently compared to those having a single dose. This association was more prominent in children. Heterogeneity of the groups overall: I2 = 0.0%, p = 0.744; heterogeneity of the subgroup of children: I2 = 0.0%, p = 0.609. CI: confidence interval.
Fig 3. Odds ratios of classical presentation of CD at diagnosis with double dose vs. zero dose of HLA-DQB1*02.

A significant gene dose effect was detected in the subgroup of children. Heterogeneity of the groups overall: I2 = 40.7%, p = 0.168; heterogeneity of the subgroup of children: I2 = 0.0%, p = 0.747. CI: confidence interval.
Five studies [24, 26, 28, 40, 44] reported on the presence of diarrhea at diagnosis, all were included in the analysis of double vs. single dose of HLA-DQB1*02 and that of double vs. zero dose of the allele, as well. We failed to detect a significant gene dose effect, nor in the subgroups of children and adults in a homogeneous dataset (I2 = 0.0%) (Table 2, S1 and S2 Figs).
Age at diagnosis
Four [28, 36, 41, 43] and five studies [28, 36, 41, 43, 47] were included in the comparison of double vs. zero dose of HLA-DQB1*02 and double vs. single dose of the allele concerning age at diagnosis, respectively. Patients with a double dose of HLA-DQB1*02 were similar in age at diagnosis, compared to their counterparts with single and zero doses of the allele (MD: -0.523, CI: -1.630 to 0.585, p = 0.355; I2 = 28.60% and MD: -7.332, CI: -19.833 to 5.169, p = 0.250; I2 = 71.4% respectively) (S3 and S4 Figs). In the subgroup of children, heterogeneity was considerably reduced (Table 2).
Histology at diagnosis
Eight studies [8, 19, 25, 37, 42–45] were eligible for inclusion in the comparison of atrophic vs. non-atrophic histology, all were included in the analysis of double vs. single dose of HLA-DQB1*02 and that of double vs. zero dose of the allele, as well. Villous atrophy at diagnosis was not more frequent in patients with a double dose of HLA-DQB1*02, as compared to a single dose of the allele (OR = 0.991, CI: 0.406 to 2.420, p = 0.984) in a homogeneous dataset (I2 = 11.8%, p = 0.338) (Fig 4). In contrast, patients with a double dose of the allele were more likely to have villous atrophy at diagnosis than those with a zero dose of the allele (OR = 2.626, CI: 1.060 to 6.505, p = 0.037) (Fig 5). The subgroup analysis of children and adults did not result in significances across groups (Figs 4 and 5, Table 2).
Fig 4. Odds ratios of atrophic histology at diagnosis with double dose vs. single dose of HLA-DQB1*02.

We failed to detect a significant gene dose effect regarding diagnostic histology. Heterogeneity of the groups overall: I2 = 11.8%, p = 0.338; heterogeneity of the subgroup of adults: I2 = 0.0%, p = 0.682; heterogeneity of the subgroup of children: I2 = 71.6%, p = 0.061. CI: confidence interval.
Fig 5. Odds ratios of atrophic histology at diagnosis with double dose vs. zero dose of HLA-DQB1*02.

Patients with a double dose of the allele were more likely to have villous atrophy at diagnosis than those with a single dose of the allele. Heterogeneity of the groups overall: I2 = 21.3%, p = 0.260; heterogeneity of the subgroup of adults: I2 = 0.0%, p = 0.945; heterogeneity of the subgroup of children: I2 = 0.0%, p = 0.542. CI: confidence interval.
Regarding the severity of villous atrophy, seven [12, 24, 25, 41–44] and eight studies [12, 24, 25, 41–45] were eligible for inclusion in the analysis of double vs. single dose of HLA-DQB1*02 and that of double vs. zero dose of the allele. Marsh 3c at diagnosis was not more frequent in patients with a double dose of HLA-DQB1*02, as compared to single and zero doses of the allele (OR = 0.870, CI: 0.514 to 1.470, p = 0.602 [I2 = 39.7%, p = 0.127] and OR = 0.822, CI: 0.333 to 2.032, p = 0.671 [I2 = 46.8%, p = 0.068], respectively). These remained unchanged in the subgroups of children and adults (S5 and S6 Figs, Table 2).
Type 1 diabetes mellitus
Five [20, 21, 27, 39, 46] studies were included in the analysis of double vs. single dose of HLA-DQB1*02; of them, four [20, 21, 27, 46] were eligible for inclusion in the analysis of double vs. zero dose of the allele. Analyses revealed no significant gene dose effect concerning the coexistence of type 1 diabetes mellitus and CD, which remained unchanged in the subgroups of children and adults. All analyses suffered from significant heterogeneity (S7 and S8 Figs, Table 2).
Other patient and disease characteristics
There were several reports on the association between HLA-DQ2 gene dose effect and the clinical phenotype of CD (age at onset, anemia, serology, autoimmunity, body mass index, osteoporosis, oral manifestations, complicated CD, and dermatitis herpetiformis). Data reported were insufficient for quantitative synthesis. We report the studies and the direction of associations with HLA-DQ gene dose in Table 3.
Table 3. Summary of studies reporting on gene dose effect.
| Characteristics | Association between HLA-DQ2 gene dose and the clinical phenotype | ||
|---|---|---|---|
| Positive | No association | Negative | |
| Clinical presentation | [38, 41, 43, 47, 51, 66, 69, 79] | [7, 12, 23, 26, 28, 36, 40, 44, 61, 71, 72, 74] | |
| Age at onset | [47] | [26, 40, 45, 53, 71, 73, 75–77] | |
| Age at diagnosis | [38, 41, 47, 66] | [28, 36, 40, 44, 71, 72] | [13, 68] |
| Histology at diagnosis | [12, 37, 41, 43, 78] | [7, 28, 36, 44, 53, 69, 71] | |
| Anemia | [41] | [26, 36, 40, 43, 44] | |
| Serology | [7, 42, 43, 67, 69, 70] | [36, 44, 48, 59, 65, 71, 78] | |
| Autoimmunity | [27, 39, 62] | [64] | [46, 54] |
| Body mass index | [26, 44] | ||
| Osteoporosis | [44] | ||
| Oral manifestations (DED, RAS) | [55, 63] | [44] | |
| Complicated disease (RCD, EATL, SBC) | [14, 49, 50, 64] | [58] | |
| Dermatitis herpetiformis | [57] | ||
DED: dental enamel defect; EATL: enteropathy-associated T-cell lymphoma; RAS: recurrent aphthous stomatitis; RCD: refractory celiac disease; SBC: small bowel carcinoma.
Publication bias
Although funnel plots seem symmetric, the low number of studies raised concerns about an uncertain assessment of symmetry (S3 Appendix).
Sensitivity analysis
When we omitted studies one-by-one, there was no change in the direction of the main association, except for two outcomes. Omitting Zubillaga et al. from the analysis on classic vs. non-classic clinical presentation resulted in the loss of statistical significance in the comparison of double vs. single dose. Omitting Vermeulen et al. from the analysis on age at diagnosis, resulted in a significant gene dose effect (MD = -0.248, CI: -0.464 to -0.032, p = 0.024) in the comparison of double vs. single dose.
Risk of bias assessment
Results of risk of bias assessment are presented in Fig 6. Ten out of 24 studies (41.7%) aimed to analyze gene dose effect primarily. Twenty-two out of 24 (91.7%) and 18 out of 24 (75.0%) studies used a low-risk classification for diagnosing CD and rating diagnostic histology, respectively. However, the average CD population was clearly represented only in 62.5% of the studies included. Appropriate blinding was applied in only one study (4.2%).
Fig 6. Summary of risk of bias in individual studies included in meta-analysis.
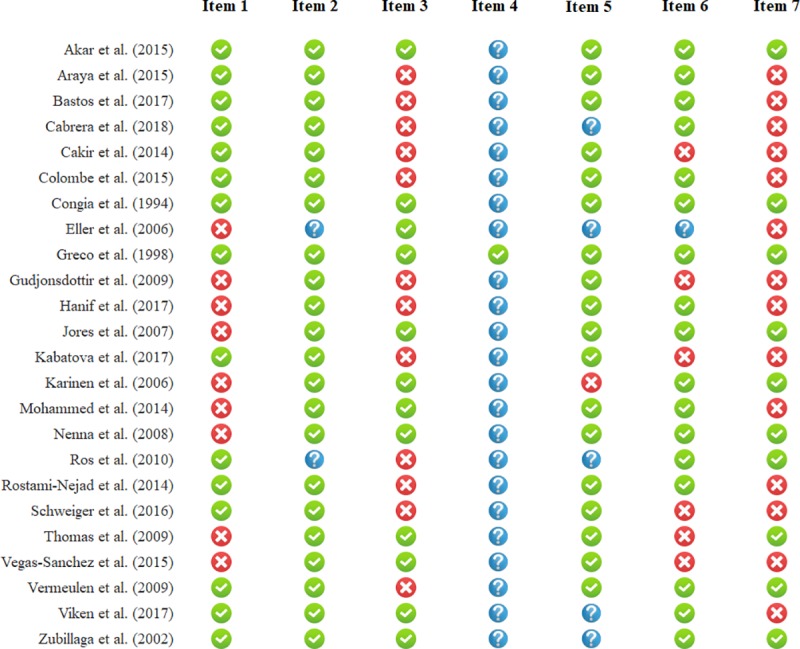
Green, red, and blue icons represent low, high, and uncertain risk of bias. Definitions of items are provided in S1 Table.
Discussion
We aimed to review the current knowledge about the influence of HLA-DQB1*02 gene dose on the phenotype of celiac disease in our study.
Although reasonable molecular mechanisms have been proposed by in vitro experiments [5, 6], gene dose effect seemed to influence only the clinical phenotype defined by Oslo criteria and histology. Patients with a double dose of HLA-DQB1*02 exhibited more often classical phenotype and villous atrophy, as compared to those with a single dose of the allele, whereas no evidence of gene dose effect was collected on diarrhea, age at diagnosis, the severity of villous atrophy, and the frequency of type 1 diabetes mellitus (Table 2).
Lack of clinically significant gene dose effect is also supported by experimental results, as well: (1) an equal magnitude of specific T-cell responses characterizes homo- and heterozygotes, (2) the amount of DQA1*05 and DQB1*02 mRNS in heterozygotes exceeded the expected 50% of that measured in homozygotes [80]. Other factors should be taken into consideration, e.g., complementing HLA risk stratification with ten non-HLA loci changed the allocation of 10% of study population from the moderate- to the high-risk group [81]. The effect of non-HLA loci may outweigh that of HLA. In addition, non-genetic (environmental) factors appear to contribute to CD phenotype [23, 28, 40].
Concerning comorbid conditions, data allowed us to perform analysis only on type 1 diabetes mellitus, which is the most frequent co-existing immune-mediated disorder in CD. We failed to observe a significant gene dose effect in the frequency of type 1 diabetes mellitus. This corroborates with previous studies confirming that the combined occurence of DQ2 and DQ8 is high in patients with both CD and type 1 diabetes mellitus [27, 46, 54].
Although we were unable to meta-analyze other disease complications due to discrepancies in reporting, the importance of HLA-DQ2 gene dose might be highlighted by these studies (Table 3). HLA status appears to be important in the development of malignant complications. Lymphomatous complications were more frequent in patients with a double dose of HLA-DQ2 in a study [64]. In a prospective study conducted by Al-Toma et al., HLA-DQ2.5 homozygosity was associated with serious CD complications, namely, type 2 refractory celiac disease and enteropathy-associated T-cell lymphoma [14]. Prevalence of DQ2 homozygosity was significantly higher in patients with a complicated disease (i.e., patients with type 1 and type 2 refractory CD, EATL, or SBC), as compared to those with non-complicated CD in a retrospective Italian and a multicentre study [49, 50]. However, it is noteworthy that data of Howell et al. did not confirm these observations [58]. Further studies aiming to resolve these controversies are awaited to test whether determining HLA gene dose is appropriate for risk stratification for severe complications.
Strengths and limitations
To date, no meta-analyses have investigated HLA-DQB1*02 gene dose effect in CD. Our main strength is the transparent and comprehensive search and the rigorous selection process; however, we must acknowledge that the evidence is limited due to a number of reasons.
We did not contact the original authors of the included or excluded papers to acquire further information; only published material was used to preserve reproducibility.
Data on the clinical phenotype of celiac disease were collected from patients’ files retrospectively. Regarding HLA status, HLA-typing was performed (1) at the time of enrolment to the study (at or after the diagnosis of celiac disease) or (2) before enrolment (retrospectively collected from charts). In relation to the outcomes, both ways are retrospective. However, HLA is a genetic marker, an unchangeable feature of the patients. Therefore, in our opinion, timing of HLA-typing does not affect data quality.
Design of the studies included were (1) controlled studies including celiac and non-celiac subjects (case-control or cross-sectional studies) or (2) uncontrolled case series reports of celiac patients. In this meta-analysis, data on celiac patients were desirable, exclusively (while the non-celiac groups were irrelevant for us). As a consequence, there were studies included not aiming to analyze gene dose effect, as a primary objective, which may limit the data reported from the studies.
The number of eligible studies was low, not allowing us to draw reliable conclusions from the symmetry of the funnel plots to assess small-study effect (S3 Appendix).
Relevant clinical questions as to whether gene dose effects anemia, complications of CD, or serology have not been meta-analyzed due to incoherent data reporting across studies (S2 Table).
As only nine studies typed HLA-DQB1*0201 [12, 36–39, 41, 44–46] (the rest of them typed DQB1*02 allele [40, 42, 43, 47]), our conclusion is not generalizable to the role of HLA-DQB1*0201 which may be of greater clinical importance. DQB1*02 allele dose was calculated from DQ2 haplotype-based HLA risk stratification systems in eleven studies [8, 19–28].
Self-reported clinical symptoms (e.g., bloating, diarrhea, and abdominal discomfort) are difficult to quantify objectively. To minimize the distortion, we used the widely accepted Oslo classification (i.e., dichotomization of patients into classical [with malabsorption] and non-classical [without malabsorption] phenotypes) [16].
Some analyses suffer from statistical heterogeneity (Table 2) which can be explained by methodological heterogeneity (i.e., histological assessment, HLA-typing, inclusion and exclusion of subjects) and clinical heterogeneity (i.e., geography, diverse environmental factors [e.g., timing of gluten introduction], and genetics [i.e., HLA and non-HLA loci]). A part of heterogeneity may originate from the age of participants: heterogeneity reduced when analyzing data from children and adults separately in some analysis, while persisted in others (Table 2).
Conclusion
Implications for clinical practice
Our results suggest a significant gene dose effect regarding clinical presentation: classical clinical presentation and villous atrophy are more frequent in patients with a double dose of HLA-DQB1. We were unable to prove a similar effect in terms of diarrhea at diagnosis, age at diagnosis, the degree of atrophy, and type 1 diabetes mellitus. Recent guidelines do not require HLA-typing to set up the diagnosis of CD apart from pediatric cases diagnosed without intestinal biopsy. The role of it is mainly restricted to the exclusion of CD [82, 83]. Patients with high-risk HLA status may be at higher risk of severe disease course, raising concerns about the need for a stricter gluten-free diet and follow-up. However, these results should be treated with caution due to the limitations of the data available for our study.
Implications for research
Studies validating our results and investigating the association between gene dose effect and disease complications (e.g., malignant tumors [EATL, SBC], autoimmune disorders, and RCD) are awaited.
Supporting information
(DOCX)
(DOCX)
(XLSX)
CI: confidence interval.
(DOCX)
CI: confidence interval.
(DOCX)
CI: confidence interval.
(DOCX)
CI: confidence interval.
(DOCX)
CI: confidence interval.
(DOCX)
CI: confidence interval.
(DOCX)
CI: confidence interval.
(DOCX)
CI: confidence interval.
(DOCX)
(DOC)
(TXT)
(DOCX)
Data Availability
All relevant data are within the paper and its Supporting Information files.
Funding Statement
This work was supported by an Economic Development and Innovation Operative Programme Grant, GINOP 2.3.2-15-2016-00048 to PH; a Human Resources Development Operational Programme of the European Union and the Hungarian Government EFOP-3.6.2-16-2017-0006 and EFOP-3.6.3-VEKOP-16-2017-00009 to PH; and by New National Excellence Program of the Ministry of Human Capacities, ÚNKP-17-3-II and ÚNKP-18-3-I to ZS. The funders had no role in study design, data collection and analysis, decision to publish, or preparation of the manuscript.
References
- 1.Hill ID, Fasano A, Guandalini S, Hoffenberg E, Levy J, Reilly N, et al. NASPGHAN clinical report on the diagnosis and treatment of gluten-related disorders. J Pediatr Gastroenterol Nutr. 2016; 63(1):156–65. 10.1097/MPG.0000000000001216 [DOI] [PubMed] [Google Scholar]
- 2.Korponay-Szabo IR, Troncone R, Discepolo V. Adaptive diagnosis of coeliac disease. Best Pract Res Clin Gastroenterol. 2015; 29(3):381–98. Epub 2015/06/11. 10.1016/j.bpg.2015.05.003 . [DOI] [PubMed] [Google Scholar]
- 3.Kupfer SS, Jabri B. Pathophysiology of celiac disease. Gastrointest Endosc Clin N Am. 2012; 22(4):639–60. 10.1016/j.giec.2012.07.003 PubMed Central PMCID: PMC3872820. [DOI] [PMC free article] [PubMed] [Google Scholar]
- 4.Tjon JM, van Bergen J, Koning F. Celiac disease: how complicated can it get? Immunogenetics. 2010; 62(10):641–51. 10.1007/s00251-010-0465-9 PubMed Central PMCID: PMC2944025. [DOI] [PMC free article] [PubMed] [Google Scholar]
- 5.Vader W, Stepniak D, Kooy Y, Mearin L, Thompson A, van Rood JJ, et al. The HLA-DQ2 gene dose effect in celiac disease is directly related to the magnitude and breadth of gluten-specific T cell responses. Proc Natl Acad Sci U S A. 2003; 100(21):12390–5. Epub 2003/10/08. 10.1073/pnas.2135229100 ; PubMed Central PMCID: PMCPmc218768. [DOI] [PMC free article] [PubMed] [Google Scholar]
- 6.Koning F. Celiac disease: quantity matters. Semin Immunopathol. 2012; 34(4):541–9. Epub 2012/06/27. 10.1007/s00281-012-0321-0 ; PubMed Central PMCID: PMCPmc3410019. [DOI] [PMC free article] [PubMed] [Google Scholar]
- 7.Delgado JF, Amengual MJ, Veraguas A, Rodriguez E, de Los Santos MM, Guallarte MP. Paediatric celiac patients carrying the HLA-DR7-DQ2 and HLA-DR3-DQ2 haplotypes display small clinical differences. Acta Paediatr. 2014; 103(6):e238–42. Epub 2014/03/19. 10.1111/apa.12605 . [DOI] [PubMed] [Google Scholar]
- 8.Rostami-Nejad M, Romanos J, Rostami K, Ganji A, Ehsani-Ardakani MJ, Bakhshipour AR, et al. Allele and haplotype frequencies for HLA-DQ in Iranian celiac disease patients. World J Gastroenterol. 2014; 20(20):6302–8. Epub 2014/05/31. 10.3748/wjg.v20.i20.6302 ; PubMed Central PMCID: PMCPmc4033468. [DOI] [PMC free article] [PubMed] [Google Scholar]
- 9.Medrano LM, Dema B, Lopez-Larios A, Maluenda C, Bodas A, Lopez-Palacios N, et al. HLA and celiac disease susceptibility: new genetic factors bring open questions about the HLA influence and gene-dosage effects. PLoS One. 2012; 7(10):e48403 Epub 2012/11/03. 10.1371/journal.pone.0048403 ; PubMed Central PMCID: PMCPmc3485232. [DOI] [PMC free article] [PubMed] [Google Scholar]
- 10.van Belzen MJ, Koeleman BP, Crusius JB, Meijer JW, Bardoel AF, Pearson PL, et al. Defining the contribution of the HLA region to cis DQ2-positive coeliac disease patients. Genes Immun. 2004; 5(3):215–20. Epub 2004/03/12. 10.1038/sj.gene.6364061 . [DOI] [PubMed] [Google Scholar]
- 11.Mearin ML, Biemond I, Pena AS, Polanco I, Vazquez C, Schreuder GT, et al. HLA-DR phenotypes in Spanish coeliac children: their contribution to the understanding of the genetics of the disease. Gut. 1983; 24(6):532–7. [DOI] [PMC free article] [PubMed] [Google Scholar]
- 12.Jores RD, Frau F, Cucca F, Grazia Clemente M, Orru S, Rais M, et al. HLA-DQB1*0201 homozygosis predisposes to severe intestinal damage in celiac disease. Scand J Gastroenterol. 2007; 42(1):48–53. Epub 2006/12/28. 10.1080/00365520600789859 . [DOI] [PubMed] [Google Scholar]
- 13.Ploski R, Ek J, Thorsby E, Sollid LM. On the HLA-DQ(alpha 1*0501, beta 1*0201)-associated susceptibility in celiac disease: a possible gene dosage effect of DQB1*0201. Tissue Antigens. 1993; 41(4):173–7. Epub 1993/04/01. 10.1111/j.1399-0039.1993.tb01998.x . [DOI] [PubMed] [Google Scholar]
- 14.Al-Toma A, Goerres MS, Meijer JW, Pena AS, Crusius JB, Mulder CJ. Human leukocyte antigen-DQ2 homozygosity and the development of refractory celiac disease and enteropathy-associated T-cell lymphoma. Clin Gastroenterol Hepatol. 2006; 4(3):315–9. Epub 2006/03/11. 10.1016/j.cgh.2005.12.011 . [DOI] [PubMed] [Google Scholar]
- 15.Moher D, Liberati A, Tetzlaff J, Altman DG, Group P. Preferred reporting items for systematic reviews and meta-analyses: the PRISMA statement. J Clin Epidemiol. 2009; 62(10):1006–12. 10.1016/j.jclinepi.2009.06.005 . [DOI] [PubMed] [Google Scholar]
- 16.Ludvigsson JF, Leffler DA, Bai JC, Biagi F, Fasano A, Green PH, et al. The Oslo definitions for coeliac disease and related terms. Gut. 2013; 62(1):43–52. 10.1136/gutjnl-2011-301346 [DOI] [PMC free article] [PubMed] [Google Scholar]
- 17.Marsh MN. Gluten, major histocompatibility complex, and the small intestine. A molecular and immunobiologic approach to the spectrum of gluten sensitivity ('celiac sprue'). Gastroenterology. 1992; 102(1):330–54. Epub 1992/01/01. 10.1016/0016-5085(92)91819-P . [DOI] [PubMed] [Google Scholar]
- 18.Oberhuber G, Granditsch G, Vogelsang H. The histopathology of coeliac disease: time for a standardized report scheme for pathologists. Eur J Gastroenterol Hepatol. 1999; 11(10):1185–94. Epub 1999/10/19. 10.1097/00042737-199910000-00019 . [DOI] [PubMed] [Google Scholar]
- 19.Araya M, Oyarzun A, Lucero Y, Espinosa N, Perez-Bravo F. DQ2, DQ7 and DQ8 Distribution and Clinical Manifestations in Celiac Cases and Their First-Degree Relatives. Nutrients. 2015; 7(6):4955–65. Epub 2015/06/23. 10.3390/nu7064955 ; PubMed Central PMCID: PMCPmc4488825. [DOI] [PMC free article] [PubMed] [Google Scholar]
- 20.Bastos MD, Kowalski TW, Punales M, Tschiedel B, Mariath LM, Pires ALG, et al. Search for DQ2.5 and DQ8 alleles using a lower cost technique in patients with type 1 diabetes and celiac disease in a population of southern Brazil. Arch Endocrinol Metab. 2017; 61(6):550–5. Epub 2017/07/21. 10.1590/2359-3997000000282 . [DOI] [PMC free article] [PubMed] [Google Scholar]
- 21.Cabrera CM, Mendez-Lopez IM, Caballero A. Risk variation in celiac disease in a population from Southern Spain: evaluating the influence of the DQB1*02:02 allele frequency. Scand J Gastroenterol. 2018; 53(3):266–72. Epub 2018/01/25. 10.1080/00365521.2018.1430253 . [DOI] [PubMed] [Google Scholar]
- 22.Cakir M, Baran M, Uçar F, Akbulut UE, Kaklıkkaya N, Ersöz Ş. Accuracy of HLA-DQ genotyping in combination with IgA anti-tissue transglutaminase serology and a “scoring system” for the diagnosis of celiac disease in Turkish children. Turk J Pediatr. 2014; 56(4):347–53. [PubMed] [Google Scholar]
- 23.Gudjonsdottir AH, Nilsson S, Naluai AT, Ek J, Amundsen SS, Wahlstrom J, et al. Association between genotypes and phenotypes in coeliac disease. J Pediatr Gastroenterol Nutr. 2009; 49(2):165–9. Epub 2009/06/23. 10.1097/MPG.0b013e318196c362 . [DOI] [PubMed] [Google Scholar]
- 24.Hanif MFM MK, Luck NH, Abbas Z, Mubarak M, Laeeq SM, Tasneem AA. Clinicopathological study of seronegative celiac disease in adults in Pakistan: a pilot study. Middle East J Dig Dis. 2017; 9(2):94 10.15171/mejdd.2017.57 [DOI] [PMC free article] [PubMed] [Google Scholar]
- 25.Kabatova J, Hustak R. The role of serological testing and hla genotyping in the diagnosis of celiac disease in Slovak Cohort. can duodenal biopsies be omitted? Int J Celiac Dis. 2017; 5(3):104–7. 10.12691/ijcd-5-3-9 [DOI] [Google Scholar]
- 26.Ros I, Ros L, Sanchez-Valverde F, Gimeno JJ. Hla-genotype doesn't influence on celiac disease phenotype. J Pediatr Gastroenterol Nutr. 2010; 50:E75 10.1097/01.mpg.0000383075.98243.67 [DOI] [Google Scholar]
- 27.Schweiger DS, Mendez A, Jamnik SK, Bratanic N, Bratina N, Battelino T, et al. High risk genotypes HLA-DR3-DQ2/DR3-DQ2 and DR3-DQ2/DR4-DQ8 in co-occurence of type 1 diabetes and celiac disease. Hla. 2016; 87(4):233-. 10.3109/08916934.2016.1164144 WOS:000383951500078. [DOI] [PubMed] [Google Scholar]
- 28.Vermeulen BA, Hogen Esch CE, Yuksel Z, Koning F, Verduijn W, Doxiadis II, et al. Phenotypic variance in childhood coeliac disease and the HLA-DQ/DR dose effect. Scand J Gastroenterol. 2009; 44(1):40–5. Epub 2008/10/22. 10.1080/00365520802116422 . [DOI] [PubMed] [Google Scholar]
- 29.DerSimonian R, Laird N. Meta-analysis in clinical trials. Control Clin Trials. 1986; 7(3):177–88. 10.1016/0197-2456(86)90046-2 . [DOI] [PubMed] [Google Scholar]
- 30.Higgins J, Green S, Collaboration TC. Cochrane Handbook for Systematic Reviews of Interventions. 2011.
- 31.Ciccocioppo R, Kruzliak P, Cangemi GC, Pohanka M, Betti E, Lauret E, et al. The Spectrum of Differences between Childhood and Adulthood Celiac Disease. Nutrients. 2015; 7(10):8733–51. 10.3390/nu7105426 [DOI] [PMC free article] [PubMed] [Google Scholar]
- 32.Poddar U. Pediatric and adult celiac disease: similarities and differences. Indian J Gastroenterol. 2013; 32(5):283–8. Epub 2013/05/30. 10.1007/s12664-013-0339-9 . [DOI] [PubMed] [Google Scholar]
- 33.Tanpowpong P, Broder-Fingert S, Katz AJ, Camargo CA Jr. Age-related patterns in clinical presentations and gluten-related issues among children and adolescents with celiac disease. Clin Transl Gastroenterol. 2012; 3:e9 10.1038/ctg.2012.4 PubMed Central PMCID: PMC3365672. [DOI] [PMC free article] [PubMed] [Google Scholar]
- 34.Vivas S, Ruiz de Morales JM, Fernandez M, Hernando M, Herrero B, Casqueiro J, et al. Age-related clinical, serological, and histopathological features of celiac disease. Am J Gastroenterol. 2008; 103(9):2360–5. 10.1111/j.1572-0241.2008.01977.x . [DOI] [PubMed] [Google Scholar]
- 35.Vivas S, Vaquero L, Rodriguez-Martin L, Caminero A. Age-related differences in celiac disease: Specific characteristics of adult presentation. World J Gastrointest Pharmacol Ther. 2015; 6(4):207–12. 10.4292/wjgpt.v6.i4.207 [DOI] [PMC free article] [PubMed] [Google Scholar]
- 36.Akar HH, Yildiz M, Sevinc E, Sokucu S. The influence of HLA-DQ2 heterodimers on the clinical features and laboratory of patients with celiac disease. Nutr Hosp. 2015; 32(6):2594–9. Epub 2015/12/17. 10.3305/nh.2015.32.6.9733 . [DOI] [PubMed] [Google Scholar]
- 37.Colombe BW. The DQ2 allele, DQB1*02:02, differentiates mild from severe histology in adult celiac disease patients. Hum Immunol. 2015; 76:67. 10.1016/j.humimm.2015.07.095 [DOI] [Google Scholar]
- 38.Congia M, Cucca F, Frau F, Lampis R, Melis L, Clemente MG, et al. A gene dosage effect of the DQA1*0501/DQB1*0201 allelic combination influences the clinical heterogeneity of celiac disease. Hum Immunol. 1994; 40(2):138–42. Epub 1994/06/01. 10.1016/0198-8859(94)90059-0 . [DOI] [PubMed] [Google Scholar]
- 39.Eller E, Vardi P, Babu SR, Bugawan TL, Erlich HA, Yu L, et al. Celiac disease and HLA in a Bedouin kindred. Hum Immunol. 2006; 67(11):940–50. Epub 2006/12/06. 10.1016/j.humimm.2006.08.293 ; PubMed Central PMCID: PMCPmc1764604. [DOI] [PMC free article] [PubMed] [Google Scholar]
- 40.Greco L, Percopo S, Clot F, Bouguerra F, Babron MC, Eliaou JF, et al. Lack of correlation between genotype and phenotype in celiac disease. J Pediatr Gastroenterol Nutr. 1998; 26(3):286–90. Epub 1998/04/02. 10.1097/00005176-199803000-00009 . [DOI] [PubMed] [Google Scholar]
- 41.Karinen H, Karkkainen P, Pihlajamaki J, Janatuinen E, Heikkinen M, Julkunen R, et al. Gene dose effect of the DQB1*0201 allele contributes to severity of coeliac disease. Scand J Gastroenterol. 2006; 41(2):191–9. Epub 2006/02/18. 10.1080/00365520500206277 . [DOI] [PubMed] [Google Scholar]
- 42.Mohammed MA, Omar NM, Shebl AM, Mansour AH, Elmasry E, Othman G. Celiac disease prevalence and its HLA-genotypic profile in Egyptian patients with type 1 diabetes mellitus. Trends in Med Res. 2014; 9(2):81–97. 10.3923/tmr.2014.81.97 [DOI] [Google Scholar]
- 43.Nenna R, Mora B, Megiorni F, Mazzilli MC, Magliocca FM, Tiberti C, et al. HLA-DQB1*02 dose effect on RIA anti-tissue transglutaminase autoantibody levels and clinicopathological expressivity of celiac disease. J Pediatr Gastroenterol Nutr. 2008; 47(3):288–92. Epub 2008/08/30. 10.1097/MPG.0b013e3181615ca7 . [DOI] [PubMed] [Google Scholar]
- 44.Thomas HJ, Ahmad T, Rajaguru C, Barnardo M, Warren BF, Jewell DP. Contribution of histological, serological, and genetic factors to the clinical heterogeneity of adult-onset coeliac disease. Scand J Gastroenterol. 2009; 44(9):1076–83. Epub 2009/07/14. 10.1080/00365520903100473 . [DOI] [PubMed] [Google Scholar]
- 45.Vegas-Sanchez MDC, Calabia-González O, Llorente-Jiménez P, García-Delgado R. Predictive value and clinical utility of HLA-DQ typing in diagnosis of celiac disease in patients over 50. Rev del Lab Clínico. 2015; 8(3):131–7. 10.1016/j.labcli.2015.07.003 [DOI] [Google Scholar]
- 46.Viken MK, Flam ST, Skrivarhaug T, Amundsen SS, Sollid LM, Drivvoll AK, et al. HLA class II alleles in Norwegian patients with coexisting type 1 diabetes and celiac disease. Hla. 2017; 89(5):278–84. Epub 2017/03/02. 10.1111/tan.12986 . [DOI] [PubMed] [Google Scholar]
- 47.Zubillaga P, Vidales MC, Zubillaga I, Ormaechea V, Garcia-Urkia N, Vitoria JC. HLA-DQA1 and HLA-DQB1 genetic markers and clinical presentation in celiac disease. J Pediatr Gastroenterol Nutr. 2002; 34(5):548–54. Epub 2002/06/07. 10.1097/00005176-200205000-00014 . [DOI] [PubMed] [Google Scholar]
- 48.Agardh D, Lee HS, Kurppa K, Simell V, Aronsson CA, Jorneus O, et al. Clinical features of celiac disease: a prospective birth cohort. Pediatrics. 2015; 135(4):627–34. Epub 2015/03/04. 10.1542/peds.2014-3675 ; PubMed Central PMCID: PMCPmc4379464. [DOI] [PMC free article] [PubMed] [Google Scholar]
- 49.Biagi F, Bianchi PI, Vattiato C, Marchese A, Trotta L, Badulli C, et al. Influence of HLA-DQ2 and DQ8 on severity in celiac Disease. J Clin Gastroenterol. 2012; 46(1):46–50. Epub 2011/06/23. 10.1097/MCG.0b013e318221077e . [DOI] [PubMed] [Google Scholar]
- 50.Biagi F, Schiepatti A, Malamut G, Marchese A, Cellier C, Bakker SF, et al. PROgnosticating COeliac patieNts SUrvivaL: The PROCONSUL score. PLoS One. 2014; 9(1):e84163 10.1371/journal.pone.0084163 [DOI] [PMC free article] [PubMed] [Google Scholar]
- 51.Celestino S, Spagnut G, Melli P, Miotti V, Collarile P, De Carli S, et al. Association between clinical features and HLA genotyping in Celiac disease. Dig Liver Dis. 2011; 43:S430–S1. 10.1016/S1590-8658(11)60694-4 [DOI] [Google Scholar]
- 52.Ceylan GG, Kayaçetin S. HLA typing and histopathologic features of patients with celiac disease-A retrospective study. J Clin Anal Med. 2016; 7(3):335–8. 10.4328/JCAM.2790 [DOI] [Google Scholar]
- 53.Constantinidou NA, Moraloglou OS, Krini MG, Spanou KI, Varela II, Panagiotou IV, et al. HLA DR, DQ alleles and haplotypes associated with susceptibility and clinical traits of celiac disease. Tissue Antigens. 2009; 73(5):491–2. 10.1111/j.1399-0039.2009.01255.x [DOI] [Google Scholar]
- 54.Dezsofi A, Szebeni B, Hermann CS, Kapitany A, Veres G, Sipka S, et al. Frequencies of genetic polymorphisms of TLR4 and CD14 and of HLA-DQ genotypes in children with celiac disease, type 1 diabetes mellitus, or both. J Pediatr Gastroenterol Nutr. 2008; 47(3):283–7. Epub 2008/08/30. 10.1097/MPG.0b013e31816de885 . [DOI] [PubMed] [Google Scholar]
- 55.Erriu M, Abbate GM, Pili FMG, Novara F, Orrù G, Montaldo C, et al. Oral signs and HLA-DQB1*02 haplotypes in the celiac paediatric patient: A preliminary study. Autoimmune Dis. 2013; 2013 10.1155/2013/389590 [DOI] [PMC free article] [PubMed] [Google Scholar]
- 56.Ghawil M, Miotti V, Tonutti E, Tenore A, Hadeed I, Sindici C, et al. HLA-DQ types of celiac disease in Libyan children with type 1 diabetes mellitus. Eur J Gastroenterol Hepatol. 2012; 24(1):59–63. Epub 2011/10/18. 10.1097/MEG.0b013e32834d09d4 . [DOI] [PubMed] [Google Scholar]
- 57.Hall MA, Lanchbury JS, Ciclitira PJ. HLA class II region genes and susceptibility to dermatitis herpetiformis: PBb1 and TAP2 associations are secondary to those of the DQ subregion. Eur J Immunogenet. 1996; 23(4):285–96. 10.1111/j.1744-313X.1996.tb00124.x [DOI] [PubMed] [Google Scholar]
- 58.Howell WM, Leung ST, Jones DB, Nakshabendi I, Hall MA, Lanchbury JS, et al. HLA-DRB, -DQA, and -DQB polymorphism in celiac disease and enteropathy-associated T-cell lymphoma. Common features and additional risk factors for malignancy. Hum Immunol. 1995; 43(1):29–37. Epub 1995/05/01. 10.1016/0198-8859(94)00130-I . [DOI] [PubMed] [Google Scholar]
- 59.Klein S, Neuhausen S, Book L, Hoff C, Zone J. Lack Of Correlation Of Copy Number Of Hla Dqa1a* 05 Dqb1* 02 And Tissue Transglutaminase Levels In Untreated Celiac Disease: 2. J Pediatr Gastroenterol Nutr. 2005; 41(4):493–4. 10.1097/01.mpg.0000181858.29383.cd [DOI] [Google Scholar]
- 60.Klimov L, Kuryaninova V, Stoyan M, Zakharova I, Dmitrieva Y, Gerasimenko E, et al. HLA-DQ in patients with coeliac disease living in south Russia. J Pediatr Gastroenterol Nutr. 2017; 64:197 10.1097/01.mpg.0000516381.25680.b4 [DOI] [Google Scholar]
- 61.Laadhar L, Toumi A, Kallel-Sellami M, Zitouni M, Bouraoui S, Maherzi A, et al. HLA class II polymorphism in children with coeliac disease in Tunisia: is there any influence on clinical manifestation? Eur J Gastroenterol Hepatol. 2009; 21(11):1286–90. Epub 2009/05/29. 10.1097/MEG.0b013e32832a7d74 . [DOI] [PubMed] [Google Scholar]
- 62.Liu E, Lee HS, Aronsson CA, Hagopian WA, Koletzko S, Rewers MJ, et al. Risk of pediatric celiac disease according to HLA haplotype and country. N Engl J Med. 2014; 371(1):42–9. Epub 2014/07/06. 10.1056/NEJMoa1313977 ; PubMed Central PMCID: PMCPmc4163840. [DOI] [PMC free article] [PubMed] [Google Scholar]
- 63.Majorana A, Bardellini E, Ravelli A, Plebani A, Polimeni A, Campus G. Implications of gluten exposure period, CD clinical forms, and HLA typing in the association between celiac disease and dental enamel defects in children. A case-control study. Int J Paediatr Dent. 2010; 20(2):119–24. 10.1111/j.1365-263X.2009.01028.x [DOI] [PubMed] [Google Scholar]
- 64.Malamut G, Caillat-zucman S, Verkarre V, Sanaa F, Chatenoud L, Brousse N, et al. Impact of HLA type ii on clinical expression of celiac disease. United European Gastroenterol J. 2013; 1(1):A278–A9. 10.1177/2050640613502900 [DOI] [Google Scholar]
- 65.Maxim R, Plesa A, Ciortescu I, Cianga P, Stanciu C, Trifan A. HLA- DQB1*02 dose effect on anti-tissue transglutaminase autoantibody levels in celiac disease. Neurogastroenterol Motil. 2018; 30 10.1111/nmo.13422 [DOI] [Google Scholar]
- 66.Maxim R, Plesa A, Mazilu B, Clim A, Cianga P, Stanciu C, et al. Age of onset and diagnosis of celiac disease may be influenced by the haplotypes inherited. Neurogastroenterol Motil. 2018; 30 10.1111/nmo.13422 [DOI] [Google Scholar]
- 67.Mills JR, Katzman BM, Ettore M, Murray JA, Gandhi MJ, Snyder MR. Exploring associations between genotype and serology in celiac disease. Am J Clin Pathol. 2015; 143:A042 10.1093/ajcp/143.suppl1.043 [DOI] [Google Scholar]
- 68.Fernandez-Cavada-Pollo M, Inmaculada M, Peña A, Pérez MLV, Ruiz JM, Castellano ED, et al. Different dose effect of HLA genotype in adult versus children patients with celiac disease. Tissue Antigens. 2012; 79(6):473 10.1111/j.1399-0039.2012.01877.x [DOI] [Google Scholar]
- 69.Morreale GC, Cappello M, Arini A, Scorsone A, Provenzano V, Cutrera S, et al. HLA testing in adult-onset celiac desease: Relationship with clinical presentation and mucosal damage. Dig Liver Dis. 2016; 48:e115 10.1016/S1590-8658(16)30114-1 [DOI] [Google Scholar]
- 70.Mubarak A, Spierings E, Wolters VM, Houwen R. The human leukocyte antigen DQ B1*02 is more frequent in patients with tissue-transglutaminase antibody levels ≥100 U/mL. Gastroenterology. 2012; 142(5):S277 10.1016/S0016-5085(12)61047-6 [DOI] [Google Scholar]
- 71.Murray JA, Moore SB, Van Dyke CT, Lahr BD, Dierkhising RA, Zinsmeister AR, et al. HLA DQ gene dosage and risk and severity of celiac disease. Clin Gastroenterol Hepatol. 2007; 5(12):1406–12. Epub 2007/10/09. 10.1016/j.cgh.2007.08.013 ; PubMed Central PMCID: PMCPmc2175211. [DOI] [PMC free article] [PubMed] [Google Scholar]
- 72.Mustalahti K, Sulkanen S, Holopainen P, Laurila K, Collin P, Partanen J, et al. Coeliac disease among healthy members of multiple case coeliac disease families. Scand J Gastroenterol. 2002; 37(2):161–5. Epub 2002/02/15. 10.1080/003655202753416812 . [DOI] [PubMed] [Google Scholar]
- 73.Pena-Quintana L, Torres-Galvan MJ, Deniz-Naranjo MC, Ortigosa-Castillo L, Ramos-Varela JC, Calvo-Hernandez F, et al. Assessment of the DQ heterodimer test in the diagnosis of celiac disease in the Canary Islands (Spain). J Pediatr Gastroenterol Nutr. 2003; 37(5):604–8. Epub 2003/10/29. 10.1097/00005176-200311000-00019 . [DOI] [PubMed] [Google Scholar]
- 74.Piccini B, Vascotto M, Serracca L, Luddi A, Margollicci MA, Balestri P, et al. HLA-DQ typing in the diagnostic algorithm of celiac disease. Rev Esp Enferm Dig. 2012; 104(5):248–54. Epub 2012/06/06. . [DOI] [PubMed] [Google Scholar]
- 75.Polvi A, Eland C, Koskimies S, Maki M, Partanen J. HLA DQ and DP in Finnish families with celiac disease. Eur J Immunogenet. 1996; 23(3):221–34. Epub 1996/06/01. 10.1111/j.1744-313X.1996.tb00117.x . [DOI] [PubMed] [Google Scholar]
- 76.Senapati S, Sood A, Midha V, Sood N, Sharma S, Kumar L, et al. Shared and unique common genetic determinants between pediatric and adult celiac disease. BMC Med Genomics. 2016; 9(1):44 Epub 2016/07/28. 10.1186/s12920-016-0211-8 ; PubMed Central PMCID: PMCPmc4957920. [DOI] [PMC free article] [PubMed] [Google Scholar]
- 77.Tuysuz B, Dursun A, Kutlu T, Sokucu S, Cine N, Suoglu O, et al. HLA-DQ alleles in patients with celiac disease in Turkey. Tissue Antigens. 2001; 57(6):540–2. Epub 2001/09/15. 10.1034/j.1399-0039.2001.057006540.x . [DOI] [PubMed] [Google Scholar]
- 78.Wu R, Moleski S, Kistler CA, Colombe B, Di Marino A. The clinical characteristics of HLA genotype DQ 2.2 in a united states adult celiac disease population. Am J Gastroenterol. 2014; 109:S114 10.1038/ajg.2014.276 [DOI] [Google Scholar]
- 79.Zamani M, Modares-Sadegi M, Shirvani F, Zamani H, Emami MH. The involvement of the HLA-DQB1 alleles in the risk and the severity of Iranian coeliac disease patients. Int J Immunogenet. 2014; 41(4):312–7. Epub 2014/06/12. 10.1111/iji.12128 . [DOI] [PubMed] [Google Scholar]
- 80.Pisapia L, Camarca A, Picascia S, Bassi V, Barba P, Del Pozzo G, et al. HLA-DQ2.5 genes associated with celiac disease risk are preferentially expressed with respect to non-predisposing HLA genes: Implication for anti-gluten T cell response. J Autoimmun. 2016; 70:63–72. Epub 2016/04/17. 10.1016/j.jaut.2016.03.016 . [DOI] [PubMed] [Google Scholar]
- 81.Romanos J, van Diemen CC, Nolte IM, Trynka G, Zhernakova A, Fu J, et al. Analysis of HLA and non-HLA alleles can identify individuals at high risk for celiac disease. Gastroenterology. 2009; 137(3):834–40, 40.e1-3. 10.1053/j.gastro.2009.05.040 [DOI] [PubMed] [Google Scholar]
- 82.Husby S, Koletzko S, Korponay-Szabo IR, Mearin ML, Phillips A, Shamir R, et al. European Society for Pediatric Gastroenterology, Hepatology, and Nutrition guidelines for the diagnosis of coeliac disease. J Pediatr Gastroenterol Nutr. 2012; 54(1):136–60. Epub 2011/12/27. 10.1097/MPG.0b013e31821a23d0 . [DOI] [PubMed] [Google Scholar]
- 83.Rubio-Tapia A, Hill ID, Kelly CP, Calderwood AH, Murray JA. ACG clinical guidelines: diagnosis and management of celiac disease. Am J Gastroenterol. 2013; 108(5):656–76. Epub 2013/04/24. 10.1038/ajg.2013.79 ; PubMed Central PMCID: PMCPmc3706994. [DOI] [PMC free article] [PubMed] [Google Scholar]
Associated Data
This section collects any data citations, data availability statements, or supplementary materials included in this article.
Supplementary Materials
(DOCX)
(DOCX)
(XLSX)
CI: confidence interval.
(DOCX)
CI: confidence interval.
(DOCX)
CI: confidence interval.
(DOCX)
CI: confidence interval.
(DOCX)
CI: confidence interval.
(DOCX)
CI: confidence interval.
(DOCX)
CI: confidence interval.
(DOCX)
CI: confidence interval.
(DOCX)
(DOC)
(TXT)
(DOCX)
Data Availability Statement
All relevant data are within the paper and its Supporting Information files.