

Abstract
Predicting the growth rate of meningiomas is important in treatment planning. Although calcification may be an important sign of slow growth in meningiomas, the developmental process and its relation to the tumor growth pattern have not been elucidated. We retrospectively examined the location and degree of calcification in 150 meningiomas (131 asymptomatic tumors) using computed tomography (CT) scans and mean Hounsfield units (mHU). Tumor growth was evaluated using serial imaging studies wherein we calculated tumor doubling time (Td) and identified the growth curve pattern as exponential, intermediate, or decelerating. Tumors in women more frequently had calcification and showed higher mHU than those in men. The mHU was measured at least twice in 57 tumors. Tumors in women showed greater mHU increases than those in men. We found a significant correlation between Td and mHU (R = 0.49). Tumors in men and those in patients in the younger age group grew significantly faster. Multivariate analysis revealed that mHU was the only significant factor affecting Td (P <0.0001). The growth pattern was significantly related to calcification (n = 61, P = 0.0042). Tumors with decelerating growth more frequently showed calcification and had higher mHU than those with exponential growth. Receiver operating characteristic curve analysis revealed that mHU was a better predictor of growth pattern change compared with calcification on CT scan. Meningiomas with high mHU, even without calcification, were likely to show growth deceleration. Mean Hounsfield unit correlated with Td and may be a good quantitative indicator of the growth rate and pattern.
Keywords: calcification, CT scan, growth kinetics, Hounsfield units, meningioma
Introduction
Meningiomas are usually benign, slow-growing tumors, and are frequently diagnosed in the asymptomatic phase. While the lifetime risk of developing a meningioma is estimated to be approximately 1%,1) only a low percentage of tumors appear to become symptomatic. It is important to identify tumors likely to cause clinical symptoms in order to avoid unnecessary treatment. Treatment decisions may be based on various factors, such as growth trends, patient age, tumor size, peritumoral edema, and localization. Among these factors, growth rate is one of the most important factor, but it is difficult to predict.
Predicting growth rate is important not only in asymptomatic but also in symptomatic tumors. Jääskeläinen et al.2) first introduced the concepts of exponential growth and tumor doubling time (Td) in meningiomas. However, long-term observations based on radiological studies have demonstrated that the growth of meningiomas is not always exponential and that the majority of benign tumors show deceleration in growth.3) Other studies4–6) support these observations. In fact, a growth model similar to a Gompertzian curve has been proposed for benign meningiomas.7)
Determining the growth curve for tumors based on serial imaging studies in order to predict future growth for each tumor is a complicated process. Clinically, it is important to establish a simple method for the prediction of tumor prognosis. Many studies have attempted to define factors related to the tumor growth rate.4– 6, 8– 16) Tumor calcification might be an example of such a factor, as a sign of slow growth in meningiomas.4–6,8,10–13,15) Hashiba et al.4) reported that among a sample of asymptomatic meningiomas, 16 out of 32 tumors with calcification showed significant growth, whereas 28 out of 38 tumors without calcification demonstrated significant growth (P <0.05). In another study, Oya et al.6) found significant differences in the time to progression between tumors with and without calcification but observed no difference in annual tumor growth (0.05 cm3/year in calcification-positive tumors and 0.13 cm3/year in calcification-negative tumors, P = 0.074). The above studies did not evaluate the relationship between tumor growth and the degree or location of calcification. Moreover, it is not certain that the degree of calcification is a stable characteristic of each tumor.
In this study, we investigated changes in calcification of meningiomas using computed tomography (CT) Hounsfield units (HU). The results were compared with clinical features and tumor growth rates.
Materials and Methods
From April 2006 to March 2017, 190 meningiomas were radiologically diagnosed in 183 patients in our hospital. Patient charts were retrospectively reviewed to allow analysis of patient age at the time of the first CT scan, sex, symptoms, modality of radiological studies, and size of tumor (maximum diameter). Of the 190 identified tumors, 44 tumors were in 42 men and 146 tumors were in 141 women. Twenty-seven tumors were symptomatic, including two tumors for which the patient developed symptoms after the observational period. CT was performed for 150 tumors in 143 patients. These 150 tumors, comprising 113 tumors in women and 37 tumors in men, were the targets of this investigation. There were no differences in patient age (P = 0.26), sex (P = 0.40), tumor size (P = 0.87), or the percentage of symptomatic tumors (P = 0.31) between individuals in the study group and those in the excluded group.
This study protocol was approved by the Institutional Review Board of the relevant institution.
Evaluation of calcification
The region of interest (ROI) was set at the center of each tumor on a plain CT scan as an ellipsoid that was as large as possible (Fig. 1). We measured the mean and maximum HU in the ROI. Calcification was defined as the presence of prominent high-density spots or plaques. Maximum Hounsfield unit values greater than 60 HU were considered to indicate the presence of calcification in ambiguous cases. The location of calcification was categorized as none, no calcification; attachment, calcification on attachment; center, calcification at the center; peripheral, calcification on the periphery; diffuse, calcification of the combination of the former locations or diffuse distribution; and diffuse dense, diffuse bone-like calcification. The location and presence of calcification was independently evaluated by two of the authors. In case of discordance, we discussed the findings until agreement was reached. Inter-rater agreement was calculated using the kappa coefficient (κ). The κ values were sufficiently high for both the presence (0.94) and location (0.91) of calcification.
Fig. 1.
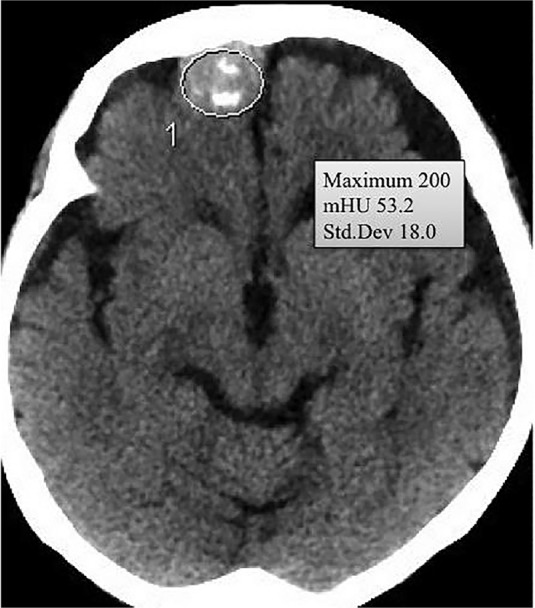
The region of interest was set at the center of each tumor on a plain computed tomography scan as an ellipsoid that was as large as possible.
Evaluation of tumor growth
Tumor growth was evaluated in serial imaging studies [CT scans or magnetic resonance (MR) images]. We measured tumor volume using ImageJ 1.42q for Macintosh software (National Institutes of Health, Bethesda, MD, USA). The area of tumor in each slice image was measured by tracing the tumor. The volume was calculated as the sum of the areas multiplied by the slice interval. The same modality of imaging was used in each patient owing to the variance between MR imaging and CT. Td and annual volume change (AVC) were calculated for each tumor that could be followed for a period longer than 1 year. One tumor was regressed during the observation period. The patient in that case received chemotherapy for breast cancer. Her tumor was excluded from the analyses following the systemic therapy.
In tumors with more than four serial images, growth curve patterns were analyzed (Fig. 2). Rapid movement of a growth curve above a linear line was defined as exponential growth. When a growth curve moved below a linear line, the curve was defined as decelerating growth. A curve that consisted of both components or was linear was defined as intermediate growth.
Fig. 2.
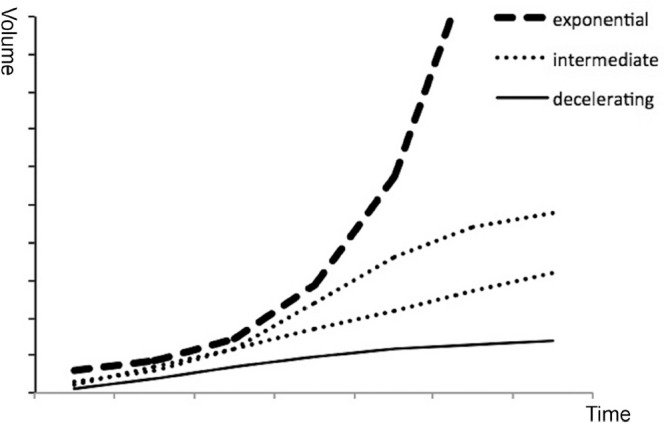
Time–volume curves of exponential, intermediate, and decelerating growth.
Statistical analyses
Statistical analyses were performed using EZR statistical software.17) Univariate analysis was conducted using Fisher’s exact test for categorical variables and the Mann–Whitney U test or Kruskal–Wallis test for continuous variables. The Steel-Dwass or Bonferroni method was used as the post hoc test. Possible candidate predictors that correlated with tumor growth were factored into the multivariable regression analysis. Receiver operating characteristic (ROC) curves were analyzed to predict the growth pattern based on the mean Hounsfield unit (mHU) value and calcification. P-values <0.05 were considered as statistically significant.
Results
Calcification and measurement of HU
Of the 150 tumors, 96 had various degrees of calcification (Figs. 3–6). We found no differences in patient age (P = 0.96), tumor size (P = 0.82), or percentage of symptomatic tumors (P = 0.085) between men and women. Tumors in women more frequently exhibited calcification (P <0.0001) and had higher mHU (median, 58.7) than those in men (median, 38.1) (P <0.0001). The difference in mHU was observed in both asymptomatic (P <0.0001) and symptomatic (P = 0.009) tumors. Asymptomatic tumors demonstrated calcification (89 in 131) more frequently than did symptomatic tumors (7 in 19) (P = 0.011).
Fig. 3.
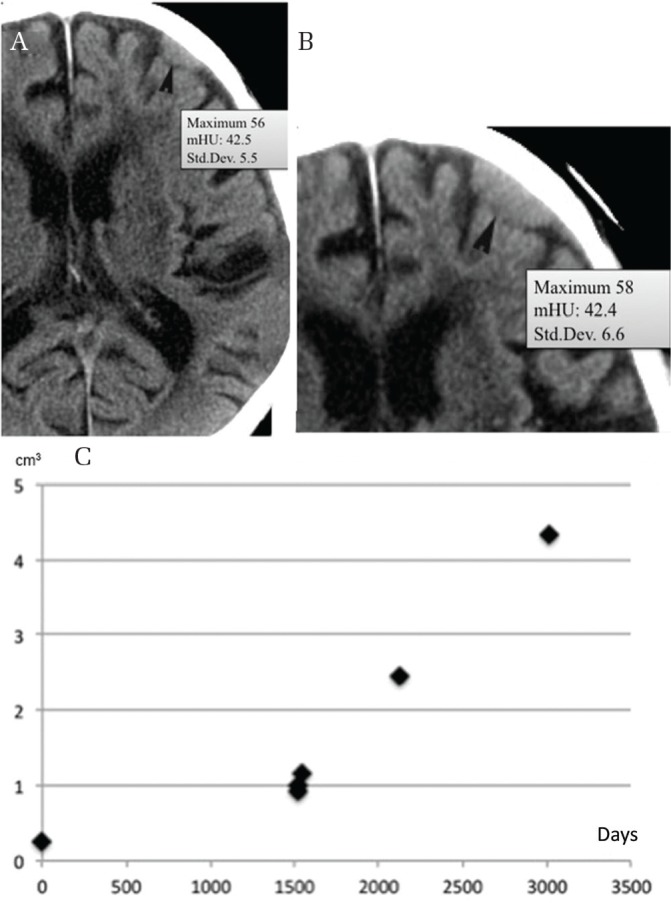
Calcification location and growth. A small non-calcified convexity meningioma (mHU, 42.5) (A) enlarging over 8.2 years without calcification (mHU, 42.4) (B) (arrowhead). Growth curve showing exponential growth (C). mHU: mean Hounsfield unit.
Fig. 4.
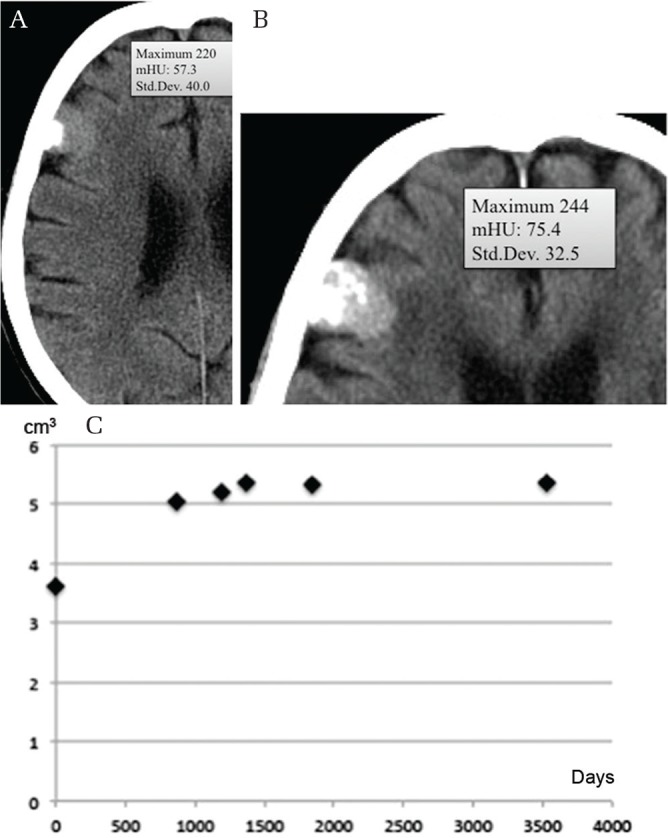
Calcification on attachment (mHU, 57.3) (A) spreading diffusely over the next 10.9 years (mHU, 75.4) (B). Time–volume curve showing decelerating growth (C). mHU: mean Hounsfield unit.
Fig. 5.

Convexity meningioma with diffuse dense calcification (A) showing decelerating growth (B).
Fig. 6.

Meningioma with central calcification (A) showing intermediate growth (B).
Tumors with higher mHU values increased in frequency with patient age (R = 0.20, P = 0.014). However, the difference in mHU between tumors in patients in the younger (younger than 65 years) and older age groups did not reach significance (P = 0.16).
In 57 tumors, the mHU was measured at least twice with an interval longer than 1 year (Figs. 3A and 3B). The median increase in mHU per year was 2.2 units. Tumors in women showed greater increase in mHU than those in men (P = 0.0011).
Tumor growth rate and pattern
Tumor doubling time was calculated in 91 tumors. The median follow-up duration for these tumors was 1467 days (1–11 years). We found a significant correlation between Td and mHU (R = 0.49, P < 0.0001). Tumors in women had significantly longer Tds than those in men (Table 1). Larger tumors tended to have longer Tds (R = 0.29, P = 0.006). Tumors in patients in the younger age group showed faster growth (median Td, 2862 days) than those in patients in the older age group (median Td, 3962 days) (P = 0.048). Multivariate analysis revealed that mHU was the only significant factor correlated with Td (P <0.0001).
Table 1.
Predictive factors for tumor growth rate
| Tumor doubling time (days) | Annual volume change (cm3) | |
|---|---|---|
| Univariate analyses | ||
| Sex (median value) | W: 4589 vs. M: 2086, P = 0.0007 | W: 0.10 vs. M: 0.22, P = 0.084 |
| Age (median value) | Y: 2862 vs. O: 3962, P = 0.048 | Y: 0.098 vs. O: 0.14, P = 0.83 |
| Calcification (median value) | None: 2086 vs. Calc: 4628, P <0.0001 | None: 0.22 vs. Calc: 0.10, P = 0.1 |
| Size | R = 0.29, P = 0.006 | R = 0.26, P = 0.015 |
| Mean Hounsfield unit | R = 0.49, P <0.0001 | R = −0.14, P = 0.19 |
| Multivariate analyses | ||
|---|---|---|
| Sex | P = 0.21 | P = 0.09 |
| Age | P = 0.19 | P = 0.81 |
| Calcification | P = 0.34 | P = 0.15 |
| Size | P = 0.10 | P = 0.0015 |
| Mean Hounsfield unit | P = 0.0002 | P = 0.47 |
W: women, M: men, Y: younger-age group (<65 years old), O: older-age group, None: calcification-negative, Calc: calcification-positive.
Annual volume change was not related to patient sex (P = 0.084), age group (P = 0.83), or mHU (R = −0.14, P = 0.19), but was weakly correlated with size (R = 0.26, P = 0.015). Calcification did not affect the AVC (P = 0.11). Multivariate analysis revealed that tumor size was the only significant factor correlating with AVC (P = 0.0017).
Growth curve patterns were evaluated in 61 tumors (Table 2). The growth pattern demonstrated a significant relationship with the presence of calcification (P <0.0015). Post hoc tests revealed that tumors with a decelerating growth curve (Figs. 4C and 5B) were more likely to have calcification than were tumors with an exponential growth curve (Fig. 3C) (P = 0.014) or an intermediate growth curve (Fig. 6B) (P = 0.017). Similarly, mHU and mHU change per year were significantly different in tumors with different growth patterns (P <0.0001 and P = 0.035, respectively) (Table 2). Post-hoc tests revealed that tumors with an exponential growth curve had lower mHU and smaller changes in mHU than did those with a decelerating growth curve (P = 0.0002 and 0.029). The differences between tumors with intermediate growth curves and those with exponential or decelerating growth curves did not reach significance.
Table 2.
Calcification and growth curve patterns
| Exponential growth | Intermediate growth | Decelerating growth | P-value | |
|---|---|---|---|---|
| Calcification-positive | 3 | 11 | 25 | 0.0015 |
| Calcification-negative | 6 | 12 | 4 | |
| Median mHU | 39.2 | 47 | 68.3 | <0.0001 |
| Median mHU change per year | 0.36 | 0.83 | 2.59 | 0.035 |
mHU: mean Hounsfield units.
Receiver operating characteristic curve analysis revealed that mHU of 45.9 was a cut-off point [area under the curve (AUC) = 0.87, specificity = 1.0, sensitivity = 0.77] for discrimination between exponential and non-exponential (including decelerating and intermediate) growth patterns. The mHU could provide superior growth pattern discrimination compared with the presence of calcification on CT (AUC = 0.68, specificity = 0.67, sensitivity = 0.69) (P = 0.016) (Fig. 7). When the growth patterns were categorized as decelerating and non-decelerating (including exponential and intermediate groups), ROC curve analysis yielded a similar result (AUC of mHU = 0.81 vs. AUC of calcification = 0.69, P = 0.013).
Fig. 7.
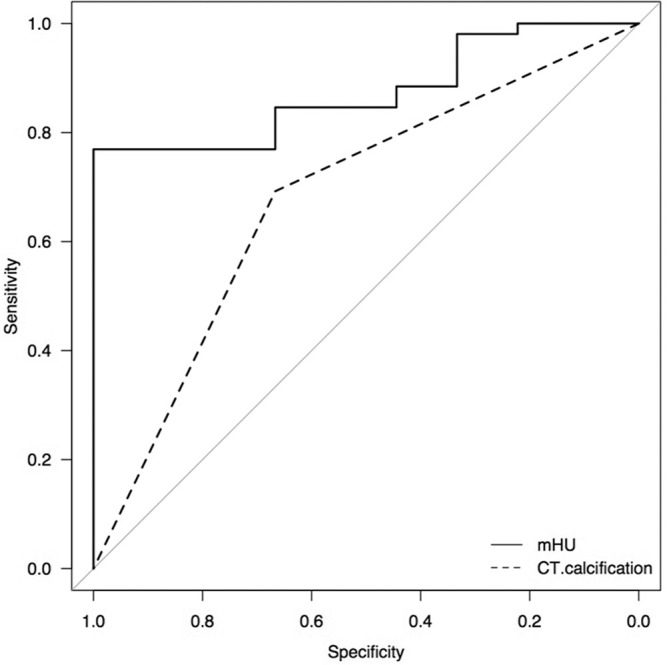
Receiver operating characteristic curve showing that the mHU discriminates the growth pattern better than the presence of calcification on computed tomography (P= 0.016). mHU: mean Hounsfield unit.
Calcification location and growth
The location of calcification had a significant relationship with Td (P = 0.0001), but not with AVC (P = 0.34). Non-calcified tumors had faster Td compared with tumors in the diffuse and diffuse dense calcification groups (post-hoc test, P = 0.0026 and 0.0005, respectively). Only three tumors with calcification showed exponential growth. Two of the six tumors with peripheral calcification demonstrated exponential growth (Fig. 8), while only one of the 32 tumors with another type of calcification had exponential growth (P = 0.059).
Fig. 8.

Meningioma with peripheral calcification (mHU, 39.2) (A) enlarged during the next 4.4 years (B) with minimal mHU change (mHU, 40.3). Growth curve showing exponential growth (C). mHU: mean Hounsfield unit.
Sixteen diffuse dense calcified tumors had long Tds (median, 7085 days) that correlated with mHU (R = 0.57, P = 0.022). All of the Tds of these tumors were longer than 9 years. While we could evaluate the growth pattern in eight dense calcified tumors, all of them showed a decelerating growth curve. Considering the median age of the patients with diffuse dense calcified tumors (79 years), their growth appears clinically negligible.
Discussion
This is the first study to investigate the progress of calcification in meningiomas along with mHU changes and precise analyses of tumor growth. Previous studies had shown a relationship between slow tumor growth and calcification. However, meningiomas display various degrees of calcification in various locations. In the current study, we describe the relationship between the degree of calcification (mHU) and the growth pattern and demonstrate that progression of calcification is related to growth deceleration.
Clinical factors related to tumor growth
We found that meningiomas in women were more likely to have calcification than those in men. It is known that the majority of psammomatous meningiomas arise in women.18) Very few studies have assessed the frequency of tumor calcification demonstrated on CT in men compared to that in women. Nakamura et al.11) reported that 10 out of 37 tumors in women had calcification, while none of four tumors in men did. Our study revealed that not only the frequency, but also mHU and mHU changes were significantly greater in tumors in women compared to those in men. Although a relatively high percentage of asymptomatic tumors were observed in women, the tendency for high mHU values in the tumors in women was observed in both symptomatic and asymptomatic meningiomas.
We observed faster Tds in tumors in men. Reports of differences in the rate of tumor growth between the sexes have been controversial. Some researchers have reported that meningiomas grow faster in men than in women,5,6) while others have not found such a difference.4, 9, 10, 13, 16)
This inconsistency may be due to the fact that a majority of the inconclusive studies included a small number of tumors in men (fewer than 10).4,9,13,16)
Patient age is likely to affect the growth rate of tumors.6,11,16) We found a significant difference in Td between the younger and older patient age groups. This is concordant with the finding that some meningiomas decelerated in growth with time.
Calcification and tumor growth
Calcification in meningiomas occurs not only as psammoma bodies, but also as calcification of the connective tissue. The formation of the former was considered to be a cell death process.19,20) It is logical that a deceleration in growth would be correlated with degenerative changes in tumors. In fact, the proliferative potential in meningiomas, as measured using an MIB-1 antibody, is lower in calcified tumors than in non-calcified ones.12)
Interestingly, in the current study, some tumors with peripheral calcification showed exponential growth, indicating that the actual growth rate in these tumors may be faster than that in tumors with other types of calcification. It is possible that the peripheral calcification may originate from the surrounding structures but not from the tumor itself. Because of the small number of tumors of this type in the present study, further histological evaluation is necessary.
Although CT is useful in delineating calcification, CT images are not sufficiently sensitive to show calcification at the microscopic level. Detection of an increase in mHU may be a better method to assess microscopic calcification. We identified a significant correlation between Td and mHU. However, the correlation coefficient was not very high. This finding is partly owing to the differences in the timing of CT scans in each case. In some tumors, mHU was measured at the beginning of or during the period of Td calculation, but this was not the case for other tumors. Another reason for the above observation may be that there are many factors other than calcification that affect mHU. These include cellularity, water content, and lipids. Variations in tissue components lead to variability in the mHU in each tumor. Despite the above issues, progression of calcification in each tumor was associated with an increased mHU and growth deceleration. Accordingly, we observed a correlation between Td and mHU.
MR imaging findings and tumor growth
Several studies have reported the relationship between T2-weighted image (T2WI) intensity and growth speed in meningiomas.5, 6, 11, 15) Low-intensity tumors on T2WI may have calcification more frequently and show a low proliferative potential.12) Tumors with low signal intensity on T2WI may grow slowly,5) while those with high signal intensity may grow rapidly.6,11,15) These studies categorized tumors as low-, iso-, and high-intensity on T2WI, but did not assess inter-rater agreement. It is sometimes difficult to categorize tumors as one entity because of the frequent mixed features of meningiomas. A strict criterion with high inter-rater agreement to categorize tumor intensity on T2WI will be necessary.
Diffusion MR imaging may be another interesting method for evaluation of the proliferative potential of meningiomas. Apparent diffusion coefficients were significantly lower in high-grade meningiomas than in low-grade meningiomas.21,22)
These MR features may reflect histological structures such as cellularity, while mHU may represent a degenerative calcification process. Combination of these radiological findings may be useful in the prediction of growth rate and pattern in meningiomas in future studies.
Measurement of tumor growth rate
The manner in which tumor growth rate is described is an important issue. Annual tumor diameter increase is an easily available indicator of tumor growth.8,9,14,15) However, this method is insensitive to subtle growth, especially in a small tumor. Furthermore, it is unlikely that a tumor maintains a constant increase in diameter every year. Recent studies have emphasized the importance of volumetry in the follow-up of meningiomas.3– 7, 11) In this study, we used Td and AVC as tumor growth parameters. Td is the index of exponential growth, while AVC is that of linear growth. However, benign meningiomas are likely to exhibit a complex growth pattern similar to a Gompertzian curve with a gradually decelerating growth rate after quasi-exponential proliferation.7) In fact, in this study, the tumors were characterized by exponential, intermediate, and decelerating growth curves. Therefore, neither Td nor AVC may be a good indicator for growth estimation over a long period.
A large tumor has a larger proliferating cell population compared with a small tumor when the growth fraction (proliferation index) is the same. If two tumors with different sizes have an equivalent growth fraction with the same cell cycle time and cell loss, they have the same value of Td. However, their actual volume gains would depend on the initial volume. Therefore, AVC is strongly related to the size of a tumor, as shown in this study and others.5,6,13,16) In contrast, our study revealed that larger tumors tended to have longer Tds (R = 0.29, P = 0.006) as presumed in the Gompertzian growth curve. This finding may indicate that larger tumors have a lower proliferation index but larger actual volume gain than smaller tumors. Therefore, using AVC would obscure other related factors because meningiomas are usually slow-growing. As a possible factor more clearly related to growth potential, some investigators have used annual vol% change as an indicator.4,11) However, the latter approximates exponential growth when the annual vol% is calculated using the compound interest method. For these reasons, we prefer to use Td as an indicator of growth rate for meningiomas, although we are aware of its limitations. Since Td is an index used to predict tumor growth rate in the exponential phase, Td overestimates actual growth in the intermediate and decelerating growth phases.
It is very important to know the growth curve pattern of a tumor when estimating future tumor size. Usually, growth curves can be simulated using serial imaging studies. At least three data points over a period longer than 1 year are necessary. Four or more imaging studies would provide better data due to the presence of volumetry errors. However, owing to the inconvenience of obtaining multiple imaging datasets, a simpler method of determining growth rate is necessary. In this study, we found that a change in growth pattern from exponential to decelerating was related to the appearance of calcification. Furthermore, our study indicated that mHU may be a better indicator of growth pattern change than calcification on CT scan.
Study limitations
This study was a retrospective analysis with several limitations. We planned to include all meningiomas diagnosed during the study period. However, no CT scan was available in about one-quarter of cases. Fortunately, there were no differences in patient age, sex distribution, tumor size, or percentage of symptomatic tumors between the study group and the excluded group. Therefore, we believe that there is very little deviation in clinical data between the two groups. Large symptomatic tumors could not be included in the tumor growth kinetic study. This limitation might have led to deviations in size and median Td, as shown in Table 1. The finding that larger tumors tended to have longer Tds might be influenced by the case selection bias. However, we found no differences in patient age (P = 0.30) or sex (P = 0.73) between the entire meningioma group and the tumors in the growth kinetic study (data not shown). We also observed a similar frequency of calcification (P = 0.99) and similar mHUs (P = 0.50) in CT scans for tumors with and without the growth analyses.
Another limitation of this study was the lack of histological analysis in a majority of the cases. This series may have thus included other types of tumors such as osteomas, which we attempted to exclude using the diagnostic criteria described by Avrahami et al.23) Since we sometimes excluded inappropriate images from the study, the imaging intervals were varied and prolonged in a few cases. A prospective study with planned interval imaging may better delineate the timing of changes in the growth pattern and the mHU cut-off point.
Conclusion
In this study, we showed that meningiomas in women not only had more frequent calcification, but also exhibited faster evolution of calcification compared with meningiomas in men. These findings correlated with slower tumor growth in women. A meningioma without calcification in a young man is most likely to demonstrate rapid growth. Tumors in the exponential growth phase exhibit relatively low mHU with very low mHU change. Notably, the appearance of calcification may reflect a change in the growth pattern. Tumors with calcification are more likely to show decelerating tumor growth. Even in cases without distinct calcification, however, increases in mHU may imply the beginning of growth deceleration. ROC analysis revealed that mHU was a better predictor of a change in the growth pattern compared with calcification on CT scan. mHU, which correlated with Td, may be a good quantitative indicator of tumor growth rate and growth pattern.
Acknowledgment
The authors are grateful to Dr. Yoko Nakasu for her valuable advice.
Footnotes
Conflicts of Interest Disclosure
The authors report no conflict of interest concerning the materials or methods used in this study or the findings specified in this paper.
References
- 1).Perry A, Louis DN, Budka H, Von Deimling A: Meningiomas. In Louis DN, Ohgaki H, Wiestler OD, Cavenee WK. (eds): WHO Classification of Tumours of the Central Nervous System, ed 4 Lyon, IARC Press, 2016, pp. 232–245 [Google Scholar]
- 2).Jääskeläinen J, Haltia M, Laasonen E, Wahlström T, Valtonen S: The growth rate of intracranial meningiomas and its relation to histology. An analysis of 43 patients. Surg Neurol 24: 165–172, 1985 [DOI] [PubMed] [Google Scholar]
- 3).Nakasu S, Fukami T, Nakajima M, Watanabe K, Ichikawa M, Matsuda M: Growth pattern changes of meningiomas: long-term growth analysis. Neurosurgery 56: 946–955, 2005 [PubMed] [Google Scholar]
- 4).Hashiba T, Hashimoto N, Izumoto S, et al. : Serial volumetric assessment of the natural history and growth pattern of incidentally discovered meningiomas. J Neurosurg 110: 675–684, 2009 [DOI] [PubMed] [Google Scholar]
- 5).Lee EJ, Kim JH, Park ES, et al. : A novel weighted scoring system for estimating the risk of rapid growth in untreated intracranial meningiomas. J Neurosurg 127: 971–980, 2017 [DOI] [PubMed] [Google Scholar]
- 6).Oya S, Kim SH, Sade B, Lee JH: The natural history of intracranial meningiomas. J Neurosurg 114: 1250–1256, 2011 [DOI] [PubMed] [Google Scholar]
- 7).Nakasu S, Nakasu Y, Fukami T, Jito J, Nozaki K: Growth curve analysis of asymptomatic and symptomatic meningiomas. J Neurooncol 102: 303–310, 2011 [DOI] [PubMed] [Google Scholar]
- 8).Herscovici Z, Rappaport Z, Sulkes J, Danaila L, Rubin G: Natural history of conservatively treated meningiomas. Neurology 63: 1133–1134,2004 [DOI] [PubMed] [Google Scholar]
- 9).Jadid KD, Feychting M, Höijer J, Hylin S, Kihlström L, Mathiesen T: Long-term follow-up of incidentally discovere meningiomas. Acta Neurochir (Wien) 157: 225–230, 2015 [DOI] [PubMed] [Google Scholar]
- 10).Kuratsu J, Kochi M, Ushio Y: Incidence and clinical features of asymptomatic meningiomas. J Neurosurg 92: 766–770, 2000 [DOI] [PubMed] [Google Scholar]
- 11).Nakamura M, Roser F, Michel J, Jacobs C, Samii M: The natural history of incidental meningiomas. Neurosurgery 53: 62–70; discussion 70–71, 2003 [DOI] [PubMed] [Google Scholar]
- 12).Nakasu S, Nakajima M, Matsumura K, Nakasu Y, Handa J: Meningioma: proliferating potential and clinicoradiological features. Neurosurgery 37: 1049–1055, 1995 [DOI] [PubMed] [Google Scholar]
- 13).Niiro M, Yatsushiro K, Nakamura K, Kawahara Y, Kuratsu J: Natural history of elderly patients with asymptomatic meningiomas. J Neurol Neurosurg Psychiatry 68: 25–28, 2000 [DOI] [PMC free article] [PubMed] [Google Scholar]
- 14).Olivero WC, Lister JR, Elwood PW: The natural history and growth rate of asymptomatic meningiomas: a review of 60 patients. J Neurosurg 83: 222–224, 1995 [DOI] [PubMed] [Google Scholar]
- 15).Yano S, Kuratsu J, Kumamoto Brain Tumor Research Group : Indications for surgery in patients with asymptomatic meningiomas based on an extensive experience. J Neurosurg 105: 538–543, 2006 [DOI] [PubMed] [Google Scholar]
- 16).Yoneoka Y, Fujii Y, Tanaka R: Growth of incidental meningiomas. Acta Neurochir (Wien) 142: 507–511, 2000 [DOI] [PubMed] [Google Scholar]
- 17).Kanda Y: Investigation of the freely available easy-to-use software ‘EZR’ for medical statistics. Bone Marrow Transplant 48: 452–458, 2013 [DOI] [PMC free article] [PubMed] [Google Scholar]
- 18).Lin Z, Zhao M, Ren X, et al. : Clinical features, radiologic findings, and surgical outcomes of 65 intracranial psammomatous meningiomas. World Neurosurg 100: 395–406, 2017 [DOI] [PubMed] [Google Scholar]
- 19).Das DK: Psammoma body: a product of dystrophic calcification or of a biologically active process that aims at limiting the growth and spread of tumor? Diagn Cytopathol 37: 534–541, 2009 [DOI] [PubMed] [Google Scholar]
- 20).Kubota T, Sato K, Yamamoto S, Hirano A: Ultrastructural study of the formation of psammoma bodies in fibroblastic meningioma. J Neurosurg 60: 512–517, 1984 [DOI] [PubMed] [Google Scholar]
- 21).Watanabe Y, Yamasaki F, Kajiwara Y, et al. : Preoperative histological grading of meningiomas using apparent diffusion coefficient at 3T MRI. Eur J Radiol 82: 658–663, 2013 [DOI] [PubMed] [Google Scholar]
- 22).Lin L, Bhawana R, Xue Y, et al. : Comparative analysis of diffusional kurtosis imaging, diffusion tensor imaging, and diffusion-weighted imaging in grading and assessing cellular proliferation of meningiomas. AJNR Am J Neuroradiol 39: 1032–1038, 2018 [DOI] [PMC free article] [PubMed] [Google Scholar]
- 23).Avrahami E, Even I: Osteoma of the inner table of the skull—CT diagnosis. Clin Radiol 55: 435–438, 2000 [DOI] [PubMed] [Google Scholar]